
Key Insights
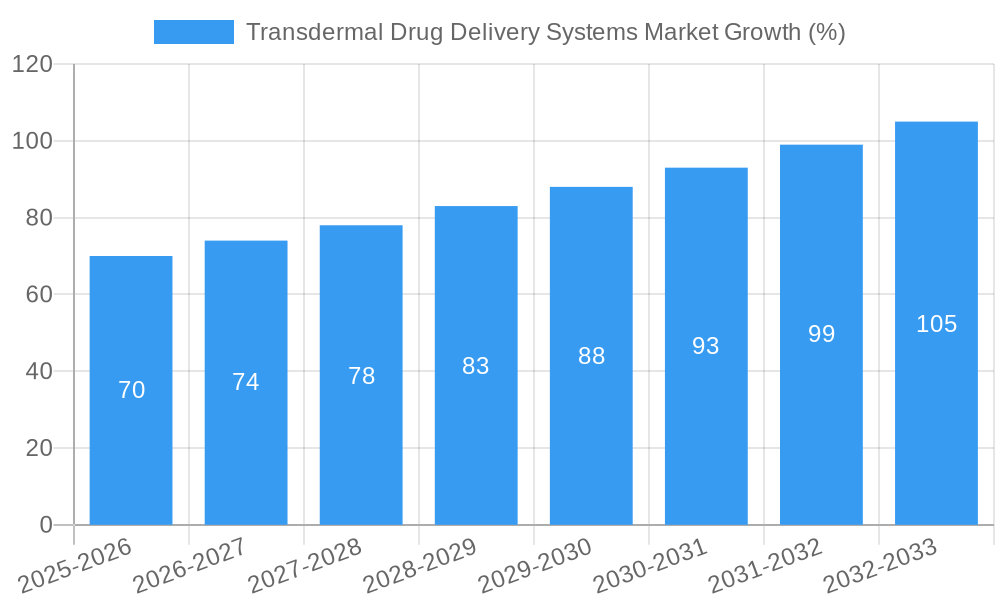
The transdermal drug delivery systems (TDDS) market, a significant segment within the broader drug delivery systems market, is experiencing robust growth, driven by several key factors. The market's 5.46% CAGR (2019-2024) indicates a strong trajectory, projected to continue into the forecast period (2025-2033). This growth is fueled by increasing patient preference for non-invasive drug administration methods, offering improved convenience and patient compliance compared to oral or injectable options. Technological advancements in patch design, leading to enhanced drug permeation and controlled release profiles, are further contributing to market expansion. Furthermore, the rising prevalence of chronic diseases requiring long-term medication management, coupled with the growing geriatric population, significantly boosts demand for TDDS. The market is segmented by drug type and therapeutic area, with significant opportunities existing in pain management, hormone replacement therapy, and cardiovascular disease treatments. Competition among major pharmaceutical and medical device companies is intense, driving innovation and expansion of product portfolios within this segment.
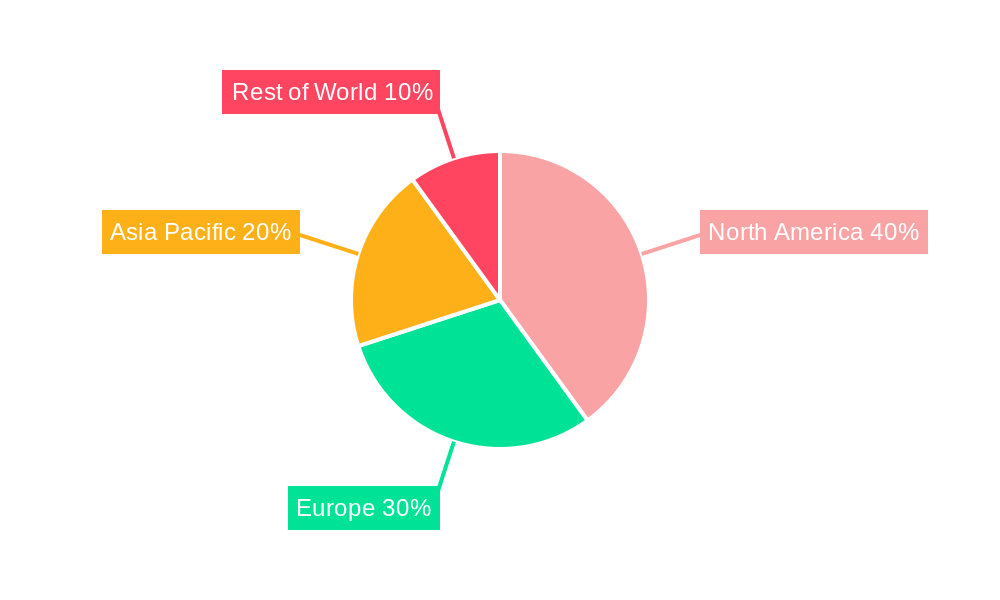
Geographical analysis reveals that North America currently holds a leading market share due to high healthcare expenditure, advanced healthcare infrastructure, and a strong regulatory environment. However, Asia-Pacific is expected to exhibit significant growth in the coming years, driven by increasing healthcare awareness, rising disposable incomes, and expanding pharmaceutical markets in countries like China and India. Europe also maintains a substantial market presence, fueled by an aging population and rising demand for convenient drug delivery systems. While challenges such as skin irritation and potential drug interactions exist, ongoing research and development efforts are focused on addressing these limitations, further solidifying the future prospects of the TDDS market. The market's robust growth is expected to continue, propelled by innovation, expanding applications, and favorable demographic shifts across key regions.
Transdermal Drug Delivery Systems Market: A Comprehensive Report (2019-2033)
This detailed report provides a comprehensive analysis of the global Transdermal Drug Delivery Systems Market, offering invaluable insights for stakeholders across the pharmaceutical and healthcare industries. With a study period spanning 2019-2033, a base year of 2025, and a forecast period of 2025-2033, this report leverages historical data (2019-2024) to project future market trends and opportunities. The market is projected to reach a value of xx Billion by 2033, exhibiting a robust CAGR of xx%.
Transdermal Drug Delivery Systems Market Market Structure & Competitive Dynamics
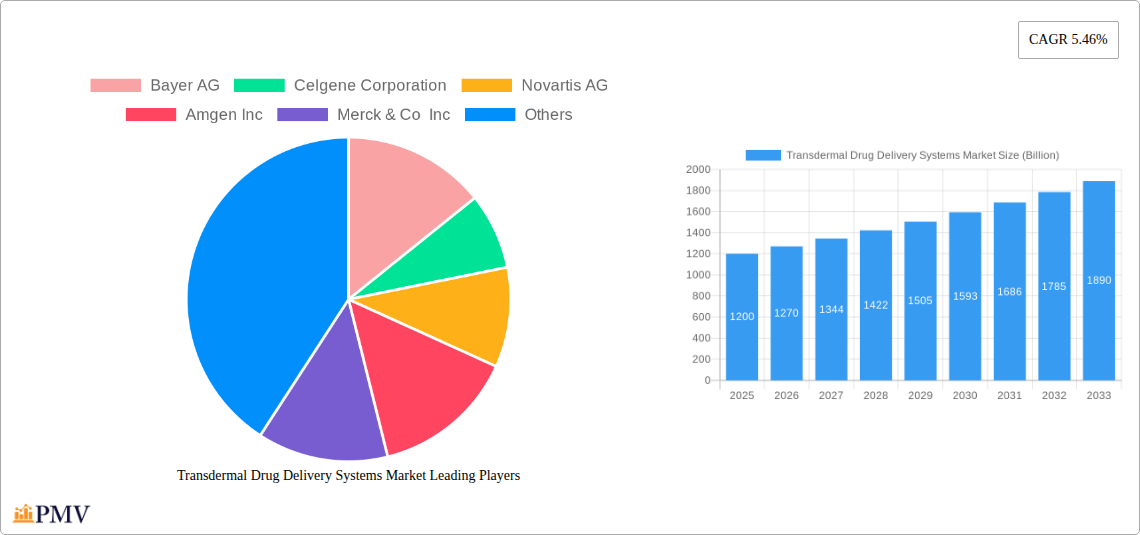
The Transdermal Drug Delivery Systems market is characterized by a moderately concentrated landscape with several multinational pharmaceutical giants holding significant market share. Key players, including Bayer AG, Celgene Corporation, Novartis AG, Amgen Inc, Merck & Co Inc, AstraZeneca PLC, Abbott Laboratories, Spectrum Pharmaceuticals Inc, Bristol-Myers Squibb, F Hoffmann-La Roche AG, Johnson & Johnson, Boston Scientific Corporation, GlaxoSmithKline PLC, and Pfizer Inc, compete intensely, driving innovation and shaping market dynamics. The market share of these companies varies significantly, with some holding dominant positions in specific segments. Recent years have witnessed a surge in M&A activities, with deal values exceeding xx Billion in the past five years, primarily driven by the strategic acquisition of smaller companies possessing innovative transdermal drug delivery technologies. This consolidates market share and broadens product portfolios. The regulatory landscape plays a crucial role, influencing product approvals and market entry strategies. Substitutes, such as oral and injectable medications, pose competitive pressure, necessitating continuous innovation to maintain market competitiveness. End-user trends, such as a growing preference for convenient and non-invasive drug administration methods, significantly influence market growth. The innovation ecosystem is highly dynamic, with significant investments in research and development fueling the development of novel transdermal patches and delivery systems.
Transdermal Drug Delivery Systems Market Industry Trends & Insights
The Transdermal Drug Delivery Systems market is experiencing robust growth, driven by several key factors. The increasing prevalence of chronic diseases requiring long-term medication, the growing preference for non-invasive drug delivery methods, and continuous technological advancements leading to improved drug efficacy and patient compliance are major contributors to this expansion. The market penetration of transdermal drug delivery systems is gradually increasing, particularly in developed regions with high healthcare expenditure. Technological disruptions, such as the development of microneedle patches and advanced materials, are enhancing the efficiency and convenience of transdermal drug delivery. Consumer preferences are shifting towards personalized medicine and smart drug delivery systems, further driving market innovation. Competitive dynamics are characterized by intense R&D efforts, strategic partnerships, and product differentiation, ultimately benefiting consumers through improved treatment options and affordability. The market is anticipated to exhibit a CAGR of xx% during the forecast period (2025-2033), driven by these underlying trends.
Dominant Markets & Segments in Transdermal Drug Delivery Systems Market
- By Mode of NDDS: The Controlled Drug Delivery Systems segment dominates the market due to its precise control over drug release, offering improved therapeutic efficacy and reduced side effects. Key drivers include increasing demand for sustained-release medications and technological advancements enhancing drug delivery precision.
- By Route of Administration: The Transdermal Drug Delivery Systems segment is the most dominant, owing to its non-invasive nature, patient convenience, and improved compliance compared to other routes. The market growth is driven by rising chronic disease prevalence and preference for painless delivery.
Regional Dominance: North America currently holds the largest market share, driven by high healthcare expenditure, advanced medical infrastructure, and a large patient population with chronic diseases. However, the Asia-Pacific region is experiencing rapid growth due to rising healthcare awareness, increasing disposable incomes, and expanding pharmaceutical industries.
Transdermal Drug Delivery Systems Market Product Innovations
Recent advancements in transdermal drug delivery systems focus on improving drug permeation, enhancing patient comfort, and integrating smart technologies for personalized drug delivery. Microneedle patches offer painless drug administration, while advanced materials, such as hydrogels and polymers, enable controlled drug release and extended therapeutic effects. These innovations are tailored to improve patient compliance and therapeutic outcomes, contributing to greater market acceptance and driving segment growth.
Report Segmentation & Scope
This report comprehensively segments the Transdermal Drug Delivery Systems market based on:
- By Mode of NDDS: Targeted Drug Delivery Systems, Controlled Drug Delivery Systems, and Modulated Drug Delivery Systems. Each segment exhibits unique growth trajectories driven by specific technological advancements and clinical applications.
- By Route of Administration: Oral Drug Delivery Systems, Injectable Drug Delivery Systems, Pulmonary Drug Delivery Systems, Transdermal Drug Delivery Systems, and Other Routes of Administration. The report analyzes the market size, growth potential, and competitive landscape for each route.
Each segment's analysis includes detailed projections for market size, growth rates, and competitive dynamics.
Key Drivers of Transdermal Drug Delivery Systems Market Growth
Technological advancements, such as the development of microneedle patches and improved drug formulations, are key drivers. The rising prevalence of chronic diseases necessitates convenient and effective drug delivery systems. Favorable regulatory frameworks supporting the development and approval of new transdermal drug delivery technologies contribute significantly to market expansion. Furthermore, increasing patient preference for non-invasive and self-administered drug delivery options fuels market growth.
Challenges in the Transdermal Drug Delivery Systems Market Sector
Regulatory hurdles, including stringent approval processes and complex clinical trials, pose significant challenges to market entry for new products. Supply chain disruptions and fluctuations in raw material costs impact the production and availability of transdermal patches. Intense competition among established pharmaceutical companies necessitates continuous innovation to maintain a competitive edge.
Leading Players in the Transdermal Drug Delivery Systems Market Market
- Bayer AG
- Celgene Corporation
- Novartis AG
- Amgen Inc
- Merck & Co Inc
- AstraZeneca PLC
- Abbott Laboratories
- Spectrum Pharmaceuticals Inc
- Bristol-Myers Squibb
- F Hoffmann-La Roche AG
- Johnson & Johnson
- Boston Scientific Corporation
- GlaxoSmithKline PLC
- Pfizer Inc
Key Developments in Transdermal Drug Delivery Systems Market Sector
- June 2022: Esteve Pharmaceuticals GmbH launched INBRIJA 33 mg (levodopa inhalation powder, hard capsules) in Germany, expanding treatment options for Parkinson's disease.
- June 2022: EVERSANA and Accord BioPharma partnered to support the launch of CAMCEVI (leuprolide) 42mg, enhancing market access for advanced prostate cancer treatment.
Strategic Transdermal Drug Delivery Systems Market Market Outlook
The future of the Transdermal Drug Delivery Systems market is promising, with continued growth driven by technological advancements, increasing prevalence of chronic diseases, and growing demand for convenient and effective drug delivery methods. Strategic opportunities lie in developing innovative transdermal patches with enhanced drug delivery capabilities, focusing on personalized medicine, and expanding into emerging markets. The market presents substantial growth potential for companies that can effectively address the challenges and leverage the emerging trends in drug delivery technology.
Transdermal Drug Delivery Systems Market Segmentation
-
1. Route of Administration
- 1.1. Oral Drug Delivery Systems
- 1.2. Injectable Drug Delivery Systems
- 1.3. Pulmonary Drug Delivery Systems
- 1.4. Transdermal Drug Delivery Systems
- 1.5. Other Routes of Administration
-
2. Mode of NDDS
- 2.1. Targeted Drug Delivery Systems
- 2.2. Controlled Drug Delivery Systems
- 2.3. Modulated Drug Delivery Systems
Transdermal Drug Delivery Systems Market Segmentation By Geography
-
1. North America
- 1.1. United States
- 1.2. Canada
- 1.3. Mexico
-
2. Europe
- 2.1. Germany
- 2.2. United Kingdom
- 2.3. France
- 2.4. Italy
- 2.5. Spain
- 2.6. Rest of Europe
-
3. Asia Pacific
- 3.1. China
- 3.2. Japan
- 3.3. India
- 3.4. Australia
- 3.5. South Korea
- 3.6. Rest of Asia Pacific
-
4. Middle East and Africa
- 4.1. GCC
- 4.2. South Africa
- 4.3. Rest of Middle East and Africa
-
5. South America
- 5.1. Brazil
- 5.2. Argentina
- 5.3. Rest of South America
Transdermal Drug Delivery Systems Market REPORT HIGHLIGHTS
| Aspects | Details |
|---|---|
| Study Period | 2019-2033 |
| Base Year | 2024 |
| Estimated Year | 2025 |
| Forecast Period | 2025-2033 |
| Historical Period | 2019-2024 |
| Growth Rate | CAGR of 5.46% from 2019-2033 |
| Segmentation |
|
Table of Contents
- 1. Introduction
- 1.1. Research Scope
- 1.2. Market Segmentation
- 1.3. Research Methodology
- 1.4. Definitions and Assumptions
- 2. Executive Summary
- 2.1. Introduction
- 3. Market Dynamics
- 3.1. Introduction
- 3.2. Market Drivers
- 3.2.1. Rising Need of Controlled Release of Drugs; Technological and Pharmacological Advancements Promoting the Development of NDDS; Rising Burden of Cancer Coupled with Increasing Researches in Novel Drug Delivery System for Cancer
- 3.3. Market Restrains
- 3.3.1. Stringent Regulatory Guidelines and Product Recalls; Stability Issues
- 3.4. Market Trends
- 3.4.1. Oral Drug Delivery Systems Segment is Expected to Occupy a Significant Share Over the Forecast Period
- 4. Market Factor Analysis
- 4.1. Porters Five Forces
- 4.2. Supply/Value Chain
- 4.3. PESTEL analysis
- 4.4. Market Entropy
- 4.5. Patent/Trademark Analysis
- 5. Global Transdermal Drug Delivery Systems Market Analysis, Insights and Forecast, 2019-2031
- 5.1. Market Analysis, Insights and Forecast - by Route of Administration
- 5.1.1. Oral Drug Delivery Systems
- 5.1.2. Injectable Drug Delivery Systems
- 5.1.3. Pulmonary Drug Delivery Systems
- 5.1.4. Transdermal Drug Delivery Systems
- 5.1.5. Other Routes of Administration
- 5.2. Market Analysis, Insights and Forecast - by Mode of NDDS
- 5.2.1. Targeted Drug Delivery Systems
- 5.2.2. Controlled Drug Delivery Systems
- 5.2.3. Modulated Drug Delivery Systems
- 5.3. Market Analysis, Insights and Forecast - by Region
- 5.3.1. North America
- 5.3.2. Europe
- 5.3.3. Asia Pacific
- 5.3.4. Middle East and Africa
- 5.3.5. South America
- 5.1. Market Analysis, Insights and Forecast - by Route of Administration
- 6. North America Transdermal Drug Delivery Systems Market Analysis, Insights and Forecast, 2019-2031
- 6.1. Market Analysis, Insights and Forecast - by Route of Administration
- 6.1.1. Oral Drug Delivery Systems
- 6.1.2. Injectable Drug Delivery Systems
- 6.1.3. Pulmonary Drug Delivery Systems
- 6.1.4. Transdermal Drug Delivery Systems
- 6.1.5. Other Routes of Administration
- 6.2. Market Analysis, Insights and Forecast - by Mode of NDDS
- 6.2.1. Targeted Drug Delivery Systems
- 6.2.2. Controlled Drug Delivery Systems
- 6.2.3. Modulated Drug Delivery Systems
- 6.1. Market Analysis, Insights and Forecast - by Route of Administration
- 7. Europe Transdermal Drug Delivery Systems Market Analysis, Insights and Forecast, 2019-2031
- 7.1. Market Analysis, Insights and Forecast - by Route of Administration
- 7.1.1. Oral Drug Delivery Systems
- 7.1.2. Injectable Drug Delivery Systems
- 7.1.3. Pulmonary Drug Delivery Systems
- 7.1.4. Transdermal Drug Delivery Systems
- 7.1.5. Other Routes of Administration
- 7.2. Market Analysis, Insights and Forecast - by Mode of NDDS
- 7.2.1. Targeted Drug Delivery Systems
- 7.2.2. Controlled Drug Delivery Systems
- 7.2.3. Modulated Drug Delivery Systems
- 7.1. Market Analysis, Insights and Forecast - by Route of Administration
- 8. Asia Pacific Transdermal Drug Delivery Systems Market Analysis, Insights and Forecast, 2019-2031
- 8.1. Market Analysis, Insights and Forecast - by Route of Administration
- 8.1.1. Oral Drug Delivery Systems
- 8.1.2. Injectable Drug Delivery Systems
- 8.1.3. Pulmonary Drug Delivery Systems
- 8.1.4. Transdermal Drug Delivery Systems
- 8.1.5. Other Routes of Administration
- 8.2. Market Analysis, Insights and Forecast - by Mode of NDDS
- 8.2.1. Targeted Drug Delivery Systems
- 8.2.2. Controlled Drug Delivery Systems
- 8.2.3. Modulated Drug Delivery Systems
- 8.1. Market Analysis, Insights and Forecast - by Route of Administration
- 9. Middle East and Africa Transdermal Drug Delivery Systems Market Analysis, Insights and Forecast, 2019-2031
- 9.1. Market Analysis, Insights and Forecast - by Route of Administration
- 9.1.1. Oral Drug Delivery Systems
- 9.1.2. Injectable Drug Delivery Systems
- 9.1.3. Pulmonary Drug Delivery Systems
- 9.1.4. Transdermal Drug Delivery Systems
- 9.1.5. Other Routes of Administration
- 9.2. Market Analysis, Insights and Forecast - by Mode of NDDS
- 9.2.1. Targeted Drug Delivery Systems
- 9.2.2. Controlled Drug Delivery Systems
- 9.2.3. Modulated Drug Delivery Systems
- 9.1. Market Analysis, Insights and Forecast - by Route of Administration
- 10. South America Transdermal Drug Delivery Systems Market Analysis, Insights and Forecast, 2019-2031
- 10.1. Market Analysis, Insights and Forecast - by Route of Administration
- 10.1.1. Oral Drug Delivery Systems
- 10.1.2. Injectable Drug Delivery Systems
- 10.1.3. Pulmonary Drug Delivery Systems
- 10.1.4. Transdermal Drug Delivery Systems
- 10.1.5. Other Routes of Administration
- 10.2. Market Analysis, Insights and Forecast - by Mode of NDDS
- 10.2.1. Targeted Drug Delivery Systems
- 10.2.2. Controlled Drug Delivery Systems
- 10.2.3. Modulated Drug Delivery Systems
- 10.1. Market Analysis, Insights and Forecast - by Route of Administration
- 11. North America Transdermal Drug Delivery Systems Market Analysis, Insights and Forecast, 2019-2031
- 11.1. Market Analysis, Insights and Forecast - By Country/Sub-region
- 11.1.1 United States
- 11.1.2 Canada
- 11.1.3 Mexico
- 12. South America Transdermal Drug Delivery Systems Market Analysis, Insights and Forecast, 2019-2031
- 12.1. Market Analysis, Insights and Forecast - By Country/Sub-region
- 12.1.1 Brazil
- 12.1.2 Mexico
- 12.1.3 Rest of South America
- 13. Europe Transdermal Drug Delivery Systems Market Analysis, Insights and Forecast, 2019-2031
- 13.1. Market Analysis, Insights and Forecast - By Country/Sub-region
- 13.1.1 United Kingdom
- 13.1.2 Germany
- 13.1.3 France
- 13.1.4 Italy
- 13.1.5 Spain
- 13.1.6 Russia
- 13.1.7 Rest of Europe
- 14. Asia Pacific Transdermal Drug Delivery Systems Market Analysis, Insights and Forecast, 2019-2031
- 14.1. Market Analysis, Insights and Forecast - By Country/Sub-region
- 14.1.1 China
- 14.1.2 Japan
- 14.1.3 India
- 14.1.4 South Korea
- 14.1.5 Taiwan
- 14.1.6 Australia
- 14.1.7 Rest of Asia-Pacific
- 15. MEA Transdermal Drug Delivery Systems Market Analysis, Insights and Forecast, 2019-2031
- 15.1. Market Analysis, Insights and Forecast - By Country/Sub-region
- 15.1.1 Middle East
- 15.1.2 Africa
- 16. Competitive Analysis
- 16.1. Global Market Share Analysis 2024
- 16.2. Company Profiles
- 16.2.1 Bayer AG
- 16.2.1.1. Overview
- 16.2.1.2. Products
- 16.2.1.3. SWOT Analysis
- 16.2.1.4. Recent Developments
- 16.2.1.5. Financials (Based on Availability)
- 16.2.2 Celgene Corporation
- 16.2.2.1. Overview
- 16.2.2.2. Products
- 16.2.2.3. SWOT Analysis
- 16.2.2.4. Recent Developments
- 16.2.2.5. Financials (Based on Availability)
- 16.2.3 Novartis AG
- 16.2.3.1. Overview
- 16.2.3.2. Products
- 16.2.3.3. SWOT Analysis
- 16.2.3.4. Recent Developments
- 16.2.3.5. Financials (Based on Availability)
- 16.2.4 Amgen Inc
- 16.2.4.1. Overview
- 16.2.4.2. Products
- 16.2.4.3. SWOT Analysis
- 16.2.4.4. Recent Developments
- 16.2.4.5. Financials (Based on Availability)
- 16.2.5 Merck & Co Inc
- 16.2.5.1. Overview
- 16.2.5.2. Products
- 16.2.5.3. SWOT Analysis
- 16.2.5.4. Recent Developments
- 16.2.5.5. Financials (Based on Availability)
- 16.2.6 AstraZeneca PLC
- 16.2.6.1. Overview
- 16.2.6.2. Products
- 16.2.6.3. SWOT Analysis
- 16.2.6.4. Recent Developments
- 16.2.6.5. Financials (Based on Availability)
- 16.2.7 Abbott Laboratories
- 16.2.7.1. Overview
- 16.2.7.2. Products
- 16.2.7.3. SWOT Analysis
- 16.2.7.4. Recent Developments
- 16.2.7.5. Financials (Based on Availability)
- 16.2.8 Spectrum Pharmaceuticals Inc*List Not Exhaustive
- 16.2.8.1. Overview
- 16.2.8.2. Products
- 16.2.8.3. SWOT Analysis
- 16.2.8.4. Recent Developments
- 16.2.8.5. Financials (Based on Availability)
- 16.2.9 Bristol-Myers Squibb
- 16.2.9.1. Overview
- 16.2.9.2. Products
- 16.2.9.3. SWOT Analysis
- 16.2.9.4. Recent Developments
- 16.2.9.5. Financials (Based on Availability)
- 16.2.10 F Hoffmann-La Roche AG
- 16.2.10.1. Overview
- 16.2.10.2. Products
- 16.2.10.3. SWOT Analysis
- 16.2.10.4. Recent Developments
- 16.2.10.5. Financials (Based on Availability)
- 16.2.11 Johnson & Johnson
- 16.2.11.1. Overview
- 16.2.11.2. Products
- 16.2.11.3. SWOT Analysis
- 16.2.11.4. Recent Developments
- 16.2.11.5. Financials (Based on Availability)
- 16.2.12 Boston Scientific Corporation
- 16.2.12.1. Overview
- 16.2.12.2. Products
- 16.2.12.3. SWOT Analysis
- 16.2.12.4. Recent Developments
- 16.2.12.5. Financials (Based on Availability)
- 16.2.13 GlaxoSmithKline PLC
- 16.2.13.1. Overview
- 16.2.13.2. Products
- 16.2.13.3. SWOT Analysis
- 16.2.13.4. Recent Developments
- 16.2.13.5. Financials (Based on Availability)
- 16.2.14 Pfizer Inc
- 16.2.14.1. Overview
- 16.2.14.2. Products
- 16.2.14.3. SWOT Analysis
- 16.2.14.4. Recent Developments
- 16.2.14.5. Financials (Based on Availability)
- 16.2.1 Bayer AG
List of Figures
- Figure 1: Global Transdermal Drug Delivery Systems Market Revenue Breakdown (Billion, %) by Region 2024 & 2032
- Figure 2: Global Transdermal Drug Delivery Systems Market Volume Breakdown (K Units, %) by Region 2024 & 2032
- Figure 3: North America Transdermal Drug Delivery Systems Market Revenue (Billion), by Country 2024 & 2032
- Figure 4: North America Transdermal Drug Delivery Systems Market Volume (K Units), by Country 2024 & 2032
- Figure 5: North America Transdermal Drug Delivery Systems Market Revenue Share (%), by Country 2024 & 2032
- Figure 6: North America Transdermal Drug Delivery Systems Market Volume Share (%), by Country 2024 & 2032
- Figure 7: South America Transdermal Drug Delivery Systems Market Revenue (Billion), by Country 2024 & 2032
- Figure 8: South America Transdermal Drug Delivery Systems Market Volume (K Units), by Country 2024 & 2032
- Figure 9: South America Transdermal Drug Delivery Systems Market Revenue Share (%), by Country 2024 & 2032
- Figure 10: South America Transdermal Drug Delivery Systems Market Volume Share (%), by Country 2024 & 2032
- Figure 11: Europe Transdermal Drug Delivery Systems Market Revenue (Billion), by Country 2024 & 2032
- Figure 12: Europe Transdermal Drug Delivery Systems Market Volume (K Units), by Country 2024 & 2032
- Figure 13: Europe Transdermal Drug Delivery Systems Market Revenue Share (%), by Country 2024 & 2032
- Figure 14: Europe Transdermal Drug Delivery Systems Market Volume Share (%), by Country 2024 & 2032
- Figure 15: Asia Pacific Transdermal Drug Delivery Systems Market Revenue (Billion), by Country 2024 & 2032
- Figure 16: Asia Pacific Transdermal Drug Delivery Systems Market Volume (K Units), by Country 2024 & 2032
- Figure 17: Asia Pacific Transdermal Drug Delivery Systems Market Revenue Share (%), by Country 2024 & 2032
- Figure 18: Asia Pacific Transdermal Drug Delivery Systems Market Volume Share (%), by Country 2024 & 2032
- Figure 19: MEA Transdermal Drug Delivery Systems Market Revenue (Billion), by Country 2024 & 2032
- Figure 20: MEA Transdermal Drug Delivery Systems Market Volume (K Units), by Country 2024 & 2032
- Figure 21: MEA Transdermal Drug Delivery Systems Market Revenue Share (%), by Country 2024 & 2032
- Figure 22: MEA Transdermal Drug Delivery Systems Market Volume Share (%), by Country 2024 & 2032
- Figure 23: North America Transdermal Drug Delivery Systems Market Revenue (Billion), by Route of Administration 2024 & 2032
- Figure 24: North America Transdermal Drug Delivery Systems Market Volume (K Units), by Route of Administration 2024 & 2032
- Figure 25: North America Transdermal Drug Delivery Systems Market Revenue Share (%), by Route of Administration 2024 & 2032
- Figure 26: North America Transdermal Drug Delivery Systems Market Volume Share (%), by Route of Administration 2024 & 2032
- Figure 27: North America Transdermal Drug Delivery Systems Market Revenue (Billion), by Mode of NDDS 2024 & 2032
- Figure 28: North America Transdermal Drug Delivery Systems Market Volume (K Units), by Mode of NDDS 2024 & 2032
- Figure 29: North America Transdermal Drug Delivery Systems Market Revenue Share (%), by Mode of NDDS 2024 & 2032
- Figure 30: North America Transdermal Drug Delivery Systems Market Volume Share (%), by Mode of NDDS 2024 & 2032
- Figure 31: North America Transdermal Drug Delivery Systems Market Revenue (Billion), by Country 2024 & 2032
- Figure 32: North America Transdermal Drug Delivery Systems Market Volume (K Units), by Country 2024 & 2032
- Figure 33: North America Transdermal Drug Delivery Systems Market Revenue Share (%), by Country 2024 & 2032
- Figure 34: North America Transdermal Drug Delivery Systems Market Volume Share (%), by Country 2024 & 2032
- Figure 35: Europe Transdermal Drug Delivery Systems Market Revenue (Billion), by Route of Administration 2024 & 2032
- Figure 36: Europe Transdermal Drug Delivery Systems Market Volume (K Units), by Route of Administration 2024 & 2032
- Figure 37: Europe Transdermal Drug Delivery Systems Market Revenue Share (%), by Route of Administration 2024 & 2032
- Figure 38: Europe Transdermal Drug Delivery Systems Market Volume Share (%), by Route of Administration 2024 & 2032
- Figure 39: Europe Transdermal Drug Delivery Systems Market Revenue (Billion), by Mode of NDDS 2024 & 2032
- Figure 40: Europe Transdermal Drug Delivery Systems Market Volume (K Units), by Mode of NDDS 2024 & 2032
- Figure 41: Europe Transdermal Drug Delivery Systems Market Revenue Share (%), by Mode of NDDS 2024 & 2032
- Figure 42: Europe Transdermal Drug Delivery Systems Market Volume Share (%), by Mode of NDDS 2024 & 2032
- Figure 43: Europe Transdermal Drug Delivery Systems Market Revenue (Billion), by Country 2024 & 2032
- Figure 44: Europe Transdermal Drug Delivery Systems Market Volume (K Units), by Country 2024 & 2032
- Figure 45: Europe Transdermal Drug Delivery Systems Market Revenue Share (%), by Country 2024 & 2032
- Figure 46: Europe Transdermal Drug Delivery Systems Market Volume Share (%), by Country 2024 & 2032
- Figure 47: Asia Pacific Transdermal Drug Delivery Systems Market Revenue (Billion), by Route of Administration 2024 & 2032
- Figure 48: Asia Pacific Transdermal Drug Delivery Systems Market Volume (K Units), by Route of Administration 2024 & 2032
- Figure 49: Asia Pacific Transdermal Drug Delivery Systems Market Revenue Share (%), by Route of Administration 2024 & 2032
- Figure 50: Asia Pacific Transdermal Drug Delivery Systems Market Volume Share (%), by Route of Administration 2024 & 2032
- Figure 51: Asia Pacific Transdermal Drug Delivery Systems Market Revenue (Billion), by Mode of NDDS 2024 & 2032
- Figure 52: Asia Pacific Transdermal Drug Delivery Systems Market Volume (K Units), by Mode of NDDS 2024 & 2032
- Figure 53: Asia Pacific Transdermal Drug Delivery Systems Market Revenue Share (%), by Mode of NDDS 2024 & 2032
- Figure 54: Asia Pacific Transdermal Drug Delivery Systems Market Volume Share (%), by Mode of NDDS 2024 & 2032
- Figure 55: Asia Pacific Transdermal Drug Delivery Systems Market Revenue (Billion), by Country 2024 & 2032
- Figure 56: Asia Pacific Transdermal Drug Delivery Systems Market Volume (K Units), by Country 2024 & 2032
- Figure 57: Asia Pacific Transdermal Drug Delivery Systems Market Revenue Share (%), by Country 2024 & 2032
- Figure 58: Asia Pacific Transdermal Drug Delivery Systems Market Volume Share (%), by Country 2024 & 2032
- Figure 59: Middle East and Africa Transdermal Drug Delivery Systems Market Revenue (Billion), by Route of Administration 2024 & 2032
- Figure 60: Middle East and Africa Transdermal Drug Delivery Systems Market Volume (K Units), by Route of Administration 2024 & 2032
- Figure 61: Middle East and Africa Transdermal Drug Delivery Systems Market Revenue Share (%), by Route of Administration 2024 & 2032
- Figure 62: Middle East and Africa Transdermal Drug Delivery Systems Market Volume Share (%), by Route of Administration 2024 & 2032
- Figure 63: Middle East and Africa Transdermal Drug Delivery Systems Market Revenue (Billion), by Mode of NDDS 2024 & 2032
- Figure 64: Middle East and Africa Transdermal Drug Delivery Systems Market Volume (K Units), by Mode of NDDS 2024 & 2032
- Figure 65: Middle East and Africa Transdermal Drug Delivery Systems Market Revenue Share (%), by Mode of NDDS 2024 & 2032
- Figure 66: Middle East and Africa Transdermal Drug Delivery Systems Market Volume Share (%), by Mode of NDDS 2024 & 2032
- Figure 67: Middle East and Africa Transdermal Drug Delivery Systems Market Revenue (Billion), by Country 2024 & 2032
- Figure 68: Middle East and Africa Transdermal Drug Delivery Systems Market Volume (K Units), by Country 2024 & 2032
- Figure 69: Middle East and Africa Transdermal Drug Delivery Systems Market Revenue Share (%), by Country 2024 & 2032
- Figure 70: Middle East and Africa Transdermal Drug Delivery Systems Market Volume Share (%), by Country 2024 & 2032
- Figure 71: South America Transdermal Drug Delivery Systems Market Revenue (Billion), by Route of Administration 2024 & 2032
- Figure 72: South America Transdermal Drug Delivery Systems Market Volume (K Units), by Route of Administration 2024 & 2032
- Figure 73: South America Transdermal Drug Delivery Systems Market Revenue Share (%), by Route of Administration 2024 & 2032
- Figure 74: South America Transdermal Drug Delivery Systems Market Volume Share (%), by Route of Administration 2024 & 2032
- Figure 75: South America Transdermal Drug Delivery Systems Market Revenue (Billion), by Mode of NDDS 2024 & 2032
- Figure 76: South America Transdermal Drug Delivery Systems Market Volume (K Units), by Mode of NDDS 2024 & 2032
- Figure 77: South America Transdermal Drug Delivery Systems Market Revenue Share (%), by Mode of NDDS 2024 & 2032
- Figure 78: South America Transdermal Drug Delivery Systems Market Volume Share (%), by Mode of NDDS 2024 & 2032
- Figure 79: South America Transdermal Drug Delivery Systems Market Revenue (Billion), by Country 2024 & 2032
- Figure 80: South America Transdermal Drug Delivery Systems Market Volume (K Units), by Country 2024 & 2032
- Figure 81: South America Transdermal Drug Delivery Systems Market Revenue Share (%), by Country 2024 & 2032
- Figure 82: South America Transdermal Drug Delivery Systems Market Volume Share (%), by Country 2024 & 2032
List of Tables
- Table 1: Global Transdermal Drug Delivery Systems Market Revenue Billion Forecast, by Region 2019 & 2032
- Table 2: Global Transdermal Drug Delivery Systems Market Volume K Units Forecast, by Region 2019 & 2032
- Table 3: Global Transdermal Drug Delivery Systems Market Revenue Billion Forecast, by Route of Administration 2019 & 2032
- Table 4: Global Transdermal Drug Delivery Systems Market Volume K Units Forecast, by Route of Administration 2019 & 2032
- Table 5: Global Transdermal Drug Delivery Systems Market Revenue Billion Forecast, by Mode of NDDS 2019 & 2032
- Table 6: Global Transdermal Drug Delivery Systems Market Volume K Units Forecast, by Mode of NDDS 2019 & 2032
- Table 7: Global Transdermal Drug Delivery Systems Market Revenue Billion Forecast, by Region 2019 & 2032
- Table 8: Global Transdermal Drug Delivery Systems Market Volume K Units Forecast, by Region 2019 & 2032
- Table 9: Global Transdermal Drug Delivery Systems Market Revenue Billion Forecast, by Country 2019 & 2032
- Table 10: Global Transdermal Drug Delivery Systems Market Volume K Units Forecast, by Country 2019 & 2032
- Table 11: United States Transdermal Drug Delivery Systems Market Revenue (Billion) Forecast, by Application 2019 & 2032
- Table 12: United States Transdermal Drug Delivery Systems Market Volume (K Units) Forecast, by Application 2019 & 2032
- Table 13: Canada Transdermal Drug Delivery Systems Market Revenue (Billion) Forecast, by Application 2019 & 2032
- Table 14: Canada Transdermal Drug Delivery Systems Market Volume (K Units) Forecast, by Application 2019 & 2032
- Table 15: Mexico Transdermal Drug Delivery Systems Market Revenue (Billion) Forecast, by Application 2019 & 2032
- Table 16: Mexico Transdermal Drug Delivery Systems Market Volume (K Units) Forecast, by Application 2019 & 2032
- Table 17: Global Transdermal Drug Delivery Systems Market Revenue Billion Forecast, by Country 2019 & 2032
- Table 18: Global Transdermal Drug Delivery Systems Market Volume K Units Forecast, by Country 2019 & 2032
- Table 19: Brazil Transdermal Drug Delivery Systems Market Revenue (Billion) Forecast, by Application 2019 & 2032
- Table 20: Brazil Transdermal Drug Delivery Systems Market Volume (K Units) Forecast, by Application 2019 & 2032
- Table 21: Mexico Transdermal Drug Delivery Systems Market Revenue (Billion) Forecast, by Application 2019 & 2032
- Table 22: Mexico Transdermal Drug Delivery Systems Market Volume (K Units) Forecast, by Application 2019 & 2032
- Table 23: Rest of South America Transdermal Drug Delivery Systems Market Revenue (Billion) Forecast, by Application 2019 & 2032
- Table 24: Rest of South America Transdermal Drug Delivery Systems Market Volume (K Units) Forecast, by Application 2019 & 2032
- Table 25: Global Transdermal Drug Delivery Systems Market Revenue Billion Forecast, by Country 2019 & 2032
- Table 26: Global Transdermal Drug Delivery Systems Market Volume K Units Forecast, by Country 2019 & 2032
- Table 27: United Kingdom Transdermal Drug Delivery Systems Market Revenue (Billion) Forecast, by Application 2019 & 2032
- Table 28: United Kingdom Transdermal Drug Delivery Systems Market Volume (K Units) Forecast, by Application 2019 & 2032
- Table 29: Germany Transdermal Drug Delivery Systems Market Revenue (Billion) Forecast, by Application 2019 & 2032
- Table 30: Germany Transdermal Drug Delivery Systems Market Volume (K Units) Forecast, by Application 2019 & 2032
- Table 31: France Transdermal Drug Delivery Systems Market Revenue (Billion) Forecast, by Application 2019 & 2032
- Table 32: France Transdermal Drug Delivery Systems Market Volume (K Units) Forecast, by Application 2019 & 2032
- Table 33: Italy Transdermal Drug Delivery Systems Market Revenue (Billion) Forecast, by Application 2019 & 2032
- Table 34: Italy Transdermal Drug Delivery Systems Market Volume (K Units) Forecast, by Application 2019 & 2032
- Table 35: Spain Transdermal Drug Delivery Systems Market Revenue (Billion) Forecast, by Application 2019 & 2032
- Table 36: Spain Transdermal Drug Delivery Systems Market Volume (K Units) Forecast, by Application 2019 & 2032
- Table 37: Russia Transdermal Drug Delivery Systems Market Revenue (Billion) Forecast, by Application 2019 & 2032
- Table 38: Russia Transdermal Drug Delivery Systems Market Volume (K Units) Forecast, by Application 2019 & 2032
- Table 39: Rest of Europe Transdermal Drug Delivery Systems Market Revenue (Billion) Forecast, by Application 2019 & 2032
- Table 40: Rest of Europe Transdermal Drug Delivery Systems Market Volume (K Units) Forecast, by Application 2019 & 2032
- Table 41: Global Transdermal Drug Delivery Systems Market Revenue Billion Forecast, by Country 2019 & 2032
- Table 42: Global Transdermal Drug Delivery Systems Market Volume K Units Forecast, by Country 2019 & 2032
- Table 43: China Transdermal Drug Delivery Systems Market Revenue (Billion) Forecast, by Application 2019 & 2032
- Table 44: China Transdermal Drug Delivery Systems Market Volume (K Units) Forecast, by Application 2019 & 2032
- Table 45: Japan Transdermal Drug Delivery Systems Market Revenue (Billion) Forecast, by Application 2019 & 2032
- Table 46: Japan Transdermal Drug Delivery Systems Market Volume (K Units) Forecast, by Application 2019 & 2032
- Table 47: India Transdermal Drug Delivery Systems Market Revenue (Billion) Forecast, by Application 2019 & 2032
- Table 48: India Transdermal Drug Delivery Systems Market Volume (K Units) Forecast, by Application 2019 & 2032
- Table 49: South Korea Transdermal Drug Delivery Systems Market Revenue (Billion) Forecast, by Application 2019 & 2032
- Table 50: South Korea Transdermal Drug Delivery Systems Market Volume (K Units) Forecast, by Application 2019 & 2032
- Table 51: Taiwan Transdermal Drug Delivery Systems Market Revenue (Billion) Forecast, by Application 2019 & 2032
- Table 52: Taiwan Transdermal Drug Delivery Systems Market Volume (K Units) Forecast, by Application 2019 & 2032
- Table 53: Australia Transdermal Drug Delivery Systems Market Revenue (Billion) Forecast, by Application 2019 & 2032
- Table 54: Australia Transdermal Drug Delivery Systems Market Volume (K Units) Forecast, by Application 2019 & 2032
- Table 55: Rest of Asia-Pacific Transdermal Drug Delivery Systems Market Revenue (Billion) Forecast, by Application 2019 & 2032
- Table 56: Rest of Asia-Pacific Transdermal Drug Delivery Systems Market Volume (K Units) Forecast, by Application 2019 & 2032
- Table 57: Global Transdermal Drug Delivery Systems Market Revenue Billion Forecast, by Country 2019 & 2032
- Table 58: Global Transdermal Drug Delivery Systems Market Volume K Units Forecast, by Country 2019 & 2032
- Table 59: Middle East Transdermal Drug Delivery Systems Market Revenue (Billion) Forecast, by Application 2019 & 2032
- Table 60: Middle East Transdermal Drug Delivery Systems Market Volume (K Units) Forecast, by Application 2019 & 2032
- Table 61: Africa Transdermal Drug Delivery Systems Market Revenue (Billion) Forecast, by Application 2019 & 2032
- Table 62: Africa Transdermal Drug Delivery Systems Market Volume (K Units) Forecast, by Application 2019 & 2032
- Table 63: Global Transdermal Drug Delivery Systems Market Revenue Billion Forecast, by Route of Administration 2019 & 2032
- Table 64: Global Transdermal Drug Delivery Systems Market Volume K Units Forecast, by Route of Administration 2019 & 2032
- Table 65: Global Transdermal Drug Delivery Systems Market Revenue Billion Forecast, by Mode of NDDS 2019 & 2032
- Table 66: Global Transdermal Drug Delivery Systems Market Volume K Units Forecast, by Mode of NDDS 2019 & 2032
- Table 67: Global Transdermal Drug Delivery Systems Market Revenue Billion Forecast, by Country 2019 & 2032
- Table 68: Global Transdermal Drug Delivery Systems Market Volume K Units Forecast, by Country 2019 & 2032
- Table 69: United States Transdermal Drug Delivery Systems Market Revenue (Billion) Forecast, by Application 2019 & 2032
- Table 70: United States Transdermal Drug Delivery Systems Market Volume (K Units) Forecast, by Application 2019 & 2032
- Table 71: Canada Transdermal Drug Delivery Systems Market Revenue (Billion) Forecast, by Application 2019 & 2032
- Table 72: Canada Transdermal Drug Delivery Systems Market Volume (K Units) Forecast, by Application 2019 & 2032
- Table 73: Mexico Transdermal Drug Delivery Systems Market Revenue (Billion) Forecast, by Application 2019 & 2032
- Table 74: Mexico Transdermal Drug Delivery Systems Market Volume (K Units) Forecast, by Application 2019 & 2032
- Table 75: Global Transdermal Drug Delivery Systems Market Revenue Billion Forecast, by Route of Administration 2019 & 2032
- Table 76: Global Transdermal Drug Delivery Systems Market Volume K Units Forecast, by Route of Administration 2019 & 2032
- Table 77: Global Transdermal Drug Delivery Systems Market Revenue Billion Forecast, by Mode of NDDS 2019 & 2032
- Table 78: Global Transdermal Drug Delivery Systems Market Volume K Units Forecast, by Mode of NDDS 2019 & 2032
- Table 79: Global Transdermal Drug Delivery Systems Market Revenue Billion Forecast, by Country 2019 & 2032
- Table 80: Global Transdermal Drug Delivery Systems Market Volume K Units Forecast, by Country 2019 & 2032
- Table 81: Germany Transdermal Drug Delivery Systems Market Revenue (Billion) Forecast, by Application 2019 & 2032
- Table 82: Germany Transdermal Drug Delivery Systems Market Volume (K Units) Forecast, by Application 2019 & 2032
- Table 83: United Kingdom Transdermal Drug Delivery Systems Market Revenue (Billion) Forecast, by Application 2019 & 2032
- Table 84: United Kingdom Transdermal Drug Delivery Systems Market Volume (K Units) Forecast, by Application 2019 & 2032
- Table 85: France Transdermal Drug Delivery Systems Market Revenue (Billion) Forecast, by Application 2019 & 2032
- Table 86: France Transdermal Drug Delivery Systems Market Volume (K Units) Forecast, by Application 2019 & 2032
- Table 87: Italy Transdermal Drug Delivery Systems Market Revenue (Billion) Forecast, by Application 2019 & 2032
- Table 88: Italy Transdermal Drug Delivery Systems Market Volume (K Units) Forecast, by Application 2019 & 2032
- Table 89: Spain Transdermal Drug Delivery Systems Market Revenue (Billion) Forecast, by Application 2019 & 2032
- Table 90: Spain Transdermal Drug Delivery Systems Market Volume (K Units) Forecast, by Application 2019 & 2032
- Table 91: Rest of Europe Transdermal Drug Delivery Systems Market Revenue (Billion) Forecast, by Application 2019 & 2032
- Table 92: Rest of Europe Transdermal Drug Delivery Systems Market Volume (K Units) Forecast, by Application 2019 & 2032
- Table 93: Global Transdermal Drug Delivery Systems Market Revenue Billion Forecast, by Route of Administration 2019 & 2032
- Table 94: Global Transdermal Drug Delivery Systems Market Volume K Units Forecast, by Route of Administration 2019 & 2032
- Table 95: Global Transdermal Drug Delivery Systems Market Revenue Billion Forecast, by Mode of NDDS 2019 & 2032
- Table 96: Global Transdermal Drug Delivery Systems Market Volume K Units Forecast, by Mode of NDDS 2019 & 2032
- Table 97: Global Transdermal Drug Delivery Systems Market Revenue Billion Forecast, by Country 2019 & 2032
- Table 98: Global Transdermal Drug Delivery Systems Market Volume K Units Forecast, by Country 2019 & 2032
- Table 99: China Transdermal Drug Delivery Systems Market Revenue (Billion) Forecast, by Application 2019 & 2032
- Table 100: China Transdermal Drug Delivery Systems Market Volume (K Units) Forecast, by Application 2019 & 2032
- Table 101: Japan Transdermal Drug Delivery Systems Market Revenue (Billion) Forecast, by Application 2019 & 2032
- Table 102: Japan Transdermal Drug Delivery Systems Market Volume (K Units) Forecast, by Application 2019 & 2032
- Table 103: India Transdermal Drug Delivery Systems Market Revenue (Billion) Forecast, by Application 2019 & 2032
- Table 104: India Transdermal Drug Delivery Systems Market Volume (K Units) Forecast, by Application 2019 & 2032
- Table 105: Australia Transdermal Drug Delivery Systems Market Revenue (Billion) Forecast, by Application 2019 & 2032
- Table 106: Australia Transdermal Drug Delivery Systems Market Volume (K Units) Forecast, by Application 2019 & 2032
- Table 107: South Korea Transdermal Drug Delivery Systems Market Revenue (Billion) Forecast, by Application 2019 & 2032
- Table 108: South Korea Transdermal Drug Delivery Systems Market Volume (K Units) Forecast, by Application 2019 & 2032
- Table 109: Rest of Asia Pacific Transdermal Drug Delivery Systems Market Revenue (Billion) Forecast, by Application 2019 & 2032
- Table 110: Rest of Asia Pacific Transdermal Drug Delivery Systems Market Volume (K Units) Forecast, by Application 2019 & 2032
- Table 111: Global Transdermal Drug Delivery Systems Market Revenue Billion Forecast, by Route of Administration 2019 & 2032
- Table 112: Global Transdermal Drug Delivery Systems Market Volume K Units Forecast, by Route of Administration 2019 & 2032
- Table 113: Global Transdermal Drug Delivery Systems Market Revenue Billion Forecast, by Mode of NDDS 2019 & 2032
- Table 114: Global Transdermal Drug Delivery Systems Market Volume K Units Forecast, by Mode of NDDS 2019 & 2032
- Table 115: Global Transdermal Drug Delivery Systems Market Revenue Billion Forecast, by Country 2019 & 2032
- Table 116: Global Transdermal Drug Delivery Systems Market Volume K Units Forecast, by Country 2019 & 2032
- Table 117: GCC Transdermal Drug Delivery Systems Market Revenue (Billion) Forecast, by Application 2019 & 2032
- Table 118: GCC Transdermal Drug Delivery Systems Market Volume (K Units) Forecast, by Application 2019 & 2032
- Table 119: South Africa Transdermal Drug Delivery Systems Market Revenue (Billion) Forecast, by Application 2019 & 2032
- Table 120: South Africa Transdermal Drug Delivery Systems Market Volume (K Units) Forecast, by Application 2019 & 2032
- Table 121: Rest of Middle East and Africa Transdermal Drug Delivery Systems Market Revenue (Billion) Forecast, by Application 2019 & 2032
- Table 122: Rest of Middle East and Africa Transdermal Drug Delivery Systems Market Volume (K Units) Forecast, by Application 2019 & 2032
- Table 123: Global Transdermal Drug Delivery Systems Market Revenue Billion Forecast, by Route of Administration 2019 & 2032
- Table 124: Global Transdermal Drug Delivery Systems Market Volume K Units Forecast, by Route of Administration 2019 & 2032
- Table 125: Global Transdermal Drug Delivery Systems Market Revenue Billion Forecast, by Mode of NDDS 2019 & 2032
- Table 126: Global Transdermal Drug Delivery Systems Market Volume K Units Forecast, by Mode of NDDS 2019 & 2032
- Table 127: Global Transdermal Drug Delivery Systems Market Revenue Billion Forecast, by Country 2019 & 2032
- Table 128: Global Transdermal Drug Delivery Systems Market Volume K Units Forecast, by Country 2019 & 2032
- Table 129: Brazil Transdermal Drug Delivery Systems Market Revenue (Billion) Forecast, by Application 2019 & 2032
- Table 130: Brazil Transdermal Drug Delivery Systems Market Volume (K Units) Forecast, by Application 2019 & 2032
- Table 131: Argentina Transdermal Drug Delivery Systems Market Revenue (Billion) Forecast, by Application 2019 & 2032
- Table 132: Argentina Transdermal Drug Delivery Systems Market Volume (K Units) Forecast, by Application 2019 & 2032
- Table 133: Rest of South America Transdermal Drug Delivery Systems Market Revenue (Billion) Forecast, by Application 2019 & 2032
- Table 134: Rest of South America Transdermal Drug Delivery Systems Market Volume (K Units) Forecast, by Application 2019 & 2032
Frequently Asked Questions
1. What is the projected Compound Annual Growth Rate (CAGR) of the Transdermal Drug Delivery Systems Market?
The projected CAGR is approximately 5.46%.
2. Which companies are prominent players in the Transdermal Drug Delivery Systems Market?
Key companies in the market include Bayer AG, Celgene Corporation, Novartis AG, Amgen Inc, Merck & Co Inc, AstraZeneca PLC, Abbott Laboratories, Spectrum Pharmaceuticals Inc*List Not Exhaustive, Bristol-Myers Squibb, F Hoffmann-La Roche AG, Johnson & Johnson, Boston Scientific Corporation, GlaxoSmithKline PLC, Pfizer Inc.
3. What are the main segments of the Transdermal Drug Delivery Systems Market?
The market segments include Route of Administration, Mode of NDDS.
4. Can you provide details about the market size?
The market size is estimated to be USD 6.9 Billion as of 2022.
5. What are some drivers contributing to market growth?
Rising Need of Controlled Release of Drugs; Technological and Pharmacological Advancements Promoting the Development of NDDS; Rising Burden of Cancer Coupled with Increasing Researches in Novel Drug Delivery System for Cancer.
6. What are the notable trends driving market growth?
Oral Drug Delivery Systems Segment is Expected to Occupy a Significant Share Over the Forecast Period.
7. Are there any restraints impacting market growth?
Stringent Regulatory Guidelines and Product Recalls; Stability Issues.
8. Can you provide examples of recent developments in the market?
June 2022: Esteve Pharmaceuticals GmbH launched INBRIJA 33 mg (levodopa inhalation powder, hard capsules) in Germany. INBRIJA is indicated in the EU for the intermittent treatment of episodic motor fluctuations in adult patients with Parkinson's disease treated with a levodopa/dopa-decarboxylase inhibitor.
9. What pricing options are available for accessing the report?
Pricing options include single-user, multi-user, and enterprise licenses priced at USD 4750, USD 5250, and USD 8750 respectively.
10. Is the market size provided in terms of value or volume?
The market size is provided in terms of value, measured in Billion and volume, measured in K Units.
11. Are there any specific market keywords associated with the report?
Yes, the market keyword associated with the report is "Transdermal Drug Delivery Systems Market," which aids in identifying and referencing the specific market segment covered.
12. How do I determine which pricing option suits my needs best?
The pricing options vary based on user requirements and access needs. Individual users may opt for single-user licenses, while businesses requiring broader access may choose multi-user or enterprise licenses for cost-effective access to the report.
13. Are there any additional resources or data provided in the Transdermal Drug Delivery Systems Market report?
While the report offers comprehensive insights, it's advisable to review the specific contents or supplementary materials provided to ascertain if additional resources or data are available.
14. How can I stay updated on further developments or reports in the Transdermal Drug Delivery Systems Market?
To stay informed about further developments, trends, and reports in the Transdermal Drug Delivery Systems Market, consider subscribing to industry newsletters, following relevant companies and organizations, or regularly checking reputable industry news sources and publications.
Methodology
Step 1 - Identification of Relevant Samples Size from Population Database


Step 2 - Approaches for Defining Global Market Size (Value, Volume* & Price*)

Note*: In applicable scenarios
Step 3 - Data Sources
Primary Research
- Web Analytics
- Survey Reports
- Research Institute
- Latest Research Reports
- Opinion Leaders
Secondary Research
- Annual Reports
- White Paper
- Latest Press Release
- Industry Association
- Paid Database
- Investor Presentations

Step 4 - Data Triangulation
Involves using different sources of information in order to increase the validity of a study
These sources are likely to be stakeholders in a program - participants, other researchers, program staff, other community members, and so on.
Then we put all data in single framework & apply various statistical tools to find out the dynamic on the market.
During the analysis stage, feedback from the stakeholder groups would be compared to determine areas of agreement as well as areas of divergence


