
Key Insights
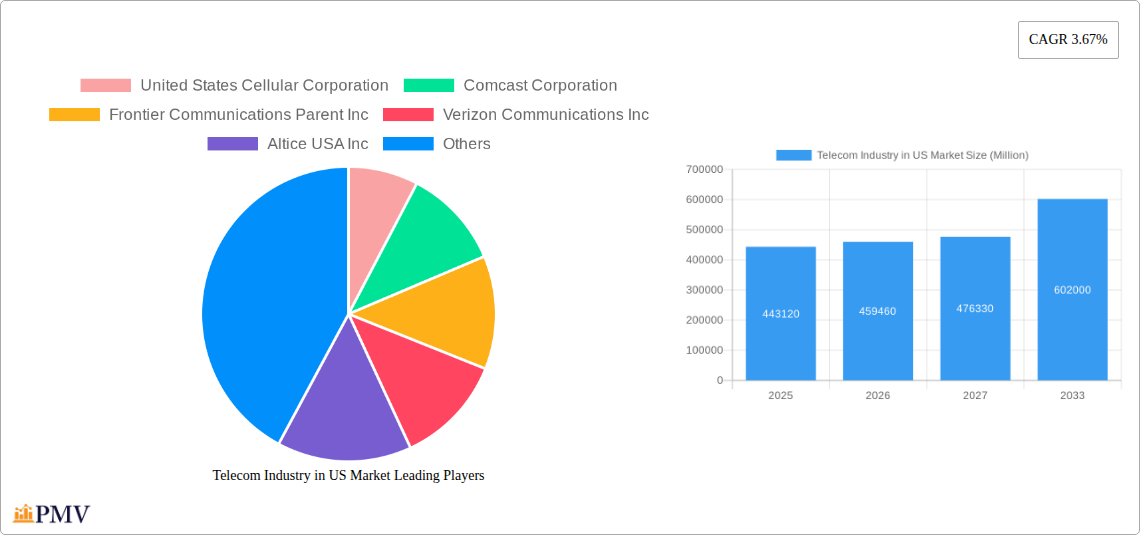
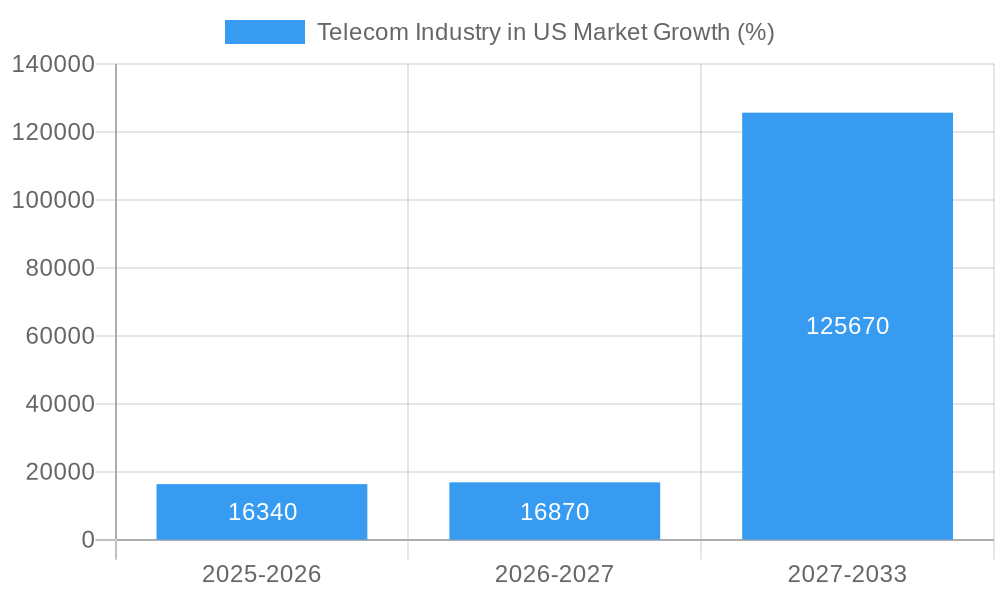
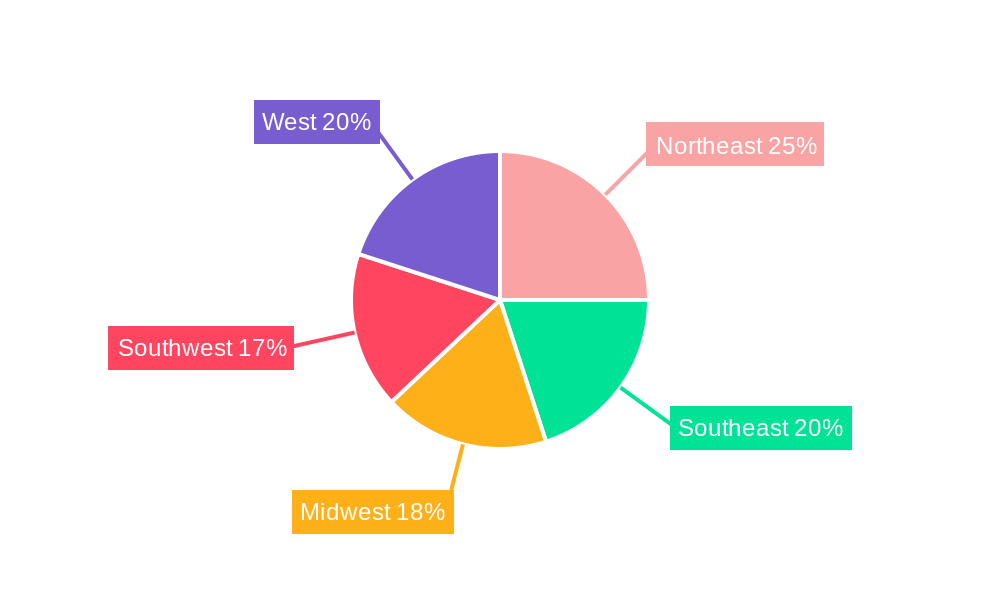
The US Telecom industry, a $443.12 billion market in 2025, is projected to experience steady growth, with a compound annual growth rate (CAGR) of 3.67% from 2025 to 2033. This growth is fueled by several key drivers. Increased adoption of high-speed internet, particularly 5G, is significantly impacting market expansion. The rising demand for data-intensive applications like streaming services and cloud computing further contributes to this growth. The ongoing migration towards bundled services, combining internet, mobile, and television packages, also presents substantial opportunities for telecom providers. However, the industry faces challenges. Intense competition among established players, including AT&T, Verizon, T-Mobile, and Comcast, necessitates continuous innovation and investment in infrastructure. Regulatory hurdles and the fluctuating costs of spectrum licenses also represent significant restraints. Market segmentation reveals a dynamic landscape. While voice services remain a component, the rapid expansion of wireless data and messaging, driven by lucrative internet and handset data packages, dominates market share. The burgeoning Over-the-Top (OTT) and Pay TV segments, while competitive, present opportunities for strategic partnerships and service diversification among telecom companies. Regional variations exist, with varying levels of infrastructure development and market penetration influencing growth rates across the Northeast, Southeast, Midwest, Southwest, and West regions of the United States. Future growth will likely be driven by technological advancements such as the further rollout of 5G networks, the expansion of fiber optic infrastructure, and the development of new services catering to the evolving needs of consumers and businesses.
The historical period (2019-2024) likely saw fluctuations influenced by economic cycles and technological shifts. Analyzing this period would reveal the specific trends that informed the current 2025 market size and the projected CAGR. Future projections necessitate continuous monitoring of consumer behavior, technological innovation, regulatory changes, and competitive dynamics. A focus on customer experience, network reliability, and data security will be critical for success in this competitive and evolving market. Strategic investments in network modernization and the development of innovative services are vital for maintaining market share and capturing new growth opportunities within the US Telecom sector. The long-term outlook remains positive, driven by the continuous demand for reliable and high-speed connectivity.
Telecom Industry in US Market: A Comprehensive Market Report (2019-2033)
This in-depth report provides a comprehensive analysis of the US Telecom industry, covering market structure, competitive dynamics, key trends, and future outlook. With a study period spanning 2019-2033, a base year of 2025, and a forecast period of 2025-2033, this report offers invaluable insights for industry professionals, investors, and strategists. The report analyzes key players like AT&T Inc, Verizon Communications Inc, T-Mobile US Inc, Comcast Corporation, and others, providing crucial data for informed decision-making. Market size estimates in Millions are provided for key segments, and all financial figures are presented in Millions of US Dollars.
Telecom Industry in US Market Market Structure & Competitive Dynamics
The US Telecom market is characterized by a complex interplay of established players, emerging competitors, and evolving regulatory landscapes. Market concentration is high, with a few dominant players controlling significant market share. The industry's innovation ecosystem thrives on technological advancements in 5G, fiber optics, and cloud computing, fostering continuous product and service evolution. However, stringent regulatory frameworks, including those concerning net neutrality and spectrum allocation, significantly impact market dynamics. Product substitutes, such as VoIP services and OTT platforms, challenge traditional telecom offerings. End-user trends, such as increasing demand for high-speed data and seamless connectivity, drive industry growth. Mergers and acquisitions (M&A) play a crucial role in shaping the competitive landscape; recent deals have involved significant capital investments, totaling approximately xx Million in the last five years.
- Market Concentration: The top 4 players hold approximately xx% of the market share.
- M&A Activity: Significant consolidation through M&A, with deal values averaging xx Million per transaction in the historical period.
- Regulatory Landscape: Stringent regulations impacting pricing, infrastructure deployment, and spectrum allocation.
- Innovation Ecosystem: Focus on 5G deployment, fiber optic expansion, and cloud-based services.
Telecom Industry in US Market Industry Trends & Insights
The US Telecom market exhibits a strong growth trajectory, driven by several key factors. The escalating demand for high-speed data, fueled by the proliferation of smartphones, IoT devices, and streaming services, is a primary growth catalyst. Technological disruptions, particularly the widespread adoption of 5G technology, are revolutionizing network capabilities, enabling faster speeds and lower latency. Consumer preferences are shifting towards bundled packages combining wireless, broadband, and entertainment services, driving convergence and competition. Competitive dynamics are intense, with incumbents and new entrants vying for market share through innovative offerings and aggressive pricing strategies. The Compound Annual Growth Rate (CAGR) for the overall market is projected to be xx% during the forecast period (2025-2033), with market penetration of xx% by 2033.
Dominant Markets & Segments in Telecom Industry in US Market
The wireless segment, particularly data and messaging services, dominates the US Telecom market. This dominance is driven by the widespread smartphone penetration and increasing data consumption. The average revenue per user (ARPU) for the overall services segment is estimated at xx in 2025.
- Wireless: Data and Messaging Services:
- Key Drivers: Increasing smartphone penetration, rising data consumption, and demand for faster speeds.
- Market Size (2025): xx Million
- Growth Projections (2025-2033): xx% CAGR
- Voice Services:
- Key Drivers: Continued demand for reliable voice communication, albeit with declining ARPU due to competition from OTT services.
- Market Size (2025): xx Million
- Growth Projections (2025-2033): xx% CAGR
- OTT and Pay TV:
- Key Drivers: Increasing consumer preference for streaming services and bundled packages.
- Market Size (2025): xx Million
- Growth Projections (2025-2033): xx% CAGR
Telecom Industry in US Market Product Innovations
Recent product innovations focus on enhancing network capabilities, improving customer experience, and expanding service offerings. The rollout of 5G networks is a major focus, along with the development of advanced data packages offering higher speeds and more data. The convergence of wireless, broadband, and entertainment services through bundled packages represents another significant trend. The market is also witnessing the introduction of innovative IoT solutions and edge computing capabilities. These technological advances aim to enhance network efficiency, service reliability, and customer satisfaction.
Report Segmentation & Scope
This report segments the US Telecom market based on service types: Voice Services, Wireless: Data and Messaging Services (including internet & handset data packages, and package discounts), and OTT and Pay TV. Each segment is analyzed in detail, covering market size, growth projections, and competitive dynamics for the period 2020-2027. The report further analyzes the market by geography, although a specific dominant region isn't explicitly highlighted. Market share data for key players in each segment is also included.
Key Drivers of Telecom Industry in US Market Growth
Several factors contribute to the growth of the US Telecom market. Technological advancements, such as the deployment of 5G networks and the increasing adoption of fiber optics, are driving improvements in network speed and capacity. Favorable economic conditions, including increasing disposable incomes and rising consumer spending, fuel demand for telecom services. Government initiatives promoting digital infrastructure development and expanding broadband access further contribute to market growth.
Challenges in the Telecom Industry in US Market Sector
The US Telecom industry faces several challenges. Stringent regulatory frameworks can limit pricing flexibility and hinder investment. Supply chain disruptions and the increasing cost of infrastructure deployment pose significant obstacles. Intense competition and the emergence of disruptive technologies create constant pressure on margins. These challenges require strategic planning and adaptation to ensure sustained growth and profitability.
Leading Players in the Telecom Industry in US Market Market
- United States Cellular Corporation
- Comcast Corporation
- Frontier Communications Parent Inc
- Verizon Communications Inc
- Altice USA Inc
- DISH Network Corporation
- Charter Communications Inc
- Lumen Technologies Inc
- Windstream Holdings Inc
- Cox Communications Inc
- AT&T Inc
- T-Mobile US Inc
Key Developments in Telecom Industry in US Market Sector
- September 2022: AT&T partnered with Ford to deliver 5G connectivity to 2023 heavy-duty Ford models, enabling faster navigation, mapping, and software upgrades.
- August 2022: T-Mobile partnered with Canva and Meta to offer free marketing resources to small businesses, including Canva Pro and USD 200 in Facebook/Instagram advertising.
Strategic Telecom Industry in US Market Market Outlook
The future of the US Telecom market appears promising, driven by ongoing technological advancements, increasing demand for high-speed data, and the expansion of 5G networks. Strategic opportunities lie in the development of innovative services, leveraging IoT and edge computing, and expanding into new markets. Companies that can effectively adapt to the evolving technological landscape and meet the demands of a connected society will likely thrive in this dynamic environment.
Telecom Industry in US Market Segmentation
-
1. Services
- 1.1. Voice Services
- 1.2. Data and
- 1.3. OTT and Pay TV
Telecom Industry in US Market Segmentation By Geography
-
1. North America
- 1.1. United States
- 1.2. Canada
- 1.3. Mexico
-
2. South America
- 2.1. Brazil
- 2.2. Argentina
- 2.3. Rest of South America
-
3. Europe
- 3.1. United Kingdom
- 3.2. Germany
- 3.3. France
- 3.4. Italy
- 3.5. Spain
- 3.6. Russia
- 3.7. Benelux
- 3.8. Nordics
- 3.9. Rest of Europe
-
4. Middle East & Africa
- 4.1. Turkey
- 4.2. Israel
- 4.3. GCC
- 4.4. North Africa
- 4.5. South Africa
- 4.6. Rest of Middle East & Africa
-
5. Asia Pacific
- 5.1. China
- 5.2. India
- 5.3. Japan
- 5.4. South Korea
- 5.5. ASEAN
- 5.6. Oceania
- 5.7. Rest of Asia Pacific
Telecom Industry in US Market REPORT HIGHLIGHTS
| Aspects | Details |
|---|---|
| Study Period | 2019-2033 |
| Base Year | 2024 |
| Estimated Year | 2025 |
| Forecast Period | 2025-2033 |
| Historical Period | 2019-2024 |
| Growth Rate | CAGR of 3.67% from 2019-2033 |
| Segmentation |
|
Table of Contents
- 1. Introduction
- 1.1. Research Scope
- 1.2. Market Segmentation
- 1.3. Research Methodology
- 1.4. Definitions and Assumptions
- 2. Executive Summary
- 2.1. Introduction
- 3. Market Dynamics
- 3.1. Introduction
- 3.2. Market Drivers
- 3.2.1. Growth of Mobile Internet Connection; Deployment of 5G network in the United States
- 3.3. Market Restrains
- 3.3.1. ; Lack of Control over Operations and Cost Visibility
- 3.4. Market Trends
- 3.4.1. Deployment of 5G Networks in the United States
- 4. Market Factor Analysis
- 4.1. Porters Five Forces
- 4.2. Supply/Value Chain
- 4.3. PESTEL analysis
- 4.4. Market Entropy
- 4.5. Patent/Trademark Analysis
- 5. Global Telecom Industry in US Market Analysis, Insights and Forecast, 2019-2031
- 5.1. Market Analysis, Insights and Forecast - by Services
- 5.1.1. Voice Services
- 5.1.2. Data and
- 5.1.3. OTT and Pay TV
- 5.2. Market Analysis, Insights and Forecast - by Region
- 5.2.1. North America
- 5.2.2. South America
- 5.2.3. Europe
- 5.2.4. Middle East & Africa
- 5.2.5. Asia Pacific
- 5.1. Market Analysis, Insights and Forecast - by Services
- 6. North America Telecom Industry in US Market Analysis, Insights and Forecast, 2019-2031
- 6.1. Market Analysis, Insights and Forecast - by Services
- 6.1.1. Voice Services
- 6.1.2. Data and
- 6.1.3. OTT and Pay TV
- 6.1. Market Analysis, Insights and Forecast - by Services
- 7. South America Telecom Industry in US Market Analysis, Insights and Forecast, 2019-2031
- 7.1. Market Analysis, Insights and Forecast - by Services
- 7.1.1. Voice Services
- 7.1.2. Data and
- 7.1.3. OTT and Pay TV
- 7.1. Market Analysis, Insights and Forecast - by Services
- 8. Europe Telecom Industry in US Market Analysis, Insights and Forecast, 2019-2031
- 8.1. Market Analysis, Insights and Forecast - by Services
- 8.1.1. Voice Services
- 8.1.2. Data and
- 8.1.3. OTT and Pay TV
- 8.1. Market Analysis, Insights and Forecast - by Services
- 9. Middle East & Africa Telecom Industry in US Market Analysis, Insights and Forecast, 2019-2031
- 9.1. Market Analysis, Insights and Forecast - by Services
- 9.1.1. Voice Services
- 9.1.2. Data and
- 9.1.3. OTT and Pay TV
- 9.1. Market Analysis, Insights and Forecast - by Services
- 10. Asia Pacific Telecom Industry in US Market Analysis, Insights and Forecast, 2019-2031
- 10.1. Market Analysis, Insights and Forecast - by Services
- 10.1.1. Voice Services
- 10.1.2. Data and
- 10.1.3. OTT and Pay TV
- 10.1. Market Analysis, Insights and Forecast - by Services
- 11. Northeast Telecom Industry in US Market Analysis, Insights and Forecast, 2019-2031
- 12. Southeast Telecom Industry in US Market Analysis, Insights and Forecast, 2019-2031
- 13. Midwest Telecom Industry in US Market Analysis, Insights and Forecast, 2019-2031
- 14. Southwest Telecom Industry in US Market Analysis, Insights and Forecast, 2019-2031
- 15. West Telecom Industry in US Market Analysis, Insights and Forecast, 2019-2031
- 16. Competitive Analysis
- 16.1. Global Market Share Analysis 2024
- 16.2. Company Profiles
- 16.2.1 United States Cellular Corporation
- 16.2.1.1. Overview
- 16.2.1.2. Products
- 16.2.1.3. SWOT Analysis
- 16.2.1.4. Recent Developments
- 16.2.1.5. Financials (Based on Availability)
- 16.2.2 Comcast Corporation
- 16.2.2.1. Overview
- 16.2.2.2. Products
- 16.2.2.3. SWOT Analysis
- 16.2.2.4. Recent Developments
- 16.2.2.5. Financials (Based on Availability)
- 16.2.3 Frontier Communications Parent Inc
- 16.2.3.1. Overview
- 16.2.3.2. Products
- 16.2.3.3. SWOT Analysis
- 16.2.3.4. Recent Developments
- 16.2.3.5. Financials (Based on Availability)
- 16.2.4 Verizon Communications Inc
- 16.2.4.1. Overview
- 16.2.4.2. Products
- 16.2.4.3. SWOT Analysis
- 16.2.4.4. Recent Developments
- 16.2.4.5. Financials (Based on Availability)
- 16.2.5 Altice USA Inc
- 16.2.5.1. Overview
- 16.2.5.2. Products
- 16.2.5.3. SWOT Analysis
- 16.2.5.4. Recent Developments
- 16.2.5.5. Financials (Based on Availability)
- 16.2.6 DISH Network Corporation
- 16.2.6.1. Overview
- 16.2.6.2. Products
- 16.2.6.3. SWOT Analysis
- 16.2.6.4. Recent Developments
- 16.2.6.5. Financials (Based on Availability)
- 16.2.7 Charter Communications Inc
- 16.2.7.1. Overview
- 16.2.7.2. Products
- 16.2.7.3. SWOT Analysis
- 16.2.7.4. Recent Developments
- 16.2.7.5. Financials (Based on Availability)
- 16.2.8 Lumen Technologies Inc
- 16.2.8.1. Overview
- 16.2.8.2. Products
- 16.2.8.3. SWOT Analysis
- 16.2.8.4. Recent Developments
- 16.2.8.5. Financials (Based on Availability)
- 16.2.9 Windstream Holdings Inc
- 16.2.9.1. Overview
- 16.2.9.2. Products
- 16.2.9.3. SWOT Analysis
- 16.2.9.4. Recent Developments
- 16.2.9.5. Financials (Based on Availability)
- 16.2.10 Cox Communications Inc
- 16.2.10.1. Overview
- 16.2.10.2. Products
- 16.2.10.3. SWOT Analysis
- 16.2.10.4. Recent Developments
- 16.2.10.5. Financials (Based on Availability)
- 16.2.11 AT&T Inc
- 16.2.11.1. Overview
- 16.2.11.2. Products
- 16.2.11.3. SWOT Analysis
- 16.2.11.4. Recent Developments
- 16.2.11.5. Financials (Based on Availability)
- 16.2.12 T-Mobile US Inc
- 16.2.12.1. Overview
- 16.2.12.2. Products
- 16.2.12.3. SWOT Analysis
- 16.2.12.4. Recent Developments
- 16.2.12.5. Financials (Based on Availability)
- 16.2.1 United States Cellular Corporation
List of Figures
- Figure 1: Global Telecom Industry in US Market Revenue Breakdown (Million, %) by Region 2024 & 2032
- Figure 2: Global Telecom Industry in US Market Volume Breakdown (K Unit, %) by Region 2024 & 2032
- Figure 3: United states Telecom Industry in US Market Revenue (Million), by Country 2024 & 2032
- Figure 4: United states Telecom Industry in US Market Volume (K Unit), by Country 2024 & 2032
- Figure 5: United states Telecom Industry in US Market Revenue Share (%), by Country 2024 & 2032
- Figure 6: United states Telecom Industry in US Market Volume Share (%), by Country 2024 & 2032
- Figure 7: North America Telecom Industry in US Market Revenue (Million), by Services 2024 & 2032
- Figure 8: North America Telecom Industry in US Market Volume (K Unit), by Services 2024 & 2032
- Figure 9: North America Telecom Industry in US Market Revenue Share (%), by Services 2024 & 2032
- Figure 10: North America Telecom Industry in US Market Volume Share (%), by Services 2024 & 2032
- Figure 11: North America Telecom Industry in US Market Revenue (Million), by Country 2024 & 2032
- Figure 12: North America Telecom Industry in US Market Volume (K Unit), by Country 2024 & 2032
- Figure 13: North America Telecom Industry in US Market Revenue Share (%), by Country 2024 & 2032
- Figure 14: North America Telecom Industry in US Market Volume Share (%), by Country 2024 & 2032
- Figure 15: South America Telecom Industry in US Market Revenue (Million), by Services 2024 & 2032
- Figure 16: South America Telecom Industry in US Market Volume (K Unit), by Services 2024 & 2032
- Figure 17: South America Telecom Industry in US Market Revenue Share (%), by Services 2024 & 2032
- Figure 18: South America Telecom Industry in US Market Volume Share (%), by Services 2024 & 2032
- Figure 19: South America Telecom Industry in US Market Revenue (Million), by Country 2024 & 2032
- Figure 20: South America Telecom Industry in US Market Volume (K Unit), by Country 2024 & 2032
- Figure 21: South America Telecom Industry in US Market Revenue Share (%), by Country 2024 & 2032
- Figure 22: South America Telecom Industry in US Market Volume Share (%), by Country 2024 & 2032
- Figure 23: Europe Telecom Industry in US Market Revenue (Million), by Services 2024 & 2032
- Figure 24: Europe Telecom Industry in US Market Volume (K Unit), by Services 2024 & 2032
- Figure 25: Europe Telecom Industry in US Market Revenue Share (%), by Services 2024 & 2032
- Figure 26: Europe Telecom Industry in US Market Volume Share (%), by Services 2024 & 2032
- Figure 27: Europe Telecom Industry in US Market Revenue (Million), by Country 2024 & 2032
- Figure 28: Europe Telecom Industry in US Market Volume (K Unit), by Country 2024 & 2032
- Figure 29: Europe Telecom Industry in US Market Revenue Share (%), by Country 2024 & 2032
- Figure 30: Europe Telecom Industry in US Market Volume Share (%), by Country 2024 & 2032
- Figure 31: Middle East & Africa Telecom Industry in US Market Revenue (Million), by Services 2024 & 2032
- Figure 32: Middle East & Africa Telecom Industry in US Market Volume (K Unit), by Services 2024 & 2032
- Figure 33: Middle East & Africa Telecom Industry in US Market Revenue Share (%), by Services 2024 & 2032
- Figure 34: Middle East & Africa Telecom Industry in US Market Volume Share (%), by Services 2024 & 2032
- Figure 35: Middle East & Africa Telecom Industry in US Market Revenue (Million), by Country 2024 & 2032
- Figure 36: Middle East & Africa Telecom Industry in US Market Volume (K Unit), by Country 2024 & 2032
- Figure 37: Middle East & Africa Telecom Industry in US Market Revenue Share (%), by Country 2024 & 2032
- Figure 38: Middle East & Africa Telecom Industry in US Market Volume Share (%), by Country 2024 & 2032
- Figure 39: Asia Pacific Telecom Industry in US Market Revenue (Million), by Services 2024 & 2032
- Figure 40: Asia Pacific Telecom Industry in US Market Volume (K Unit), by Services 2024 & 2032
- Figure 41: Asia Pacific Telecom Industry in US Market Revenue Share (%), by Services 2024 & 2032
- Figure 42: Asia Pacific Telecom Industry in US Market Volume Share (%), by Services 2024 & 2032
- Figure 43: Asia Pacific Telecom Industry in US Market Revenue (Million), by Country 2024 & 2032
- Figure 44: Asia Pacific Telecom Industry in US Market Volume (K Unit), by Country 2024 & 2032
- Figure 45: Asia Pacific Telecom Industry in US Market Revenue Share (%), by Country 2024 & 2032
- Figure 46: Asia Pacific Telecom Industry in US Market Volume Share (%), by Country 2024 & 2032
List of Tables
- Table 1: Global Telecom Industry in US Market Revenue Million Forecast, by Region 2019 & 2032
- Table 2: Global Telecom Industry in US Market Volume K Unit Forecast, by Region 2019 & 2032
- Table 3: Global Telecom Industry in US Market Revenue Million Forecast, by Services 2019 & 2032
- Table 4: Global Telecom Industry in US Market Volume K Unit Forecast, by Services 2019 & 2032
- Table 5: Global Telecom Industry in US Market Revenue Million Forecast, by Region 2019 & 2032
- Table 6: Global Telecom Industry in US Market Volume K Unit Forecast, by Region 2019 & 2032
- Table 7: Global Telecom Industry in US Market Revenue Million Forecast, by Country 2019 & 2032
- Table 8: Global Telecom Industry in US Market Volume K Unit Forecast, by Country 2019 & 2032
- Table 9: Northeast Telecom Industry in US Market Revenue (Million) Forecast, by Application 2019 & 2032
- Table 10: Northeast Telecom Industry in US Market Volume (K Unit) Forecast, by Application 2019 & 2032
- Table 11: Southeast Telecom Industry in US Market Revenue (Million) Forecast, by Application 2019 & 2032
- Table 12: Southeast Telecom Industry in US Market Volume (K Unit) Forecast, by Application 2019 & 2032
- Table 13: Midwest Telecom Industry in US Market Revenue (Million) Forecast, by Application 2019 & 2032
- Table 14: Midwest Telecom Industry in US Market Volume (K Unit) Forecast, by Application 2019 & 2032
- Table 15: Southwest Telecom Industry in US Market Revenue (Million) Forecast, by Application 2019 & 2032
- Table 16: Southwest Telecom Industry in US Market Volume (K Unit) Forecast, by Application 2019 & 2032
- Table 17: West Telecom Industry in US Market Revenue (Million) Forecast, by Application 2019 & 2032
- Table 18: West Telecom Industry in US Market Volume (K Unit) Forecast, by Application 2019 & 2032
- Table 19: Global Telecom Industry in US Market Revenue Million Forecast, by Services 2019 & 2032
- Table 20: Global Telecom Industry in US Market Volume K Unit Forecast, by Services 2019 & 2032
- Table 21: Global Telecom Industry in US Market Revenue Million Forecast, by Country 2019 & 2032
- Table 22: Global Telecom Industry in US Market Volume K Unit Forecast, by Country 2019 & 2032
- Table 23: United States Telecom Industry in US Market Revenue (Million) Forecast, by Application 2019 & 2032
- Table 24: United States Telecom Industry in US Market Volume (K Unit) Forecast, by Application 2019 & 2032
- Table 25: Canada Telecom Industry in US Market Revenue (Million) Forecast, by Application 2019 & 2032
- Table 26: Canada Telecom Industry in US Market Volume (K Unit) Forecast, by Application 2019 & 2032
- Table 27: Mexico Telecom Industry in US Market Revenue (Million) Forecast, by Application 2019 & 2032
- Table 28: Mexico Telecom Industry in US Market Volume (K Unit) Forecast, by Application 2019 & 2032
- Table 29: Global Telecom Industry in US Market Revenue Million Forecast, by Services 2019 & 2032
- Table 30: Global Telecom Industry in US Market Volume K Unit Forecast, by Services 2019 & 2032
- Table 31: Global Telecom Industry in US Market Revenue Million Forecast, by Country 2019 & 2032
- Table 32: Global Telecom Industry in US Market Volume K Unit Forecast, by Country 2019 & 2032
- Table 33: Brazil Telecom Industry in US Market Revenue (Million) Forecast, by Application 2019 & 2032
- Table 34: Brazil Telecom Industry in US Market Volume (K Unit) Forecast, by Application 2019 & 2032
- Table 35: Argentina Telecom Industry in US Market Revenue (Million) Forecast, by Application 2019 & 2032
- Table 36: Argentina Telecom Industry in US Market Volume (K Unit) Forecast, by Application 2019 & 2032
- Table 37: Rest of South America Telecom Industry in US Market Revenue (Million) Forecast, by Application 2019 & 2032
- Table 38: Rest of South America Telecom Industry in US Market Volume (K Unit) Forecast, by Application 2019 & 2032
- Table 39: Global Telecom Industry in US Market Revenue Million Forecast, by Services 2019 & 2032
- Table 40: Global Telecom Industry in US Market Volume K Unit Forecast, by Services 2019 & 2032
- Table 41: Global Telecom Industry in US Market Revenue Million Forecast, by Country 2019 & 2032
- Table 42: Global Telecom Industry in US Market Volume K Unit Forecast, by Country 2019 & 2032
- Table 43: United Kingdom Telecom Industry in US Market Revenue (Million) Forecast, by Application 2019 & 2032
- Table 44: United Kingdom Telecom Industry in US Market Volume (K Unit) Forecast, by Application 2019 & 2032
- Table 45: Germany Telecom Industry in US Market Revenue (Million) Forecast, by Application 2019 & 2032
- Table 46: Germany Telecom Industry in US Market Volume (K Unit) Forecast, by Application 2019 & 2032
- Table 47: France Telecom Industry in US Market Revenue (Million) Forecast, by Application 2019 & 2032
- Table 48: France Telecom Industry in US Market Volume (K Unit) Forecast, by Application 2019 & 2032
- Table 49: Italy Telecom Industry in US Market Revenue (Million) Forecast, by Application 2019 & 2032
- Table 50: Italy Telecom Industry in US Market Volume (K Unit) Forecast, by Application 2019 & 2032
- Table 51: Spain Telecom Industry in US Market Revenue (Million) Forecast, by Application 2019 & 2032
- Table 52: Spain Telecom Industry in US Market Volume (K Unit) Forecast, by Application 2019 & 2032
- Table 53: Russia Telecom Industry in US Market Revenue (Million) Forecast, by Application 2019 & 2032
- Table 54: Russia Telecom Industry in US Market Volume (K Unit) Forecast, by Application 2019 & 2032
- Table 55: Benelux Telecom Industry in US Market Revenue (Million) Forecast, by Application 2019 & 2032
- Table 56: Benelux Telecom Industry in US Market Volume (K Unit) Forecast, by Application 2019 & 2032
- Table 57: Nordics Telecom Industry in US Market Revenue (Million) Forecast, by Application 2019 & 2032
- Table 58: Nordics Telecom Industry in US Market Volume (K Unit) Forecast, by Application 2019 & 2032
- Table 59: Rest of Europe Telecom Industry in US Market Revenue (Million) Forecast, by Application 2019 & 2032
- Table 60: Rest of Europe Telecom Industry in US Market Volume (K Unit) Forecast, by Application 2019 & 2032
- Table 61: Global Telecom Industry in US Market Revenue Million Forecast, by Services 2019 & 2032
- Table 62: Global Telecom Industry in US Market Volume K Unit Forecast, by Services 2019 & 2032
- Table 63: Global Telecom Industry in US Market Revenue Million Forecast, by Country 2019 & 2032
- Table 64: Global Telecom Industry in US Market Volume K Unit Forecast, by Country 2019 & 2032
- Table 65: Turkey Telecom Industry in US Market Revenue (Million) Forecast, by Application 2019 & 2032
- Table 66: Turkey Telecom Industry in US Market Volume (K Unit) Forecast, by Application 2019 & 2032
- Table 67: Israel Telecom Industry in US Market Revenue (Million) Forecast, by Application 2019 & 2032
- Table 68: Israel Telecom Industry in US Market Volume (K Unit) Forecast, by Application 2019 & 2032
- Table 69: GCC Telecom Industry in US Market Revenue (Million) Forecast, by Application 2019 & 2032
- Table 70: GCC Telecom Industry in US Market Volume (K Unit) Forecast, by Application 2019 & 2032
- Table 71: North Africa Telecom Industry in US Market Revenue (Million) Forecast, by Application 2019 & 2032
- Table 72: North Africa Telecom Industry in US Market Volume (K Unit) Forecast, by Application 2019 & 2032
- Table 73: South Africa Telecom Industry in US Market Revenue (Million) Forecast, by Application 2019 & 2032
- Table 74: South Africa Telecom Industry in US Market Volume (K Unit) Forecast, by Application 2019 & 2032
- Table 75: Rest of Middle East & Africa Telecom Industry in US Market Revenue (Million) Forecast, by Application 2019 & 2032
- Table 76: Rest of Middle East & Africa Telecom Industry in US Market Volume (K Unit) Forecast, by Application 2019 & 2032
- Table 77: Global Telecom Industry in US Market Revenue Million Forecast, by Services 2019 & 2032
- Table 78: Global Telecom Industry in US Market Volume K Unit Forecast, by Services 2019 & 2032
- Table 79: Global Telecom Industry in US Market Revenue Million Forecast, by Country 2019 & 2032
- Table 80: Global Telecom Industry in US Market Volume K Unit Forecast, by Country 2019 & 2032
- Table 81: China Telecom Industry in US Market Revenue (Million) Forecast, by Application 2019 & 2032
- Table 82: China Telecom Industry in US Market Volume (K Unit) Forecast, by Application 2019 & 2032
- Table 83: India Telecom Industry in US Market Revenue (Million) Forecast, by Application 2019 & 2032
- Table 84: India Telecom Industry in US Market Volume (K Unit) Forecast, by Application 2019 & 2032
- Table 85: Japan Telecom Industry in US Market Revenue (Million) Forecast, by Application 2019 & 2032
- Table 86: Japan Telecom Industry in US Market Volume (K Unit) Forecast, by Application 2019 & 2032
- Table 87: South Korea Telecom Industry in US Market Revenue (Million) Forecast, by Application 2019 & 2032
- Table 88: South Korea Telecom Industry in US Market Volume (K Unit) Forecast, by Application 2019 & 2032
- Table 89: ASEAN Telecom Industry in US Market Revenue (Million) Forecast, by Application 2019 & 2032
- Table 90: ASEAN Telecom Industry in US Market Volume (K Unit) Forecast, by Application 2019 & 2032
- Table 91: Oceania Telecom Industry in US Market Revenue (Million) Forecast, by Application 2019 & 2032
- Table 92: Oceania Telecom Industry in US Market Volume (K Unit) Forecast, by Application 2019 & 2032
- Table 93: Rest of Asia Pacific Telecom Industry in US Market Revenue (Million) Forecast, by Application 2019 & 2032
- Table 94: Rest of Asia Pacific Telecom Industry in US Market Volume (K Unit) Forecast, by Application 2019 & 2032
Frequently Asked Questions
1. What is the projected Compound Annual Growth Rate (CAGR) of the Telecom Industry in US Market?
The projected CAGR is approximately 3.67%.
2. Which companies are prominent players in the Telecom Industry in US Market?
Key companies in the market include United States Cellular Corporation, Comcast Corporation, Frontier Communications Parent Inc, Verizon Communications Inc, Altice USA Inc, DISH Network Corporation, Charter Communications Inc, Lumen Technologies Inc, Windstream Holdings Inc, Cox Communications Inc, AT&T Inc, T-Mobile US Inc.
3. What are the main segments of the Telecom Industry in US Market?
The market segments include Services.
4. Can you provide details about the market size?
The market size is estimated to be USD 443.12 Million as of 2022.
5. What are some drivers contributing to market growth?
Growth of Mobile Internet Connection; Deployment of 5G network in the United States.
6. What are the notable trends driving market growth?
Deployment of 5G Networks in the United States.
7. Are there any restraints impacting market growth?
; Lack of Control over Operations and Cost Visibility.
8. Can you provide examples of recent developments in the market?
September 2022: AT&T unveiled its collaboration with Ford, thereby promising to deliver 5G Connectivity to the heavy-duty 2023 models of Ford. This ensures faster navigation, mapping, and audio downloads with AT&T 5G and enables Ford Power-Up software upgrades to be downloaded easily. This development will help the vehicle get better over time.
9. What pricing options are available for accessing the report?
Pricing options include single-user, multi-user, and enterprise licenses priced at USD 3800, USD 4500, and USD 5800 respectively.
10. Is the market size provided in terms of value or volume?
The market size is provided in terms of value, measured in Million and volume, measured in K Unit.
11. Are there any specific market keywords associated with the report?
Yes, the market keyword associated with the report is "Telecom Industry in US Market," which aids in identifying and referencing the specific market segment covered.
12. How do I determine which pricing option suits my needs best?
The pricing options vary based on user requirements and access needs. Individual users may opt for single-user licenses, while businesses requiring broader access may choose multi-user or enterprise licenses for cost-effective access to the report.
13. Are there any additional resources or data provided in the Telecom Industry in US Market report?
While the report offers comprehensive insights, it's advisable to review the specific contents or supplementary materials provided to ascertain if additional resources or data are available.
14. How can I stay updated on further developments or reports in the Telecom Industry in US Market?
To stay informed about further developments, trends, and reports in the Telecom Industry in US Market, consider subscribing to industry newsletters, following relevant companies and organizations, or regularly checking reputable industry news sources and publications.
Methodology
Step 1 - Identification of Relevant Samples Size from Population Database


Step 2 - Approaches for Defining Global Market Size (Value, Volume* & Price*)

Note*: In applicable scenarios
Step 3 - Data Sources
Primary Research
- Web Analytics
- Survey Reports
- Research Institute
- Latest Research Reports
- Opinion Leaders
Secondary Research
- Annual Reports
- White Paper
- Latest Press Release
- Industry Association
- Paid Database
- Investor Presentations

Step 4 - Data Triangulation
Involves using different sources of information in order to increase the validity of a study
These sources are likely to be stakeholders in a program - participants, other researchers, program staff, other community members, and so on.
Then we put all data in single framework & apply various statistical tools to find out the dynamic on the market.
During the analysis stage, feedback from the stakeholder groups would be compared to determine areas of agreement as well as areas of divergence


