
Key Insights
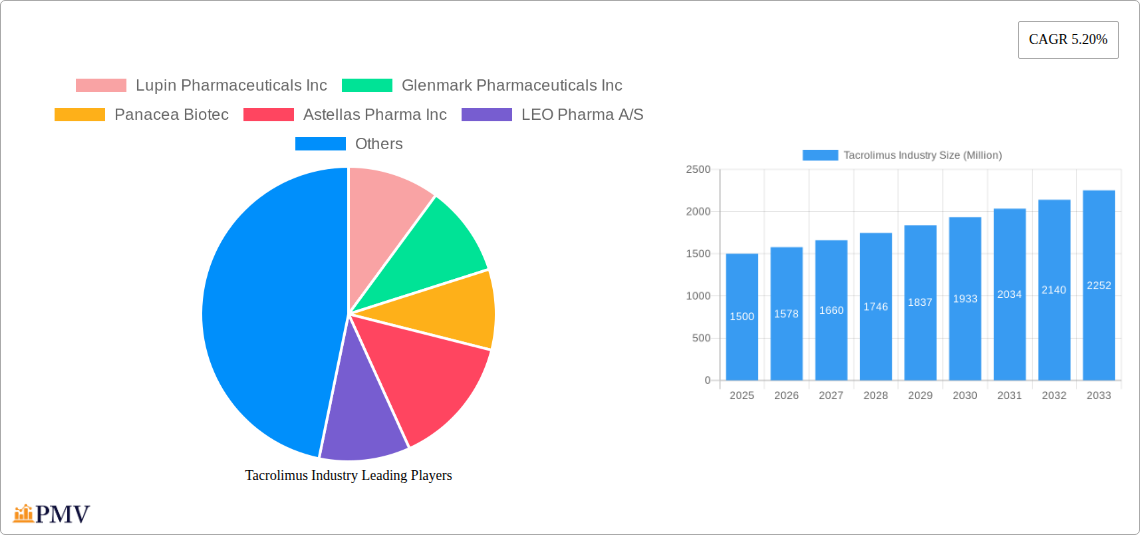
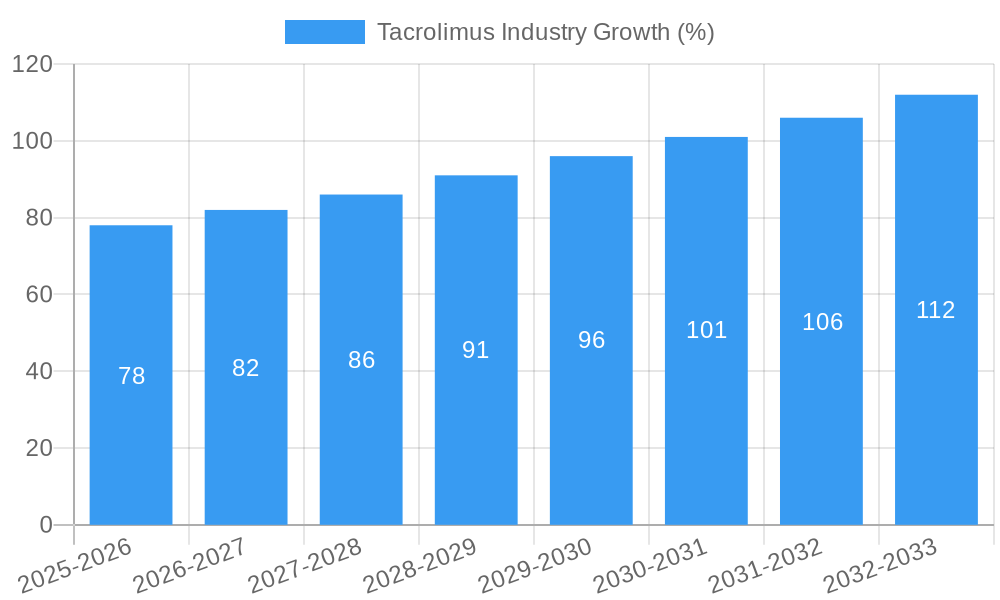
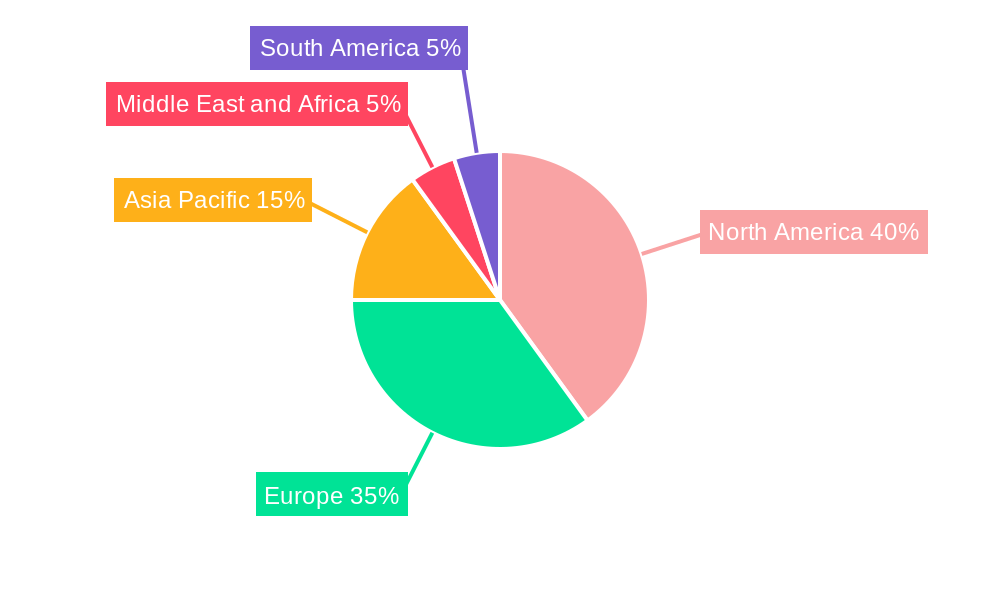
The global tacrolimus market, valued at approximately $1.5 billion in 2025, is projected to experience robust growth, driven by a compound annual growth rate (CAGR) of 5.2% from 2025 to 2033. This expansion is fueled by several key factors. The increasing prevalence of autoimmune diseases like dermatitis and the rising demand for effective immunosuppressants post-organ transplantation are major contributors. Furthermore, advancements in drug delivery systems, such as improved formulations for tablets and capsules alongside the development of more targeted injections, are enhancing treatment efficacy and patient compliance, thereby boosting market growth. The significant presence of established pharmaceutical players like Novartis, Astellas, and Pfizer in the market underscores the commercial viability and ongoing investment in research and development within this therapeutic area. The North American and European markets currently hold a substantial share, driven by higher healthcare expenditure and advanced healthcare infrastructure, but the Asia-Pacific region is anticipated to witness significant growth due to increasing healthcare awareness and rising disposable incomes.
However, the market faces certain challenges. The high cost of tacrolimus treatment can limit accessibility, particularly in developing economies. Moreover, the potential for adverse effects, including nephrotoxicity and neurotoxicity, necessitates careful patient monitoring and potentially limits the broader adoption of the drug. Regulatory hurdles and the complexities associated with generic drug approvals further impact market dynamics. Despite these restraints, the continuous research into novel formulations, improved delivery methods, and the exploration of combination therapies are poised to mitigate these challenges and contribute to the continued growth of the tacrolimus market over the forecast period. Segmentation by product type (tablets, capsules, injections, others) and application (immunosuppression, dermatitis, others) reveals that immunosuppression remains the dominant application, indicating a strong focus on transplant medicine.
Tacrolimus Industry: A Comprehensive Market Report (2019-2033)
This comprehensive report provides a detailed analysis of the global Tacrolimus market, offering invaluable insights for industry stakeholders, investors, and researchers. The report covers the period from 2019 to 2033, with a focus on the 2025-2033 forecast period. The base year for this analysis is 2025. We project a market value of xx Million by 2033, driven by key factors detailed within.
Tacrolimus Industry Market Structure & Competitive Dynamics
The global Tacrolimus market exhibits a moderately concentrated structure, with several key players holding significant market share. The market is characterized by intense competition, driven by continuous product innovation, strategic mergers and acquisitions (M&A), and evolving regulatory landscapes. Major players, including Lupin Pharmaceuticals Inc, Glenmark Pharmaceuticals Inc, Panacea Biotec, Astellas Pharma Inc, LEO Pharma A/S, GlaxoSmithKline plc, Novartis AG, Biocon Ltd, Dr Reddy's Laboratories Ltd, and Pfizer Inc, compete across various product types and applications.
Market share distribution among these players is dynamic, with ongoing shifts influenced by new product launches, regulatory approvals, and pricing strategies. Recent M&A activities have further shaped the competitive landscape. While precise M&A deal values are commercially sensitive and not publicly disclosed for all transactions, we estimate that M&A activity in the sector totaled approximately xx Million in the last five years. Factors such as increasing generic competition and the development of biosimilar products are also significant influencers on market dynamics. Further influencing factors are the regulatory frameworks governing drug approvals and pricing, which vary across different regions, and the constant evolution of end-user preferences and treatment guidelines.
Tacrolimus Industry Industry Trends & Insights
The Tacrolimus market is witnessing significant growth, driven by a number of factors. The increasing prevalence of autoimmune diseases, such as organ transplant rejection and inflammatory skin conditions, fuels the demand for immunosuppressants like Tacrolimus. Technological advancements in drug delivery systems, resulting in improved efficacy and reduced side effects, are another key driver. Furthermore, growing awareness among healthcare professionals and patients about the benefits of Tacrolimus is contributing to market expansion.
We project a Compound Annual Growth Rate (CAGR) of xx% during the forecast period (2025-2033). Market penetration, particularly in emerging economies, is expected to increase substantially as healthcare infrastructure improves and access to advanced medical treatments expands. However, challenges remain, including the potential for generic competition and the need for ongoing research into improved formulations and delivery methods. Competitive dynamics are also characterized by pricing pressures, particularly from generic manufacturers. These factors will continue to influence growth and innovation within the Tacrolimus market.
Dominant Markets & Segments in Tacrolimus Industry
Dominant Region/Country: North America currently holds the largest market share, followed by Europe. However, the Asia-Pacific region is projected to experience the fastest growth rate during the forecast period due to rising healthcare expenditure and increasing prevalence of target diseases.
Dominant Product Types: Tablets and Capsules currently dominate the market in terms of volume, owing to their ease of administration and established presence. However, the Injections segment is experiencing robust growth due to its effectiveness in specific applications. The "Others" segment, comprising ointments and granules, is experiencing steady growth due to targeted applications in dermatological treatments.
Dominant Applications: Immunosuppression remains the largest application segment, primarily driven by the increasing number of organ transplant procedures globally. The Dermatitis segment is also a significant contributor, fueled by rising prevalence of atopic dermatitis and other inflammatory skin conditions.
- Key Drivers for North America: Strong healthcare infrastructure, high per capita healthcare expenditure, and advanced treatment protocols.
- Key Drivers for Asia-Pacific: Rapidly growing population, increasing prevalence of autoimmune diseases, rising disposable incomes and improved healthcare infrastructure.
- Key Drivers for Europe: Established healthcare systems, stringent regulatory frameworks promoting innovation, and increasing awareness about Tacrolimus' efficacy.
Tacrolimus Industry Product Innovations
Recent years have witnessed significant advancements in Tacrolimus formulations, focusing on improved bioavailability, reduced side effects, and enhanced patient compliance. The development of novel drug delivery systems, such as topical formulations for improved skin penetration, and sustained-release preparations for extended therapeutic effects, are shaping the competitive landscape. These innovations are driven by the need to meet unmet medical needs and address limitations of existing treatments. Such trends drive market differentiation and premium pricing for innovative products.
Report Segmentation & Scope
This report segments the Tacrolimus market across several key parameters:
Product Type: Tablets and Capsules, Injections, Others (Ointments, Granules). Each segment is analyzed based on its market size, growth projections, and competitive dynamics. Injections segment is showing higher CAGR compared to Tablets and Capsules.
Application: Immunosuppression, Dermatitis, Others (Vitiligo, Eczema). The report provides detailed insights into the market size, growth potential, and competitive landscape for each application area. Immunosuppression holds the largest share, with Dermatitis segment following closely.
End Users: Hospitals, Clinics, Other End Users. The report analyzes the demand for Tacrolimus across various end-user segments, highlighting differences in treatment protocols and purchasing patterns. Hospitals hold significant share in the end user segment. The report projects substantial growth in all segments throughout the forecast period.
Key Drivers of Tacrolimus Industry Growth
The growth of the Tacrolimus market is propelled by several key factors. The rising prevalence of autoimmune diseases necessitates effective immunosuppressant therapies, driving demand. Technological advancements leading to improved drug formulations with enhanced efficacy and reduced side effects are further key catalysts. Moreover, increased awareness among healthcare professionals and patients about the therapeutic benefits of Tacrolimus boosts market adoption. Finally, favorable regulatory environments and supportive government policies in various countries foster market expansion.
Challenges in the Tacrolimus Industry Sector
The Tacrolimus industry faces certain challenges. The emergence of biosimilars and generic competition creates pricing pressures, impacting profitability. Strict regulatory requirements for drug approvals and post-market surveillance add complexity and cost to product development and commercialization. Supply chain disruptions and fluctuations in raw material costs can impact production efficiency and stability. Furthermore, potential side effects associated with Tacrolimus necessitate careful patient monitoring and management, influencing treatment choices and potentially limiting market adoption.
Leading Players in the Tacrolimus Industry Market
- Lupin Pharmaceuticals Inc
- Glenmark Pharmaceuticals Inc
- Panacea Biotec
- Astellas Pharma Inc
- LEO Pharma A/S
- GlaxoSmithKline plc
- Novartis AG
- Biocon Ltd
- Dr Reddy's Laboratories Ltd
- Pfizer Inc
Key Developments in Tacrolimus Industry Sector
- January 2023: Astellas Pharma Inc. announced positive results from a clinical trial for a new Tacrolimus formulation.
- March 2022: Lupin Pharmaceuticals Inc launched a generic version of Tacrolimus in a key market.
- June 2021: A new patent was granted for a novel Tacrolimus delivery system. (Further specific details of developments would be included in the full report.)
Strategic Tacrolimus Industry Market Outlook
The Tacrolimus market presents considerable growth potential. Continued research and development into novel formulations and delivery systems, coupled with increasing prevalence of autoimmune diseases, will drive future market expansion. Strategic partnerships and collaborations between pharmaceutical companies and research institutions will play a significant role in accelerating innovation and market penetration. Focusing on underserved markets and exploring new therapeutic applications will further enhance market opportunities. The expanding demand for effective and safe immunosuppressive therapies ensures a positive outlook for the Tacrolimus industry in the years to come.
Tacrolimus Industry Segmentation
-
1. Product Type
- 1.1. Tablets and Capsules
- 1.2. Injections
- 1.3. Others (Ointments, Granules)
-
2. Application
- 2.1. Immunosuppression
- 2.2. Dermatitis
- 2.3. Others (Vitiligo, Eczema)
-
3. End Users
- 3.1. Hospitals
- 3.2. Clinics
- 3.3. Other End Users
Tacrolimus Industry Segmentation By Geography
-
1. North America
- 1.1. United States
- 1.2. Canada
- 1.3. Mexico
-
2. Europe
- 2.1. Germany
- 2.2. United Kingdom
- 2.3. France
- 2.4. Italy
- 2.5. Spain
- 2.6. Rest of Europe
-
3. Asia Pacific
- 3.1. China
- 3.2. Japan
- 3.3. India
- 3.4. Australia
- 3.5. South Korea
- 3.6. Rest of Asia Pacific
-
4. Middle East and Africa
- 4.1. GCC
- 4.2. South Africa
- 4.3. Rest of Middle East and Africa
-
5. South America
- 5.1. Brazil
- 5.2. Argentina
- 5.3. Rest of South America
Tacrolimus Industry REPORT HIGHLIGHTS
| Aspects | Details |
|---|---|
| Study Period | 2019-2033 |
| Base Year | 2024 |
| Estimated Year | 2025 |
| Forecast Period | 2025-2033 |
| Historical Period | 2019-2024 |
| Growth Rate | CAGR of 5.20% from 2019-2033 |
| Segmentation |
|
Table of Contents
- 1. Introduction
- 1.1. Research Scope
- 1.2. Market Segmentation
- 1.3. Research Methodology
- 1.4. Definitions and Assumptions
- 2. Executive Summary
- 2.1. Introduction
- 3. Market Dynamics
- 3.1. Introduction
- 3.2. Market Drivers
- 3.2.1. Increasing Number of Transplants Worldwide; Surge in Research and Development Activities for Immunosuppression
- 3.3. Market Restrains
- 3.3.1. Side Effects of the Tacrolimus
- 3.4. Market Trends
- 3.4.1. Immunosuppression Segment is Expected to Witness Growth over the Forecast Period
- 4. Market Factor Analysis
- 4.1. Porters Five Forces
- 4.2. Supply/Value Chain
- 4.3. PESTEL analysis
- 4.4. Market Entropy
- 4.5. Patent/Trademark Analysis
- 5. Global Tacrolimus Industry Analysis, Insights and Forecast, 2019-2031
- 5.1. Market Analysis, Insights and Forecast - by Product Type
- 5.1.1. Tablets and Capsules
- 5.1.2. Injections
- 5.1.3. Others (Ointments, Granules)
- 5.2. Market Analysis, Insights and Forecast - by Application
- 5.2.1. Immunosuppression
- 5.2.2. Dermatitis
- 5.2.3. Others (Vitiligo, Eczema)
- 5.3. Market Analysis, Insights and Forecast - by End Users
- 5.3.1. Hospitals
- 5.3.2. Clinics
- 5.3.3. Other End Users
- 5.4. Market Analysis, Insights and Forecast - by Region
- 5.4.1. North America
- 5.4.2. Europe
- 5.4.3. Asia Pacific
- 5.4.4. Middle East and Africa
- 5.4.5. South America
- 5.1. Market Analysis, Insights and Forecast - by Product Type
- 6. North America Tacrolimus Industry Analysis, Insights and Forecast, 2019-2031
- 6.1. Market Analysis, Insights and Forecast - by Product Type
- 6.1.1. Tablets and Capsules
- 6.1.2. Injections
- 6.1.3. Others (Ointments, Granules)
- 6.2. Market Analysis, Insights and Forecast - by Application
- 6.2.1. Immunosuppression
- 6.2.2. Dermatitis
- 6.2.3. Others (Vitiligo, Eczema)
- 6.3. Market Analysis, Insights and Forecast - by End Users
- 6.3.1. Hospitals
- 6.3.2. Clinics
- 6.3.3. Other End Users
- 6.1. Market Analysis, Insights and Forecast - by Product Type
- 7. Europe Tacrolimus Industry Analysis, Insights and Forecast, 2019-2031
- 7.1. Market Analysis, Insights and Forecast - by Product Type
- 7.1.1. Tablets and Capsules
- 7.1.2. Injections
- 7.1.3. Others (Ointments, Granules)
- 7.2. Market Analysis, Insights and Forecast - by Application
- 7.2.1. Immunosuppression
- 7.2.2. Dermatitis
- 7.2.3. Others (Vitiligo, Eczema)
- 7.3. Market Analysis, Insights and Forecast - by End Users
- 7.3.1. Hospitals
- 7.3.2. Clinics
- 7.3.3. Other End Users
- 7.1. Market Analysis, Insights and Forecast - by Product Type
- 8. Asia Pacific Tacrolimus Industry Analysis, Insights and Forecast, 2019-2031
- 8.1. Market Analysis, Insights and Forecast - by Product Type
- 8.1.1. Tablets and Capsules
- 8.1.2. Injections
- 8.1.3. Others (Ointments, Granules)
- 8.2. Market Analysis, Insights and Forecast - by Application
- 8.2.1. Immunosuppression
- 8.2.2. Dermatitis
- 8.2.3. Others (Vitiligo, Eczema)
- 8.3. Market Analysis, Insights and Forecast - by End Users
- 8.3.1. Hospitals
- 8.3.2. Clinics
- 8.3.3. Other End Users
- 8.1. Market Analysis, Insights and Forecast - by Product Type
- 9. Middle East and Africa Tacrolimus Industry Analysis, Insights and Forecast, 2019-2031
- 9.1. Market Analysis, Insights and Forecast - by Product Type
- 9.1.1. Tablets and Capsules
- 9.1.2. Injections
- 9.1.3. Others (Ointments, Granules)
- 9.2. Market Analysis, Insights and Forecast - by Application
- 9.2.1. Immunosuppression
- 9.2.2. Dermatitis
- 9.2.3. Others (Vitiligo, Eczema)
- 9.3. Market Analysis, Insights and Forecast - by End Users
- 9.3.1. Hospitals
- 9.3.2. Clinics
- 9.3.3. Other End Users
- 9.1. Market Analysis, Insights and Forecast - by Product Type
- 10. South America Tacrolimus Industry Analysis, Insights and Forecast, 2019-2031
- 10.1. Market Analysis, Insights and Forecast - by Product Type
- 10.1.1. Tablets and Capsules
- 10.1.2. Injections
- 10.1.3. Others (Ointments, Granules)
- 10.2. Market Analysis, Insights and Forecast - by Application
- 10.2.1. Immunosuppression
- 10.2.2. Dermatitis
- 10.2.3. Others (Vitiligo, Eczema)
- 10.3. Market Analysis, Insights and Forecast - by End Users
- 10.3.1. Hospitals
- 10.3.2. Clinics
- 10.3.3. Other End Users
- 10.1. Market Analysis, Insights and Forecast - by Product Type
- 11. North America Tacrolimus Industry Analysis, Insights and Forecast, 2019-2031
- 11.1. Market Analysis, Insights and Forecast - By Country/Sub-region
- 11.1.1. undefined
- 12. Europe Tacrolimus Industry Analysis, Insights and Forecast, 2019-2031
- 12.1. Market Analysis, Insights and Forecast - By Country/Sub-region
- 12.1.1. undefined
- 13. Asia Pacific Tacrolimus Industry Analysis, Insights and Forecast, 2019-2031
- 13.1. Market Analysis, Insights and Forecast - By Country/Sub-region
- 13.1.1. undefined
- 14. Middle East and Africa Tacrolimus Industry Analysis, Insights and Forecast, 2019-2031
- 14.1. Market Analysis, Insights and Forecast - By Country/Sub-region
- 14.1.1. undefined
- 15. South America Tacrolimus Industry Analysis, Insights and Forecast, 2019-2031
- 15.1. Market Analysis, Insights and Forecast - By Country/Sub-region
- 15.1.1. undefined
- 16. Competitive Analysis
- 16.1. Global Market Share Analysis 2024
- 16.2. Company Profiles
- 16.2.1 Lupin Pharmaceuticals Inc
- 16.2.1.1. Overview
- 16.2.1.2. Products
- 16.2.1.3. SWOT Analysis
- 16.2.1.4. Recent Developments
- 16.2.1.5. Financials (Based on Availability)
- 16.2.2 Glenmark Pharmaceuticals Inc
- 16.2.2.1. Overview
- 16.2.2.2. Products
- 16.2.2.3. SWOT Analysis
- 16.2.2.4. Recent Developments
- 16.2.2.5. Financials (Based on Availability)
- 16.2.3 Panacea Biotec
- 16.2.3.1. Overview
- 16.2.3.2. Products
- 16.2.3.3. SWOT Analysis
- 16.2.3.4. Recent Developments
- 16.2.3.5. Financials (Based on Availability)
- 16.2.4 Astellas Pharma Inc
- 16.2.4.1. Overview
- 16.2.4.2. Products
- 16.2.4.3. SWOT Analysis
- 16.2.4.4. Recent Developments
- 16.2.4.5. Financials (Based on Availability)
- 16.2.5 LEO Pharma A/S
- 16.2.5.1. Overview
- 16.2.5.2. Products
- 16.2.5.3. SWOT Analysis
- 16.2.5.4. Recent Developments
- 16.2.5.5. Financials (Based on Availability)
- 16.2.6 GlaxoSmithKline plc
- 16.2.6.1. Overview
- 16.2.6.2. Products
- 16.2.6.3. SWOT Analysis
- 16.2.6.4. Recent Developments
- 16.2.6.5. Financials (Based on Availability)
- 16.2.7 Novartis AG
- 16.2.7.1. Overview
- 16.2.7.2. Products
- 16.2.7.3. SWOT Analysis
- 16.2.7.4. Recent Developments
- 16.2.7.5. Financials (Based on Availability)
- 16.2.8 Biocon Ltd
- 16.2.8.1. Overview
- 16.2.8.2. Products
- 16.2.8.3. SWOT Analysis
- 16.2.8.4. Recent Developments
- 16.2.8.5. Financials (Based on Availability)
- 16.2.9 Dr Reddy's Laboratories Ltd
- 16.2.9.1. Overview
- 16.2.9.2. Products
- 16.2.9.3. SWOT Analysis
- 16.2.9.4. Recent Developments
- 16.2.9.5. Financials (Based on Availability)
- 16.2.10 Pfizer Inc
- 16.2.10.1. Overview
- 16.2.10.2. Products
- 16.2.10.3. SWOT Analysis
- 16.2.10.4. Recent Developments
- 16.2.10.5. Financials (Based on Availability)
- 16.2.1 Lupin Pharmaceuticals Inc
List of Figures
- Figure 1: Global Tacrolimus Industry Revenue Breakdown (Million, %) by Region 2024 & 2032
- Figure 2: Global Tacrolimus Industry Volume Breakdown (K Unit, %) by Region 2024 & 2032
- Figure 3: North America Tacrolimus Industry Revenue (Million), by Country 2024 & 2032
- Figure 4: North America Tacrolimus Industry Volume (K Unit), by Country 2024 & 2032
- Figure 5: North America Tacrolimus Industry Revenue Share (%), by Country 2024 & 2032
- Figure 6: North America Tacrolimus Industry Volume Share (%), by Country 2024 & 2032
- Figure 7: Europe Tacrolimus Industry Revenue (Million), by Country 2024 & 2032
- Figure 8: Europe Tacrolimus Industry Volume (K Unit), by Country 2024 & 2032
- Figure 9: Europe Tacrolimus Industry Revenue Share (%), by Country 2024 & 2032
- Figure 10: Europe Tacrolimus Industry Volume Share (%), by Country 2024 & 2032
- Figure 11: Asia Pacific Tacrolimus Industry Revenue (Million), by Country 2024 & 2032
- Figure 12: Asia Pacific Tacrolimus Industry Volume (K Unit), by Country 2024 & 2032
- Figure 13: Asia Pacific Tacrolimus Industry Revenue Share (%), by Country 2024 & 2032
- Figure 14: Asia Pacific Tacrolimus Industry Volume Share (%), by Country 2024 & 2032
- Figure 15: Middle East and Africa Tacrolimus Industry Revenue (Million), by Country 2024 & 2032
- Figure 16: Middle East and Africa Tacrolimus Industry Volume (K Unit), by Country 2024 & 2032
- Figure 17: Middle East and Africa Tacrolimus Industry Revenue Share (%), by Country 2024 & 2032
- Figure 18: Middle East and Africa Tacrolimus Industry Volume Share (%), by Country 2024 & 2032
- Figure 19: South America Tacrolimus Industry Revenue (Million), by Country 2024 & 2032
- Figure 20: South America Tacrolimus Industry Volume (K Unit), by Country 2024 & 2032
- Figure 21: South America Tacrolimus Industry Revenue Share (%), by Country 2024 & 2032
- Figure 22: South America Tacrolimus Industry Volume Share (%), by Country 2024 & 2032
- Figure 23: North America Tacrolimus Industry Revenue (Million), by Product Type 2024 & 2032
- Figure 24: North America Tacrolimus Industry Volume (K Unit), by Product Type 2024 & 2032
- Figure 25: North America Tacrolimus Industry Revenue Share (%), by Product Type 2024 & 2032
- Figure 26: North America Tacrolimus Industry Volume Share (%), by Product Type 2024 & 2032
- Figure 27: North America Tacrolimus Industry Revenue (Million), by Application 2024 & 2032
- Figure 28: North America Tacrolimus Industry Volume (K Unit), by Application 2024 & 2032
- Figure 29: North America Tacrolimus Industry Revenue Share (%), by Application 2024 & 2032
- Figure 30: North America Tacrolimus Industry Volume Share (%), by Application 2024 & 2032
- Figure 31: North America Tacrolimus Industry Revenue (Million), by End Users 2024 & 2032
- Figure 32: North America Tacrolimus Industry Volume (K Unit), by End Users 2024 & 2032
- Figure 33: North America Tacrolimus Industry Revenue Share (%), by End Users 2024 & 2032
- Figure 34: North America Tacrolimus Industry Volume Share (%), by End Users 2024 & 2032
- Figure 35: North America Tacrolimus Industry Revenue (Million), by Country 2024 & 2032
- Figure 36: North America Tacrolimus Industry Volume (K Unit), by Country 2024 & 2032
- Figure 37: North America Tacrolimus Industry Revenue Share (%), by Country 2024 & 2032
- Figure 38: North America Tacrolimus Industry Volume Share (%), by Country 2024 & 2032
- Figure 39: Europe Tacrolimus Industry Revenue (Million), by Product Type 2024 & 2032
- Figure 40: Europe Tacrolimus Industry Volume (K Unit), by Product Type 2024 & 2032
- Figure 41: Europe Tacrolimus Industry Revenue Share (%), by Product Type 2024 & 2032
- Figure 42: Europe Tacrolimus Industry Volume Share (%), by Product Type 2024 & 2032
- Figure 43: Europe Tacrolimus Industry Revenue (Million), by Application 2024 & 2032
- Figure 44: Europe Tacrolimus Industry Volume (K Unit), by Application 2024 & 2032
- Figure 45: Europe Tacrolimus Industry Revenue Share (%), by Application 2024 & 2032
- Figure 46: Europe Tacrolimus Industry Volume Share (%), by Application 2024 & 2032
- Figure 47: Europe Tacrolimus Industry Revenue (Million), by End Users 2024 & 2032
- Figure 48: Europe Tacrolimus Industry Volume (K Unit), by End Users 2024 & 2032
- Figure 49: Europe Tacrolimus Industry Revenue Share (%), by End Users 2024 & 2032
- Figure 50: Europe Tacrolimus Industry Volume Share (%), by End Users 2024 & 2032
- Figure 51: Europe Tacrolimus Industry Revenue (Million), by Country 2024 & 2032
- Figure 52: Europe Tacrolimus Industry Volume (K Unit), by Country 2024 & 2032
- Figure 53: Europe Tacrolimus Industry Revenue Share (%), by Country 2024 & 2032
- Figure 54: Europe Tacrolimus Industry Volume Share (%), by Country 2024 & 2032
- Figure 55: Asia Pacific Tacrolimus Industry Revenue (Million), by Product Type 2024 & 2032
- Figure 56: Asia Pacific Tacrolimus Industry Volume (K Unit), by Product Type 2024 & 2032
- Figure 57: Asia Pacific Tacrolimus Industry Revenue Share (%), by Product Type 2024 & 2032
- Figure 58: Asia Pacific Tacrolimus Industry Volume Share (%), by Product Type 2024 & 2032
- Figure 59: Asia Pacific Tacrolimus Industry Revenue (Million), by Application 2024 & 2032
- Figure 60: Asia Pacific Tacrolimus Industry Volume (K Unit), by Application 2024 & 2032
- Figure 61: Asia Pacific Tacrolimus Industry Revenue Share (%), by Application 2024 & 2032
- Figure 62: Asia Pacific Tacrolimus Industry Volume Share (%), by Application 2024 & 2032
- Figure 63: Asia Pacific Tacrolimus Industry Revenue (Million), by End Users 2024 & 2032
- Figure 64: Asia Pacific Tacrolimus Industry Volume (K Unit), by End Users 2024 & 2032
- Figure 65: Asia Pacific Tacrolimus Industry Revenue Share (%), by End Users 2024 & 2032
- Figure 66: Asia Pacific Tacrolimus Industry Volume Share (%), by End Users 2024 & 2032
- Figure 67: Asia Pacific Tacrolimus Industry Revenue (Million), by Country 2024 & 2032
- Figure 68: Asia Pacific Tacrolimus Industry Volume (K Unit), by Country 2024 & 2032
- Figure 69: Asia Pacific Tacrolimus Industry Revenue Share (%), by Country 2024 & 2032
- Figure 70: Asia Pacific Tacrolimus Industry Volume Share (%), by Country 2024 & 2032
- Figure 71: Middle East and Africa Tacrolimus Industry Revenue (Million), by Product Type 2024 & 2032
- Figure 72: Middle East and Africa Tacrolimus Industry Volume (K Unit), by Product Type 2024 & 2032
- Figure 73: Middle East and Africa Tacrolimus Industry Revenue Share (%), by Product Type 2024 & 2032
- Figure 74: Middle East and Africa Tacrolimus Industry Volume Share (%), by Product Type 2024 & 2032
- Figure 75: Middle East and Africa Tacrolimus Industry Revenue (Million), by Application 2024 & 2032
- Figure 76: Middle East and Africa Tacrolimus Industry Volume (K Unit), by Application 2024 & 2032
- Figure 77: Middle East and Africa Tacrolimus Industry Revenue Share (%), by Application 2024 & 2032
- Figure 78: Middle East and Africa Tacrolimus Industry Volume Share (%), by Application 2024 & 2032
- Figure 79: Middle East and Africa Tacrolimus Industry Revenue (Million), by End Users 2024 & 2032
- Figure 80: Middle East and Africa Tacrolimus Industry Volume (K Unit), by End Users 2024 & 2032
- Figure 81: Middle East and Africa Tacrolimus Industry Revenue Share (%), by End Users 2024 & 2032
- Figure 82: Middle East and Africa Tacrolimus Industry Volume Share (%), by End Users 2024 & 2032
- Figure 83: Middle East and Africa Tacrolimus Industry Revenue (Million), by Country 2024 & 2032
- Figure 84: Middle East and Africa Tacrolimus Industry Volume (K Unit), by Country 2024 & 2032
- Figure 85: Middle East and Africa Tacrolimus Industry Revenue Share (%), by Country 2024 & 2032
- Figure 86: Middle East and Africa Tacrolimus Industry Volume Share (%), by Country 2024 & 2032
- Figure 87: South America Tacrolimus Industry Revenue (Million), by Product Type 2024 & 2032
- Figure 88: South America Tacrolimus Industry Volume (K Unit), by Product Type 2024 & 2032
- Figure 89: South America Tacrolimus Industry Revenue Share (%), by Product Type 2024 & 2032
- Figure 90: South America Tacrolimus Industry Volume Share (%), by Product Type 2024 & 2032
- Figure 91: South America Tacrolimus Industry Revenue (Million), by Application 2024 & 2032
- Figure 92: South America Tacrolimus Industry Volume (K Unit), by Application 2024 & 2032
- Figure 93: South America Tacrolimus Industry Revenue Share (%), by Application 2024 & 2032
- Figure 94: South America Tacrolimus Industry Volume Share (%), by Application 2024 & 2032
- Figure 95: South America Tacrolimus Industry Revenue (Million), by End Users 2024 & 2032
- Figure 96: South America Tacrolimus Industry Volume (K Unit), by End Users 2024 & 2032
- Figure 97: South America Tacrolimus Industry Revenue Share (%), by End Users 2024 & 2032
- Figure 98: South America Tacrolimus Industry Volume Share (%), by End Users 2024 & 2032
- Figure 99: South America Tacrolimus Industry Revenue (Million), by Country 2024 & 2032
- Figure 100: South America Tacrolimus Industry Volume (K Unit), by Country 2024 & 2032
- Figure 101: South America Tacrolimus Industry Revenue Share (%), by Country 2024 & 2032
- Figure 102: South America Tacrolimus Industry Volume Share (%), by Country 2024 & 2032
List of Tables
- Table 1: Global Tacrolimus Industry Revenue Million Forecast, by Region 2019 & 2032
- Table 2: Global Tacrolimus Industry Volume K Unit Forecast, by Region 2019 & 2032
- Table 3: Global Tacrolimus Industry Revenue Million Forecast, by Product Type 2019 & 2032
- Table 4: Global Tacrolimus Industry Volume K Unit Forecast, by Product Type 2019 & 2032
- Table 5: Global Tacrolimus Industry Revenue Million Forecast, by Application 2019 & 2032
- Table 6: Global Tacrolimus Industry Volume K Unit Forecast, by Application 2019 & 2032
- Table 7: Global Tacrolimus Industry Revenue Million Forecast, by End Users 2019 & 2032
- Table 8: Global Tacrolimus Industry Volume K Unit Forecast, by End Users 2019 & 2032
- Table 9: Global Tacrolimus Industry Revenue Million Forecast, by Region 2019 & 2032
- Table 10: Global Tacrolimus Industry Volume K Unit Forecast, by Region 2019 & 2032
- Table 11: Global Tacrolimus Industry Revenue Million Forecast, by Country 2019 & 2032
- Table 12: Global Tacrolimus Industry Volume K Unit Forecast, by Country 2019 & 2032
- Table 13: Global Tacrolimus Industry Revenue Million Forecast, by Country 2019 & 2032
- Table 14: Global Tacrolimus Industry Volume K Unit Forecast, by Country 2019 & 2032
- Table 15: Global Tacrolimus Industry Revenue Million Forecast, by Country 2019 & 2032
- Table 16: Global Tacrolimus Industry Volume K Unit Forecast, by Country 2019 & 2032
- Table 17: Global Tacrolimus Industry Revenue Million Forecast, by Country 2019 & 2032
- Table 18: Global Tacrolimus Industry Volume K Unit Forecast, by Country 2019 & 2032
- Table 19: Global Tacrolimus Industry Revenue Million Forecast, by Country 2019 & 2032
- Table 20: Global Tacrolimus Industry Volume K Unit Forecast, by Country 2019 & 2032
- Table 21: Global Tacrolimus Industry Revenue Million Forecast, by Product Type 2019 & 2032
- Table 22: Global Tacrolimus Industry Volume K Unit Forecast, by Product Type 2019 & 2032
- Table 23: Global Tacrolimus Industry Revenue Million Forecast, by Application 2019 & 2032
- Table 24: Global Tacrolimus Industry Volume K Unit Forecast, by Application 2019 & 2032
- Table 25: Global Tacrolimus Industry Revenue Million Forecast, by End Users 2019 & 2032
- Table 26: Global Tacrolimus Industry Volume K Unit Forecast, by End Users 2019 & 2032
- Table 27: Global Tacrolimus Industry Revenue Million Forecast, by Country 2019 & 2032
- Table 28: Global Tacrolimus Industry Volume K Unit Forecast, by Country 2019 & 2032
- Table 29: United States Tacrolimus Industry Revenue (Million) Forecast, by Application 2019 & 2032
- Table 30: United States Tacrolimus Industry Volume (K Unit) Forecast, by Application 2019 & 2032
- Table 31: Canada Tacrolimus Industry Revenue (Million) Forecast, by Application 2019 & 2032
- Table 32: Canada Tacrolimus Industry Volume (K Unit) Forecast, by Application 2019 & 2032
- Table 33: Mexico Tacrolimus Industry Revenue (Million) Forecast, by Application 2019 & 2032
- Table 34: Mexico Tacrolimus Industry Volume (K Unit) Forecast, by Application 2019 & 2032
- Table 35: Global Tacrolimus Industry Revenue Million Forecast, by Product Type 2019 & 2032
- Table 36: Global Tacrolimus Industry Volume K Unit Forecast, by Product Type 2019 & 2032
- Table 37: Global Tacrolimus Industry Revenue Million Forecast, by Application 2019 & 2032
- Table 38: Global Tacrolimus Industry Volume K Unit Forecast, by Application 2019 & 2032
- Table 39: Global Tacrolimus Industry Revenue Million Forecast, by End Users 2019 & 2032
- Table 40: Global Tacrolimus Industry Volume K Unit Forecast, by End Users 2019 & 2032
- Table 41: Global Tacrolimus Industry Revenue Million Forecast, by Country 2019 & 2032
- Table 42: Global Tacrolimus Industry Volume K Unit Forecast, by Country 2019 & 2032
- Table 43: Germany Tacrolimus Industry Revenue (Million) Forecast, by Application 2019 & 2032
- Table 44: Germany Tacrolimus Industry Volume (K Unit) Forecast, by Application 2019 & 2032
- Table 45: United Kingdom Tacrolimus Industry Revenue (Million) Forecast, by Application 2019 & 2032
- Table 46: United Kingdom Tacrolimus Industry Volume (K Unit) Forecast, by Application 2019 & 2032
- Table 47: France Tacrolimus Industry Revenue (Million) Forecast, by Application 2019 & 2032
- Table 48: France Tacrolimus Industry Volume (K Unit) Forecast, by Application 2019 & 2032
- Table 49: Italy Tacrolimus Industry Revenue (Million) Forecast, by Application 2019 & 2032
- Table 50: Italy Tacrolimus Industry Volume (K Unit) Forecast, by Application 2019 & 2032
- Table 51: Spain Tacrolimus Industry Revenue (Million) Forecast, by Application 2019 & 2032
- Table 52: Spain Tacrolimus Industry Volume (K Unit) Forecast, by Application 2019 & 2032
- Table 53: Rest of Europe Tacrolimus Industry Revenue (Million) Forecast, by Application 2019 & 2032
- Table 54: Rest of Europe Tacrolimus Industry Volume (K Unit) Forecast, by Application 2019 & 2032
- Table 55: Global Tacrolimus Industry Revenue Million Forecast, by Product Type 2019 & 2032
- Table 56: Global Tacrolimus Industry Volume K Unit Forecast, by Product Type 2019 & 2032
- Table 57: Global Tacrolimus Industry Revenue Million Forecast, by Application 2019 & 2032
- Table 58: Global Tacrolimus Industry Volume K Unit Forecast, by Application 2019 & 2032
- Table 59: Global Tacrolimus Industry Revenue Million Forecast, by End Users 2019 & 2032
- Table 60: Global Tacrolimus Industry Volume K Unit Forecast, by End Users 2019 & 2032
- Table 61: Global Tacrolimus Industry Revenue Million Forecast, by Country 2019 & 2032
- Table 62: Global Tacrolimus Industry Volume K Unit Forecast, by Country 2019 & 2032
- Table 63: China Tacrolimus Industry Revenue (Million) Forecast, by Application 2019 & 2032
- Table 64: China Tacrolimus Industry Volume (K Unit) Forecast, by Application 2019 & 2032
- Table 65: Japan Tacrolimus Industry Revenue (Million) Forecast, by Application 2019 & 2032
- Table 66: Japan Tacrolimus Industry Volume (K Unit) Forecast, by Application 2019 & 2032
- Table 67: India Tacrolimus Industry Revenue (Million) Forecast, by Application 2019 & 2032
- Table 68: India Tacrolimus Industry Volume (K Unit) Forecast, by Application 2019 & 2032
- Table 69: Australia Tacrolimus Industry Revenue (Million) Forecast, by Application 2019 & 2032
- Table 70: Australia Tacrolimus Industry Volume (K Unit) Forecast, by Application 2019 & 2032
- Table 71: South Korea Tacrolimus Industry Revenue (Million) Forecast, by Application 2019 & 2032
- Table 72: South Korea Tacrolimus Industry Volume (K Unit) Forecast, by Application 2019 & 2032
- Table 73: Rest of Asia Pacific Tacrolimus Industry Revenue (Million) Forecast, by Application 2019 & 2032
- Table 74: Rest of Asia Pacific Tacrolimus Industry Volume (K Unit) Forecast, by Application 2019 & 2032
- Table 75: Global Tacrolimus Industry Revenue Million Forecast, by Product Type 2019 & 2032
- Table 76: Global Tacrolimus Industry Volume K Unit Forecast, by Product Type 2019 & 2032
- Table 77: Global Tacrolimus Industry Revenue Million Forecast, by Application 2019 & 2032
- Table 78: Global Tacrolimus Industry Volume K Unit Forecast, by Application 2019 & 2032
- Table 79: Global Tacrolimus Industry Revenue Million Forecast, by End Users 2019 & 2032
- Table 80: Global Tacrolimus Industry Volume K Unit Forecast, by End Users 2019 & 2032
- Table 81: Global Tacrolimus Industry Revenue Million Forecast, by Country 2019 & 2032
- Table 82: Global Tacrolimus Industry Volume K Unit Forecast, by Country 2019 & 2032
- Table 83: GCC Tacrolimus Industry Revenue (Million) Forecast, by Application 2019 & 2032
- Table 84: GCC Tacrolimus Industry Volume (K Unit) Forecast, by Application 2019 & 2032
- Table 85: South Africa Tacrolimus Industry Revenue (Million) Forecast, by Application 2019 & 2032
- Table 86: South Africa Tacrolimus Industry Volume (K Unit) Forecast, by Application 2019 & 2032
- Table 87: Rest of Middle East and Africa Tacrolimus Industry Revenue (Million) Forecast, by Application 2019 & 2032
- Table 88: Rest of Middle East and Africa Tacrolimus Industry Volume (K Unit) Forecast, by Application 2019 & 2032
- Table 89: Global Tacrolimus Industry Revenue Million Forecast, by Product Type 2019 & 2032
- Table 90: Global Tacrolimus Industry Volume K Unit Forecast, by Product Type 2019 & 2032
- Table 91: Global Tacrolimus Industry Revenue Million Forecast, by Application 2019 & 2032
- Table 92: Global Tacrolimus Industry Volume K Unit Forecast, by Application 2019 & 2032
- Table 93: Global Tacrolimus Industry Revenue Million Forecast, by End Users 2019 & 2032
- Table 94: Global Tacrolimus Industry Volume K Unit Forecast, by End Users 2019 & 2032
- Table 95: Global Tacrolimus Industry Revenue Million Forecast, by Country 2019 & 2032
- Table 96: Global Tacrolimus Industry Volume K Unit Forecast, by Country 2019 & 2032
- Table 97: Brazil Tacrolimus Industry Revenue (Million) Forecast, by Application 2019 & 2032
- Table 98: Brazil Tacrolimus Industry Volume (K Unit) Forecast, by Application 2019 & 2032
- Table 99: Argentina Tacrolimus Industry Revenue (Million) Forecast, by Application 2019 & 2032
- Table 100: Argentina Tacrolimus Industry Volume (K Unit) Forecast, by Application 2019 & 2032
- Table 101: Rest of South America Tacrolimus Industry Revenue (Million) Forecast, by Application 2019 & 2032
- Table 102: Rest of South America Tacrolimus Industry Volume (K Unit) Forecast, by Application 2019 & 2032
Frequently Asked Questions
1. What is the projected Compound Annual Growth Rate (CAGR) of the Tacrolimus Industry?
The projected CAGR is approximately 5.20%.
2. Which companies are prominent players in the Tacrolimus Industry?
Key companies in the market include Lupin Pharmaceuticals Inc, Glenmark Pharmaceuticals Inc, Panacea Biotec, Astellas Pharma Inc, LEO Pharma A/S, GlaxoSmithKline plc, Novartis AG, Biocon Ltd, Dr Reddy's Laboratories Ltd, Pfizer Inc.
3. What are the main segments of the Tacrolimus Industry?
The market segments include Product Type, Application, End Users.
4. Can you provide details about the market size?
The market size is estimated to be USD XX Million as of 2022.
5. What are some drivers contributing to market growth?
Increasing Number of Transplants Worldwide; Surge in Research and Development Activities for Immunosuppression.
6. What are the notable trends driving market growth?
Immunosuppression Segment is Expected to Witness Growth over the Forecast Period.
7. Are there any restraints impacting market growth?
Side Effects of the Tacrolimus.
8. Can you provide examples of recent developments in the market?
N/A
9. What pricing options are available for accessing the report?
Pricing options include single-user, multi-user, and enterprise licenses priced at USD 4750, USD 5250, and USD 8750 respectively.
10. Is the market size provided in terms of value or volume?
The market size is provided in terms of value, measured in Million and volume, measured in K Unit.
11. Are there any specific market keywords associated with the report?
Yes, the market keyword associated with the report is "Tacrolimus Industry," which aids in identifying and referencing the specific market segment covered.
12. How do I determine which pricing option suits my needs best?
The pricing options vary based on user requirements and access needs. Individual users may opt for single-user licenses, while businesses requiring broader access may choose multi-user or enterprise licenses for cost-effective access to the report.
13. Are there any additional resources or data provided in the Tacrolimus Industry report?
While the report offers comprehensive insights, it's advisable to review the specific contents or supplementary materials provided to ascertain if additional resources or data are available.
14. How can I stay updated on further developments or reports in the Tacrolimus Industry?
To stay informed about further developments, trends, and reports in the Tacrolimus Industry, consider subscribing to industry newsletters, following relevant companies and organizations, or regularly checking reputable industry news sources and publications.
Methodology
Step 1 - Identification of Relevant Samples Size from Population Database


Step 2 - Approaches for Defining Global Market Size (Value, Volume* & Price*)

Note*: In applicable scenarios
Step 3 - Data Sources
Primary Research
- Web Analytics
- Survey Reports
- Research Institute
- Latest Research Reports
- Opinion Leaders
Secondary Research
- Annual Reports
- White Paper
- Latest Press Release
- Industry Association
- Paid Database
- Investor Presentations

Step 4 - Data Triangulation
Involves using different sources of information in order to increase the validity of a study
These sources are likely to be stakeholders in a program - participants, other researchers, program staff, other community members, and so on.
Then we put all data in single framework & apply various statistical tools to find out the dynamic on the market.
During the analysis stage, feedback from the stakeholder groups would be compared to determine areas of agreement as well as areas of divergence


