
Key Insights
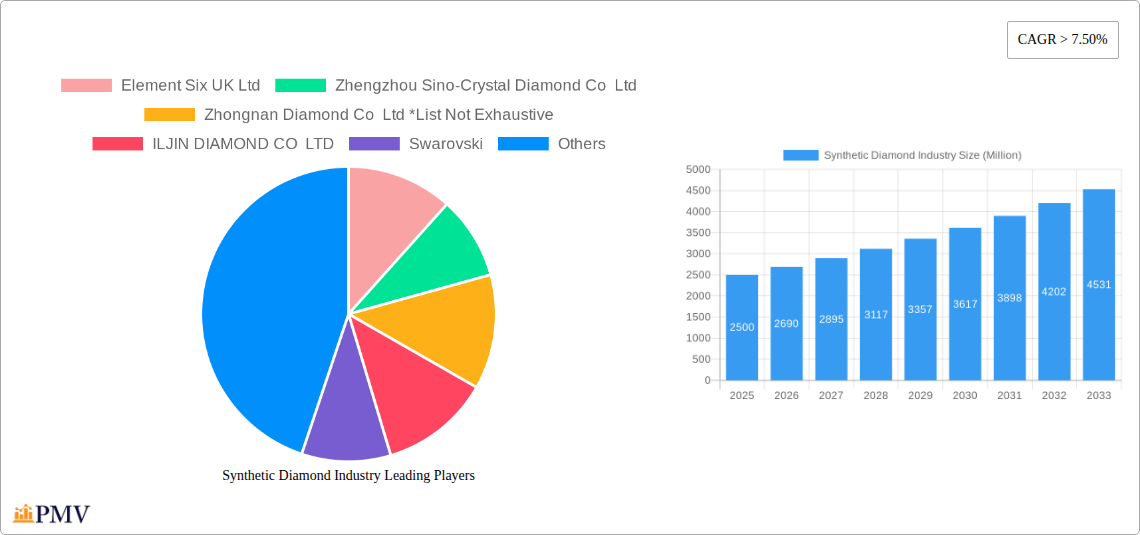
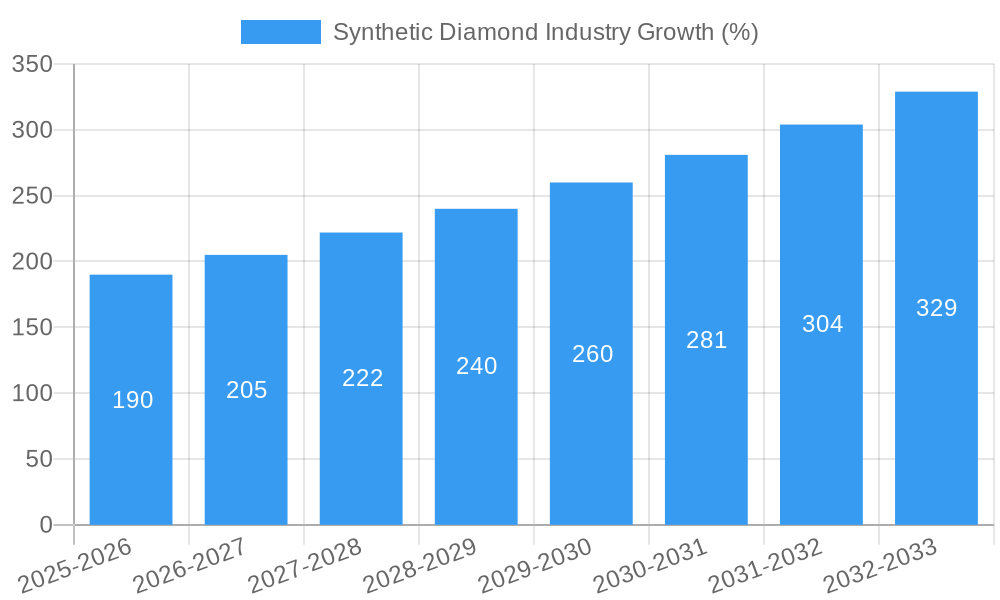
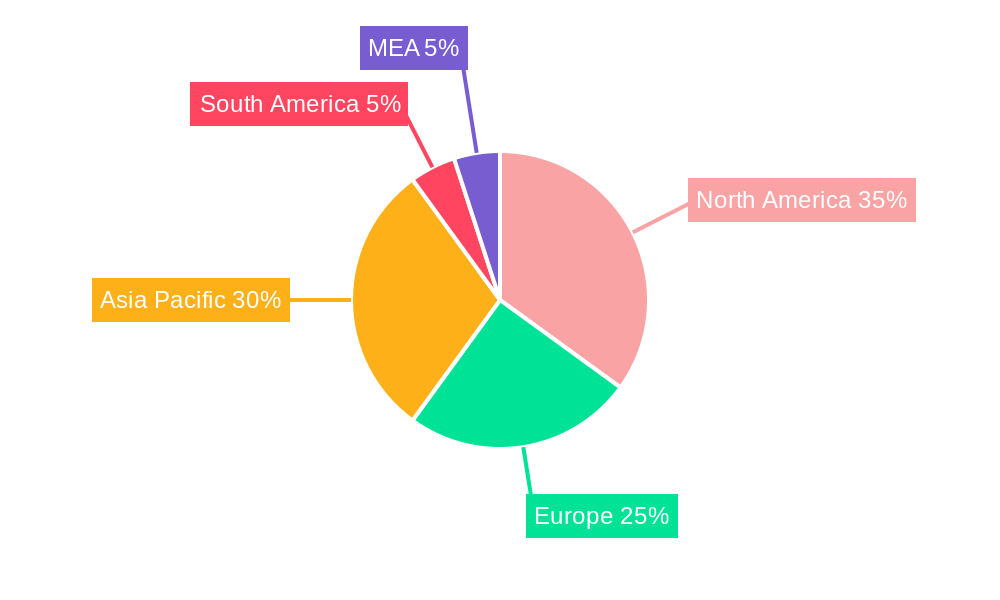
The synthetic diamond market is experiencing robust growth, projected to maintain a Compound Annual Growth Rate (CAGR) exceeding 7.5% from 2025 to 2033. This expansion is fueled by several key drivers. Increasing demand from the jewelry sector, driven by consumer preference for ethically sourced and environmentally friendly alternatives to mined diamonds, is a significant factor. Furthermore, the industrial applications of synthetic diamonds are rapidly expanding. Their exceptional hardness, thermal conductivity, and optical properties make them indispensable in cutting-edge technologies, including semiconductors, precision machining, and high-power electronics. The market segmentation reveals a strong preference for polished diamonds, with rough diamonds and specific manufacturing processes like High Pressure High Temperature (HPHT) and Chemical Vapor Deposition (CVD) playing crucial roles in production. Leading players like Element Six, Swarovski, and others are actively investing in research and development, driving innovation and enhancing the capabilities of synthetic diamonds. Regional analysis suggests a strong presence in North America and Asia Pacific, specifically China, reflecting the concentration of both manufacturing and consumer markets. However, growth opportunities exist in other regions, particularly as awareness and adoption of synthetic diamonds increases.
The market's sustained growth trajectory is expected to be influenced by ongoing technological advancements. Improvements in CVD and HPHT techniques are continuously increasing the efficiency and cost-effectiveness of synthetic diamond production, leading to lower prices and wider accessibility. However, potential restraints include price fluctuations of raw materials and the ongoing challenge of competing with the established market for mined diamonds. Successfully navigating these challenges hinges on technological breakthroughs, strategic marketing focusing on the ethical and sustainable advantages of synthetic diamonds, and the continued exploration of new industrial applications. The diverse range of applications and the commitment of major players to innovation suggest a promising future for the synthetic diamond market, with considerable potential for further expansion and market penetration in the coming years.
Synthetic Diamond Industry Market Report: 2019-2033
This comprehensive report provides an in-depth analysis of the synthetic diamond industry, offering invaluable insights for businesses and investors seeking to navigate this rapidly evolving market. The report covers the period 2019-2033, with a focus on the forecast period 2025-2033, using 2025 as the base year. The total market size is projected to reach xx Million by 2033. This report analyzes key market segments, competitive dynamics, technological advancements, and future growth opportunities.
Synthetic Diamond Industry Market Structure & Competitive Dynamics
The synthetic diamond market exhibits a moderately concentrated structure, with key players like Element Six UK Ltd, Zhengzhou Sino-Crystal Diamond Co Ltd, and Zhongnan Diamond Co Ltd holding significant market share. However, the market is also characterized by a dynamic competitive landscape with numerous emerging players and ongoing innovation. Market concentration is estimated at xx% in 2025, indicating a relatively balanced distribution of market share among the top players. The industry's innovation ecosystem is vibrant, driven by continuous advancements in manufacturing processes like High Pressure High Temperature (HPHT) and Chemical Vapor Deposition (CVD). Regulatory frameworks vary across different regions, impacting production costs and market access. Product substitutes, such as other gemstones and materials with similar properties, pose a competitive challenge. End-user trends, particularly in the jewelry and industrial sectors, significantly influence market demand. M&A activities are prevalent, with deal values exceeding xx Million in recent years, primarily focused on consolidating market share and acquiring advanced technologies.
- Market Share (2025 Estimate): Element Six UK Ltd (xx%), Zhengzhou Sino-Crystal Diamond Co Ltd (xx%), Zhongnan Diamond Co Ltd (xx%), Others (xx%).
- M&A Activity (2019-2024): xx major deals, with a total value exceeding xx Million.
- Key Regulatory Factors: Varying import/export regulations, environmental regulations concerning manufacturing processes.
Synthetic Diamond Industry Industry Trends & Insights
The synthetic diamond market is experiencing robust growth, driven by several factors. Technological advancements in HPHT and CVD methods have led to significant improvements in diamond quality, size, and cost-effectiveness. This has broadened the application of synthetic diamonds beyond jewelry into various industrial sectors, including electronics, cutting tools, and medical devices. The Compound Annual Growth Rate (CAGR) is projected at xx% during the forecast period (2025-2033). Increased consumer preference for lab-grown diamonds, driven by ethical and sustainability concerns, is a key market driver. Market penetration of synthetic diamonds in the jewelry sector is steadily increasing, projected to reach xx% by 2033. Competitive dynamics remain intense, with companies focusing on innovation, cost optimization, and brand building to gain market share.
Dominant Markets & Segments in Synthetic Diamond Industry
The Asia-Pacific region currently dominates the synthetic diamond market, particularly China, driven by strong economic growth and a large consumer base. Significant growth is also expected from other regions like North America and Europe, fueled by rising demand across various applications.
Dominant Segments:
By Type: Polished synthetic diamonds currently hold a larger market share compared to rough diamonds due to the higher value-added nature of the polished products. The market size of polished diamonds is estimated at xx Million in 2025. The market for other polished types is projected to grow at xx% CAGR.
By Manufacturing Process: HPHT and CVD methods both contribute significantly to the total market, with the choice depending on the desired diamond properties. CVD is gaining popularity for its ability to produce high-quality, single-crystal diamonds with specific characteristics.
Key Drivers for Dominant Regions:
- China: Strong economic growth, large consumer market, significant domestic production capacity.
- USA: Large industrial applications, robust research and development, strong consumer preference for lab-grown diamonds.
- Europe: Growing consumer preference for lab grown diamonds, government support for sustainable technologies.
Synthetic Diamond Industry Product Innovations
Recent product innovations focus on enhancing diamond quality, expanding applications, and improving cost-efficiency. Advances in CVD technology enable the production of diamonds with tailored properties for specific applications, like high-power electronics and medical devices. New applications are continually emerging, driving growth beyond traditional uses in jewelry and industrial tools. Companies are investing heavily in R&D to further improve the efficiency and cost-effectiveness of manufacturing processes, making synthetic diamonds increasingly competitive.
Report Segmentation & Scope
This report segments the synthetic diamond market based on:
Type: Polished and Rough. Polished diamonds are projected to grow at a CAGR of xx% during the forecast period, driven by strong demand from the jewelry sector. The rough diamond segment is expected to grow at a CAGR of xx%, driven primarily by industrial applications. Competitive dynamics vary across segments, with different players specializing in specific types of diamonds.
Manufacturing Process: HPHT and CVD. The HPHT segment is expected to dominate the market in 2025 due to established production capacity and cost-effectiveness. However, the CVD segment is expected to experience higher growth rates due to its ability to produce higher-quality diamonds with specific properties.
Key Drivers of Synthetic Diamond Industry Growth
Several factors are driving the growth of the synthetic diamond industry: technological advancements leading to improved quality and lower costs, increasing demand from the jewelry and industrial sectors, and growing consumer awareness of lab-grown diamonds' ethical and sustainable aspects. Government regulations promoting environmentally friendly practices are also contributing to market growth.
Challenges in the Synthetic Diamond Industry Sector
The industry faces challenges including intense competition, fluctuating raw material prices, and maintaining consistent product quality across large production volumes. The perception of synthetic diamonds in the market, compared to natural diamonds, continues to be a factor. Strict environmental regulations concerning manufacturing processes can impact production costs. Maintaining a stable and efficient supply chain is also crucial for long-term growth.
Leading Players in the Synthetic Diamond Industry Market
- Element Six UK Ltd
- Zhengzhou Sino-Crystal Diamond Co Ltd
- Zhongnan Diamond Co Ltd
- ILJIN DIAMOND CO LTD
- Swarovski
- New Diamond Technology
- Pure Grown Diamonds (PGD)
- Applied Diamond Inc
- Henan Huanghe Whirlwind Co Ltd
- Sumitomo Electric Industries Ltd
- Adamas One Corp
Key Developments in Synthetic Diamond Industry Sector
- July 2021: Element Six UK LTD partnered with the University of Warwick to develop next-generation synthetic diamond technologies. This collaboration enhances Element Six's technological leadership.
- February 2022: Element Six UK Ltd collaborated with II-VI Inc. to produce high-quality single-crystal diamonds, expanding II-VI's diamond technology capabilities. This strategic partnership strengthens both companies’ positions in the market.
Strategic Synthetic Diamond Industry Market Outlook
The synthetic diamond market holds immense future potential, driven by continuous technological advancements, expanding applications, and increasing consumer acceptance. Strategic opportunities lie in developing innovative products tailored to specific applications, optimizing manufacturing processes to reduce costs, and enhancing brand building and marketing strategies. Focusing on sustainability and ethical sourcing will be critical for long-term success.
Synthetic Diamond Industry Segmentation
-
1. Type
-
1.1. Polished
- 1.1.1. Jewelry
- 1.1.2. Electronics
- 1.1.3. Healthcare
- 1.1.4. Other Polished Types
-
1.2. Rough
- 1.2.1. Construction
- 1.2.2. Mining
- 1.2.3. Oil and Gas
- 1.2.4. Other Rough Types
-
1.1. Polished
-
2. Manufacturing Process
- 2.1. High Pressure, High Temperature (HPHT)
- 2.2. Chemical Vapor Deposition (CVD)
Synthetic Diamond Industry Segmentation By Geography
-
1. Asia Pacific
- 1.1. China
- 1.2. India
- 1.3. Japan
- 1.4. ASEAN Countries
- 1.5. Rest of Asia Pacific
-
2. North America
- 2.1. United States
- 2.2. Rest of North America
-
3. Europe
- 3.1. Germany
- 3.2. France
- 3.3. United Kingdom
- 3.4. Italy
- 3.5. Spain
- 3.6. Rest of Europe
-
4. South America
- 4.1. Brazil
- 4.2. Rest of South America
-
5. Middle East and Africa
- 5.1. GCC Countries
- 5.2. South Africa
- 5.3. Rest of Middle East and Africa
Synthetic Diamond Industry REPORT HIGHLIGHTS
| Aspects | Details |
|---|---|
| Study Period | 2019-2033 |
| Base Year | 2024 |
| Estimated Year | 2025 |
| Forecast Period | 2025-2033 |
| Historical Period | 2019-2024 |
| Growth Rate | CAGR of > 7.50% from 2019-2033 |
| Segmentation |
|
Table of Contents
- 1. Introduction
- 1.1. Research Scope
- 1.2. Market Segmentation
- 1.3. Research Methodology
- 1.4. Definitions and Assumptions
- 2. Executive Summary
- 2.1. Introduction
- 3. Market Dynamics
- 3.1. Introduction
- 3.2. Market Drivers
- 3.2.1. Increasing Demand from Electronics and Semiconductors Applications; Growing Demand for Super Abrasives
- 3.3. Market Restrains
- 3.3.1. Complex Manufacturing Process
- 3.4. Market Trends
- 3.4.1. Construction Segment to Dominate the Rough Type
- 4. Market Factor Analysis
- 4.1. Porters Five Forces
- 4.2. Supply/Value Chain
- 4.3. PESTEL analysis
- 4.4. Market Entropy
- 4.5. Patent/Trademark Analysis
- 5. Global Synthetic Diamond Industry Analysis, Insights and Forecast, 2019-2031
- 5.1. Market Analysis, Insights and Forecast - by Type
- 5.1.1. Polished
- 5.1.1.1. Jewelry
- 5.1.1.2. Electronics
- 5.1.1.3. Healthcare
- 5.1.1.4. Other Polished Types
- 5.1.2. Rough
- 5.1.2.1. Construction
- 5.1.2.2. Mining
- 5.1.2.3. Oil and Gas
- 5.1.2.4. Other Rough Types
- 5.1.1. Polished
- 5.2. Market Analysis, Insights and Forecast - by Manufacturing Process
- 5.2.1. High Pressure, High Temperature (HPHT)
- 5.2.2. Chemical Vapor Deposition (CVD)
- 5.3. Market Analysis, Insights and Forecast - by Region
- 5.3.1. Asia Pacific
- 5.3.2. North America
- 5.3.3. Europe
- 5.3.4. South America
- 5.3.5. Middle East and Africa
- 5.1. Market Analysis, Insights and Forecast - by Type
- 6. Asia Pacific Synthetic Diamond Industry Analysis, Insights and Forecast, 2019-2031
- 6.1. Market Analysis, Insights and Forecast - by Type
- 6.1.1. Polished
- 6.1.1.1. Jewelry
- 6.1.1.2. Electronics
- 6.1.1.3. Healthcare
- 6.1.1.4. Other Polished Types
- 6.1.2. Rough
- 6.1.2.1. Construction
- 6.1.2.2. Mining
- 6.1.2.3. Oil and Gas
- 6.1.2.4. Other Rough Types
- 6.1.1. Polished
- 6.2. Market Analysis, Insights and Forecast - by Manufacturing Process
- 6.2.1. High Pressure, High Temperature (HPHT)
- 6.2.2. Chemical Vapor Deposition (CVD)
- 6.1. Market Analysis, Insights and Forecast - by Type
- 7. North America Synthetic Diamond Industry Analysis, Insights and Forecast, 2019-2031
- 7.1. Market Analysis, Insights and Forecast - by Type
- 7.1.1. Polished
- 7.1.1.1. Jewelry
- 7.1.1.2. Electronics
- 7.1.1.3. Healthcare
- 7.1.1.4. Other Polished Types
- 7.1.2. Rough
- 7.1.2.1. Construction
- 7.1.2.2. Mining
- 7.1.2.3. Oil and Gas
- 7.1.2.4. Other Rough Types
- 7.1.1. Polished
- 7.2. Market Analysis, Insights and Forecast - by Manufacturing Process
- 7.2.1. High Pressure, High Temperature (HPHT)
- 7.2.2. Chemical Vapor Deposition (CVD)
- 7.1. Market Analysis, Insights and Forecast - by Type
- 8. Europe Synthetic Diamond Industry Analysis, Insights and Forecast, 2019-2031
- 8.1. Market Analysis, Insights and Forecast - by Type
- 8.1.1. Polished
- 8.1.1.1. Jewelry
- 8.1.1.2. Electronics
- 8.1.1.3. Healthcare
- 8.1.1.4. Other Polished Types
- 8.1.2. Rough
- 8.1.2.1. Construction
- 8.1.2.2. Mining
- 8.1.2.3. Oil and Gas
- 8.1.2.4. Other Rough Types
- 8.1.1. Polished
- 8.2. Market Analysis, Insights and Forecast - by Manufacturing Process
- 8.2.1. High Pressure, High Temperature (HPHT)
- 8.2.2. Chemical Vapor Deposition (CVD)
- 8.1. Market Analysis, Insights and Forecast - by Type
- 9. South America Synthetic Diamond Industry Analysis, Insights and Forecast, 2019-2031
- 9.1. Market Analysis, Insights and Forecast - by Type
- 9.1.1. Polished
- 9.1.1.1. Jewelry
- 9.1.1.2. Electronics
- 9.1.1.3. Healthcare
- 9.1.1.4. Other Polished Types
- 9.1.2. Rough
- 9.1.2.1. Construction
- 9.1.2.2. Mining
- 9.1.2.3. Oil and Gas
- 9.1.2.4. Other Rough Types
- 9.1.1. Polished
- 9.2. Market Analysis, Insights and Forecast - by Manufacturing Process
- 9.2.1. High Pressure, High Temperature (HPHT)
- 9.2.2. Chemical Vapor Deposition (CVD)
- 9.1. Market Analysis, Insights and Forecast - by Type
- 10. Middle East and Africa Synthetic Diamond Industry Analysis, Insights and Forecast, 2019-2031
- 10.1. Market Analysis, Insights and Forecast - by Type
- 10.1.1. Polished
- 10.1.1.1. Jewelry
- 10.1.1.2. Electronics
- 10.1.1.3. Healthcare
- 10.1.1.4. Other Polished Types
- 10.1.2. Rough
- 10.1.2.1. Construction
- 10.1.2.2. Mining
- 10.1.2.3. Oil and Gas
- 10.1.2.4. Other Rough Types
- 10.1.1. Polished
- 10.2. Market Analysis, Insights and Forecast - by Manufacturing Process
- 10.2.1. High Pressure, High Temperature (HPHT)
- 10.2.2. Chemical Vapor Deposition (CVD)
- 10.1. Market Analysis, Insights and Forecast - by Type
- 11. North America Synthetic Diamond Industry Analysis, Insights and Forecast, 2019-2031
- 11.1. Market Analysis, Insights and Forecast - By Country/Sub-region
- 11.1.1 United States
- 11.1.2 Canada
- 11.1.3 Mexico
- 12. Europe Synthetic Diamond Industry Analysis, Insights and Forecast, 2019-2031
- 12.1. Market Analysis, Insights and Forecast - By Country/Sub-region
- 12.1.1 Germany
- 12.1.2 United Kingdom
- 12.1.3 France
- 12.1.4 Spain
- 12.1.5 Italy
- 12.1.6 Spain
- 12.1.7 Belgium
- 12.1.8 Netherland
- 12.1.9 Nordics
- 12.1.10 Rest of Europe
- 13. Asia Pacific Synthetic Diamond Industry Analysis, Insights and Forecast, 2019-2031
- 13.1. Market Analysis, Insights and Forecast - By Country/Sub-region
- 13.1.1 China
- 13.1.2 Japan
- 13.1.3 India
- 13.1.4 South Korea
- 13.1.5 Southeast Asia
- 13.1.6 Australia
- 13.1.7 Indonesia
- 13.1.8 Phillipes
- 13.1.9 Singapore
- 13.1.10 Thailandc
- 13.1.11 Rest of Asia Pacific
- 14. South America Synthetic Diamond Industry Analysis, Insights and Forecast, 2019-2031
- 14.1. Market Analysis, Insights and Forecast - By Country/Sub-region
- 14.1.1 Brazil
- 14.1.2 Argentina
- 14.1.3 Peru
- 14.1.4 Chile
- 14.1.5 Colombia
- 14.1.6 Ecuador
- 14.1.7 Venezuela
- 14.1.8 Rest of South America
- 15. North America Synthetic Diamond Industry Analysis, Insights and Forecast, 2019-2031
- 15.1. Market Analysis, Insights and Forecast - By Country/Sub-region
- 15.1.1 United States
- 15.1.2 Canada
- 15.1.3 Mexico
- 16. MEA Synthetic Diamond Industry Analysis, Insights and Forecast, 2019-2031
- 16.1. Market Analysis, Insights and Forecast - By Country/Sub-region
- 16.1.1 United Arab Emirates
- 16.1.2 Saudi Arabia
- 16.1.3 South Africa
- 16.1.4 Rest of Middle East and Africa
- 17. Competitive Analysis
- 17.1. Global Market Share Analysis 2024
- 17.2. Company Profiles
- 17.2.1 Element Six UK Ltd
- 17.2.1.1. Overview
- 17.2.1.2. Products
- 17.2.1.3. SWOT Analysis
- 17.2.1.4. Recent Developments
- 17.2.1.5. Financials (Based on Availability)
- 17.2.2 Zhengzhou Sino-Crystal Diamond Co Ltd
- 17.2.2.1. Overview
- 17.2.2.2. Products
- 17.2.2.3. SWOT Analysis
- 17.2.2.4. Recent Developments
- 17.2.2.5. Financials (Based on Availability)
- 17.2.3 Zhongnan Diamond Co Ltd *List Not Exhaustive
- 17.2.3.1. Overview
- 17.2.3.2. Products
- 17.2.3.3. SWOT Analysis
- 17.2.3.4. Recent Developments
- 17.2.3.5. Financials (Based on Availability)
- 17.2.4 ILJIN DIAMOND CO LTD
- 17.2.4.1. Overview
- 17.2.4.2. Products
- 17.2.4.3. SWOT Analysis
- 17.2.4.4. Recent Developments
- 17.2.4.5. Financials (Based on Availability)
- 17.2.5 Swarovski
- 17.2.5.1. Overview
- 17.2.5.2. Products
- 17.2.5.3. SWOT Analysis
- 17.2.5.4. Recent Developments
- 17.2.5.5. Financials (Based on Availability)
- 17.2.6 New Diamond Technology
- 17.2.6.1. Overview
- 17.2.6.2. Products
- 17.2.6.3. SWOT Analysis
- 17.2.6.4. Recent Developments
- 17.2.6.5. Financials (Based on Availability)
- 17.2.7 Pure Grown Diamonds (PGD)
- 17.2.7.1. Overview
- 17.2.7.2. Products
- 17.2.7.3. SWOT Analysis
- 17.2.7.4. Recent Developments
- 17.2.7.5. Financials (Based on Availability)
- 17.2.8 Applied Diamond Inc
- 17.2.8.1. Overview
- 17.2.8.2. Products
- 17.2.8.3. SWOT Analysis
- 17.2.8.4. Recent Developments
- 17.2.8.5. Financials (Based on Availability)
- 17.2.9 Henan Huanghe Whirlwind Co Ltd
- 17.2.9.1. Overview
- 17.2.9.2. Products
- 17.2.9.3. SWOT Analysis
- 17.2.9.4. Recent Developments
- 17.2.9.5. Financials (Based on Availability)
- 17.2.10 Sumitomo Electric Industries Ltd
- 17.2.10.1. Overview
- 17.2.10.2. Products
- 17.2.10.3. SWOT Analysis
- 17.2.10.4. Recent Developments
- 17.2.10.5. Financials (Based on Availability)
- 17.2.11 Adamas One Corp
- 17.2.11.1. Overview
- 17.2.11.2. Products
- 17.2.11.3. SWOT Analysis
- 17.2.11.4. Recent Developments
- 17.2.11.5. Financials (Based on Availability)
- 17.2.1 Element Six UK Ltd
List of Figures
- Figure 1: Global Synthetic Diamond Industry Revenue Breakdown (Million, %) by Region 2024 & 2032
- Figure 2: North America Synthetic Diamond Industry Revenue (Million), by Country 2024 & 2032
- Figure 3: North America Synthetic Diamond Industry Revenue Share (%), by Country 2024 & 2032
- Figure 4: Europe Synthetic Diamond Industry Revenue (Million), by Country 2024 & 2032
- Figure 5: Europe Synthetic Diamond Industry Revenue Share (%), by Country 2024 & 2032
- Figure 6: Asia Pacific Synthetic Diamond Industry Revenue (Million), by Country 2024 & 2032
- Figure 7: Asia Pacific Synthetic Diamond Industry Revenue Share (%), by Country 2024 & 2032
- Figure 8: South America Synthetic Diamond Industry Revenue (Million), by Country 2024 & 2032
- Figure 9: South America Synthetic Diamond Industry Revenue Share (%), by Country 2024 & 2032
- Figure 10: North America Synthetic Diamond Industry Revenue (Million), by Country 2024 & 2032
- Figure 11: North America Synthetic Diamond Industry Revenue Share (%), by Country 2024 & 2032
- Figure 12: MEA Synthetic Diamond Industry Revenue (Million), by Country 2024 & 2032
- Figure 13: MEA Synthetic Diamond Industry Revenue Share (%), by Country 2024 & 2032
- Figure 14: Asia Pacific Synthetic Diamond Industry Revenue (Million), by Type 2024 & 2032
- Figure 15: Asia Pacific Synthetic Diamond Industry Revenue Share (%), by Type 2024 & 2032
- Figure 16: Asia Pacific Synthetic Diamond Industry Revenue (Million), by Manufacturing Process 2024 & 2032
- Figure 17: Asia Pacific Synthetic Diamond Industry Revenue Share (%), by Manufacturing Process 2024 & 2032
- Figure 18: Asia Pacific Synthetic Diamond Industry Revenue (Million), by Country 2024 & 2032
- Figure 19: Asia Pacific Synthetic Diamond Industry Revenue Share (%), by Country 2024 & 2032
- Figure 20: North America Synthetic Diamond Industry Revenue (Million), by Type 2024 & 2032
- Figure 21: North America Synthetic Diamond Industry Revenue Share (%), by Type 2024 & 2032
- Figure 22: North America Synthetic Diamond Industry Revenue (Million), by Manufacturing Process 2024 & 2032
- Figure 23: North America Synthetic Diamond Industry Revenue Share (%), by Manufacturing Process 2024 & 2032
- Figure 24: North America Synthetic Diamond Industry Revenue (Million), by Country 2024 & 2032
- Figure 25: North America Synthetic Diamond Industry Revenue Share (%), by Country 2024 & 2032
- Figure 26: Europe Synthetic Diamond Industry Revenue (Million), by Type 2024 & 2032
- Figure 27: Europe Synthetic Diamond Industry Revenue Share (%), by Type 2024 & 2032
- Figure 28: Europe Synthetic Diamond Industry Revenue (Million), by Manufacturing Process 2024 & 2032
- Figure 29: Europe Synthetic Diamond Industry Revenue Share (%), by Manufacturing Process 2024 & 2032
- Figure 30: Europe Synthetic Diamond Industry Revenue (Million), by Country 2024 & 2032
- Figure 31: Europe Synthetic Diamond Industry Revenue Share (%), by Country 2024 & 2032
- Figure 32: South America Synthetic Diamond Industry Revenue (Million), by Type 2024 & 2032
- Figure 33: South America Synthetic Diamond Industry Revenue Share (%), by Type 2024 & 2032
- Figure 34: South America Synthetic Diamond Industry Revenue (Million), by Manufacturing Process 2024 & 2032
- Figure 35: South America Synthetic Diamond Industry Revenue Share (%), by Manufacturing Process 2024 & 2032
- Figure 36: South America Synthetic Diamond Industry Revenue (Million), by Country 2024 & 2032
- Figure 37: South America Synthetic Diamond Industry Revenue Share (%), by Country 2024 & 2032
- Figure 38: Middle East and Africa Synthetic Diamond Industry Revenue (Million), by Type 2024 & 2032
- Figure 39: Middle East and Africa Synthetic Diamond Industry Revenue Share (%), by Type 2024 & 2032
- Figure 40: Middle East and Africa Synthetic Diamond Industry Revenue (Million), by Manufacturing Process 2024 & 2032
- Figure 41: Middle East and Africa Synthetic Diamond Industry Revenue Share (%), by Manufacturing Process 2024 & 2032
- Figure 42: Middle East and Africa Synthetic Diamond Industry Revenue (Million), by Country 2024 & 2032
- Figure 43: Middle East and Africa Synthetic Diamond Industry Revenue Share (%), by Country 2024 & 2032
List of Tables
- Table 1: Global Synthetic Diamond Industry Revenue Million Forecast, by Region 2019 & 2032
- Table 2: Global Synthetic Diamond Industry Revenue Million Forecast, by Type 2019 & 2032
- Table 3: Global Synthetic Diamond Industry Revenue Million Forecast, by Manufacturing Process 2019 & 2032
- Table 4: Global Synthetic Diamond Industry Revenue Million Forecast, by Region 2019 & 2032
- Table 5: Global Synthetic Diamond Industry Revenue Million Forecast, by Country 2019 & 2032
- Table 6: United States Synthetic Diamond Industry Revenue (Million) Forecast, by Application 2019 & 2032
- Table 7: Canada Synthetic Diamond Industry Revenue (Million) Forecast, by Application 2019 & 2032
- Table 8: Mexico Synthetic Diamond Industry Revenue (Million) Forecast, by Application 2019 & 2032
- Table 9: Global Synthetic Diamond Industry Revenue Million Forecast, by Country 2019 & 2032
- Table 10: Germany Synthetic Diamond Industry Revenue (Million) Forecast, by Application 2019 & 2032
- Table 11: United Kingdom Synthetic Diamond Industry Revenue (Million) Forecast, by Application 2019 & 2032
- Table 12: France Synthetic Diamond Industry Revenue (Million) Forecast, by Application 2019 & 2032
- Table 13: Spain Synthetic Diamond Industry Revenue (Million) Forecast, by Application 2019 & 2032
- Table 14: Italy Synthetic Diamond Industry Revenue (Million) Forecast, by Application 2019 & 2032
- Table 15: Spain Synthetic Diamond Industry Revenue (Million) Forecast, by Application 2019 & 2032
- Table 16: Belgium Synthetic Diamond Industry Revenue (Million) Forecast, by Application 2019 & 2032
- Table 17: Netherland Synthetic Diamond Industry Revenue (Million) Forecast, by Application 2019 & 2032
- Table 18: Nordics Synthetic Diamond Industry Revenue (Million) Forecast, by Application 2019 & 2032
- Table 19: Rest of Europe Synthetic Diamond Industry Revenue (Million) Forecast, by Application 2019 & 2032
- Table 20: Global Synthetic Diamond Industry Revenue Million Forecast, by Country 2019 & 2032
- Table 21: China Synthetic Diamond Industry Revenue (Million) Forecast, by Application 2019 & 2032
- Table 22: Japan Synthetic Diamond Industry Revenue (Million) Forecast, by Application 2019 & 2032
- Table 23: India Synthetic Diamond Industry Revenue (Million) Forecast, by Application 2019 & 2032
- Table 24: South Korea Synthetic Diamond Industry Revenue (Million) Forecast, by Application 2019 & 2032
- Table 25: Southeast Asia Synthetic Diamond Industry Revenue (Million) Forecast, by Application 2019 & 2032
- Table 26: Australia Synthetic Diamond Industry Revenue (Million) Forecast, by Application 2019 & 2032
- Table 27: Indonesia Synthetic Diamond Industry Revenue (Million) Forecast, by Application 2019 & 2032
- Table 28: Phillipes Synthetic Diamond Industry Revenue (Million) Forecast, by Application 2019 & 2032
- Table 29: Singapore Synthetic Diamond Industry Revenue (Million) Forecast, by Application 2019 & 2032
- Table 30: Thailandc Synthetic Diamond Industry Revenue (Million) Forecast, by Application 2019 & 2032
- Table 31: Rest of Asia Pacific Synthetic Diamond Industry Revenue (Million) Forecast, by Application 2019 & 2032
- Table 32: Global Synthetic Diamond Industry Revenue Million Forecast, by Country 2019 & 2032
- Table 33: Brazil Synthetic Diamond Industry Revenue (Million) Forecast, by Application 2019 & 2032
- Table 34: Argentina Synthetic Diamond Industry Revenue (Million) Forecast, by Application 2019 & 2032
- Table 35: Peru Synthetic Diamond Industry Revenue (Million) Forecast, by Application 2019 & 2032
- Table 36: Chile Synthetic Diamond Industry Revenue (Million) Forecast, by Application 2019 & 2032
- Table 37: Colombia Synthetic Diamond Industry Revenue (Million) Forecast, by Application 2019 & 2032
- Table 38: Ecuador Synthetic Diamond Industry Revenue (Million) Forecast, by Application 2019 & 2032
- Table 39: Venezuela Synthetic Diamond Industry Revenue (Million) Forecast, by Application 2019 & 2032
- Table 40: Rest of South America Synthetic Diamond Industry Revenue (Million) Forecast, by Application 2019 & 2032
- Table 41: Global Synthetic Diamond Industry Revenue Million Forecast, by Country 2019 & 2032
- Table 42: United States Synthetic Diamond Industry Revenue (Million) Forecast, by Application 2019 & 2032
- Table 43: Canada Synthetic Diamond Industry Revenue (Million) Forecast, by Application 2019 & 2032
- Table 44: Mexico Synthetic Diamond Industry Revenue (Million) Forecast, by Application 2019 & 2032
- Table 45: Global Synthetic Diamond Industry Revenue Million Forecast, by Country 2019 & 2032
- Table 46: United Arab Emirates Synthetic Diamond Industry Revenue (Million) Forecast, by Application 2019 & 2032
- Table 47: Saudi Arabia Synthetic Diamond Industry Revenue (Million) Forecast, by Application 2019 & 2032
- Table 48: South Africa Synthetic Diamond Industry Revenue (Million) Forecast, by Application 2019 & 2032
- Table 49: Rest of Middle East and Africa Synthetic Diamond Industry Revenue (Million) Forecast, by Application 2019 & 2032
- Table 50: Global Synthetic Diamond Industry Revenue Million Forecast, by Type 2019 & 2032
- Table 51: Global Synthetic Diamond Industry Revenue Million Forecast, by Manufacturing Process 2019 & 2032
- Table 52: Global Synthetic Diamond Industry Revenue Million Forecast, by Country 2019 & 2032
- Table 53: China Synthetic Diamond Industry Revenue (Million) Forecast, by Application 2019 & 2032
- Table 54: India Synthetic Diamond Industry Revenue (Million) Forecast, by Application 2019 & 2032
- Table 55: Japan Synthetic Diamond Industry Revenue (Million) Forecast, by Application 2019 & 2032
- Table 56: ASEAN Countries Synthetic Diamond Industry Revenue (Million) Forecast, by Application 2019 & 2032
- Table 57: Rest of Asia Pacific Synthetic Diamond Industry Revenue (Million) Forecast, by Application 2019 & 2032
- Table 58: Global Synthetic Diamond Industry Revenue Million Forecast, by Type 2019 & 2032
- Table 59: Global Synthetic Diamond Industry Revenue Million Forecast, by Manufacturing Process 2019 & 2032
- Table 60: Global Synthetic Diamond Industry Revenue Million Forecast, by Country 2019 & 2032
- Table 61: United States Synthetic Diamond Industry Revenue (Million) Forecast, by Application 2019 & 2032
- Table 62: Rest of North America Synthetic Diamond Industry Revenue (Million) Forecast, by Application 2019 & 2032
- Table 63: Global Synthetic Diamond Industry Revenue Million Forecast, by Type 2019 & 2032
- Table 64: Global Synthetic Diamond Industry Revenue Million Forecast, by Manufacturing Process 2019 & 2032
- Table 65: Global Synthetic Diamond Industry Revenue Million Forecast, by Country 2019 & 2032
- Table 66: Germany Synthetic Diamond Industry Revenue (Million) Forecast, by Application 2019 & 2032
- Table 67: France Synthetic Diamond Industry Revenue (Million) Forecast, by Application 2019 & 2032
- Table 68: United Kingdom Synthetic Diamond Industry Revenue (Million) Forecast, by Application 2019 & 2032
- Table 69: Italy Synthetic Diamond Industry Revenue (Million) Forecast, by Application 2019 & 2032
- Table 70: Spain Synthetic Diamond Industry Revenue (Million) Forecast, by Application 2019 & 2032
- Table 71: Rest of Europe Synthetic Diamond Industry Revenue (Million) Forecast, by Application 2019 & 2032
- Table 72: Global Synthetic Diamond Industry Revenue Million Forecast, by Type 2019 & 2032
- Table 73: Global Synthetic Diamond Industry Revenue Million Forecast, by Manufacturing Process 2019 & 2032
- Table 74: Global Synthetic Diamond Industry Revenue Million Forecast, by Country 2019 & 2032
- Table 75: Brazil Synthetic Diamond Industry Revenue (Million) Forecast, by Application 2019 & 2032
- Table 76: Rest of South America Synthetic Diamond Industry Revenue (Million) Forecast, by Application 2019 & 2032
- Table 77: Global Synthetic Diamond Industry Revenue Million Forecast, by Type 2019 & 2032
- Table 78: Global Synthetic Diamond Industry Revenue Million Forecast, by Manufacturing Process 2019 & 2032
- Table 79: Global Synthetic Diamond Industry Revenue Million Forecast, by Country 2019 & 2032
- Table 80: GCC Countries Synthetic Diamond Industry Revenue (Million) Forecast, by Application 2019 & 2032
- Table 81: South Africa Synthetic Diamond Industry Revenue (Million) Forecast, by Application 2019 & 2032
- Table 82: Rest of Middle East and Africa Synthetic Diamond Industry Revenue (Million) Forecast, by Application 2019 & 2032
Frequently Asked Questions
1. What is the projected Compound Annual Growth Rate (CAGR) of the Synthetic Diamond Industry?
The projected CAGR is approximately > 7.50%.
2. Which companies are prominent players in the Synthetic Diamond Industry?
Key companies in the market include Element Six UK Ltd, Zhengzhou Sino-Crystal Diamond Co Ltd, Zhongnan Diamond Co Ltd *List Not Exhaustive, ILJIN DIAMOND CO LTD, Swarovski, New Diamond Technology, Pure Grown Diamonds (PGD), Applied Diamond Inc, Henan Huanghe Whirlwind Co Ltd, Sumitomo Electric Industries Ltd, Adamas One Corp.
3. What are the main segments of the Synthetic Diamond Industry?
The market segments include Type, Manufacturing Process.
4. Can you provide details about the market size?
The market size is estimated to be USD XX Million as of 2022.
5. What are some drivers contributing to market growth?
Increasing Demand from Electronics and Semiconductors Applications; Growing Demand for Super Abrasives.
6. What are the notable trends driving market growth?
Construction Segment to Dominate the Rough Type.
7. Are there any restraints impacting market growth?
Complex Manufacturing Process.
8. Can you provide examples of recent developments in the market?
In February 2022, Element Six UK Ltd collaborated with II-VI Inc. Through this collaboration, II-VI licenses Element Six's intellectual property and necessary equipment would produce high-quality single-crystal diamonds to expand its core competency in diamond technology.
9. What pricing options are available for accessing the report?
Pricing options include single-user, multi-user, and enterprise licenses priced at USD 4750, USD 5250, and USD 8750 respectively.
10. Is the market size provided in terms of value or volume?
The market size is provided in terms of value, measured in Million.
11. Are there any specific market keywords associated with the report?
Yes, the market keyword associated with the report is "Synthetic Diamond Industry," which aids in identifying and referencing the specific market segment covered.
12. How do I determine which pricing option suits my needs best?
The pricing options vary based on user requirements and access needs. Individual users may opt for single-user licenses, while businesses requiring broader access may choose multi-user or enterprise licenses for cost-effective access to the report.
13. Are there any additional resources or data provided in the Synthetic Diamond Industry report?
While the report offers comprehensive insights, it's advisable to review the specific contents or supplementary materials provided to ascertain if additional resources or data are available.
14. How can I stay updated on further developments or reports in the Synthetic Diamond Industry?
To stay informed about further developments, trends, and reports in the Synthetic Diamond Industry, consider subscribing to industry newsletters, following relevant companies and organizations, or regularly checking reputable industry news sources and publications.
Methodology
Step 1 - Identification of Relevant Samples Size from Population Database


Step 2 - Approaches for Defining Global Market Size (Value, Volume* & Price*)

Note*: In applicable scenarios
Step 3 - Data Sources
Primary Research
- Web Analytics
- Survey Reports
- Research Institute
- Latest Research Reports
- Opinion Leaders
Secondary Research
- Annual Reports
- White Paper
- Latest Press Release
- Industry Association
- Paid Database
- Investor Presentations

Step 4 - Data Triangulation
Involves using different sources of information in order to increase the validity of a study
These sources are likely to be stakeholders in a program - participants, other researchers, program staff, other community members, and so on.
Then we put all data in single framework & apply various statistical tools to find out the dynamic on the market.
During the analysis stage, feedback from the stakeholder groups would be compared to determine areas of agreement as well as areas of divergence


