
Key Insights
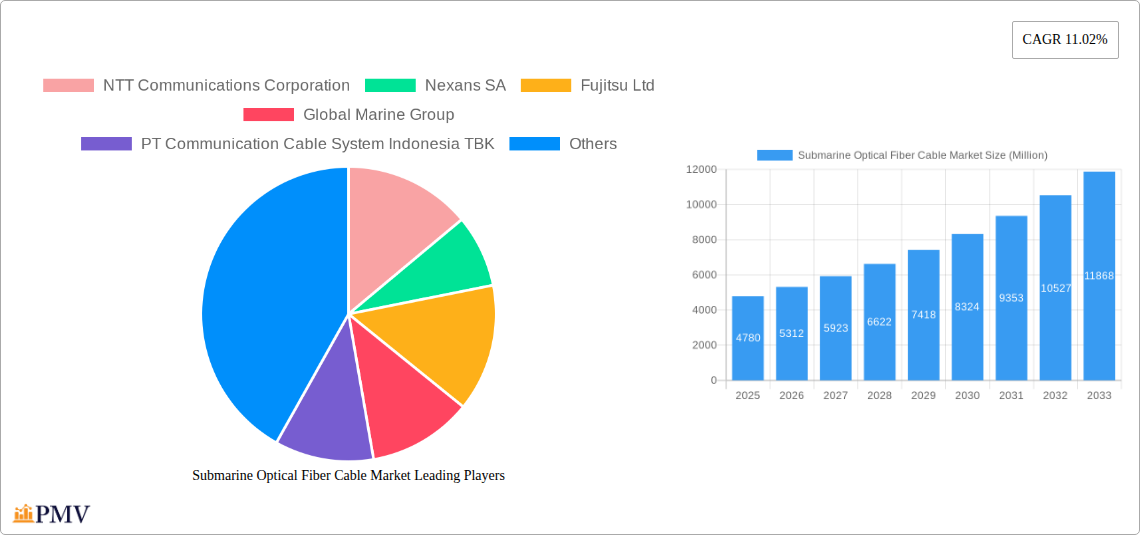
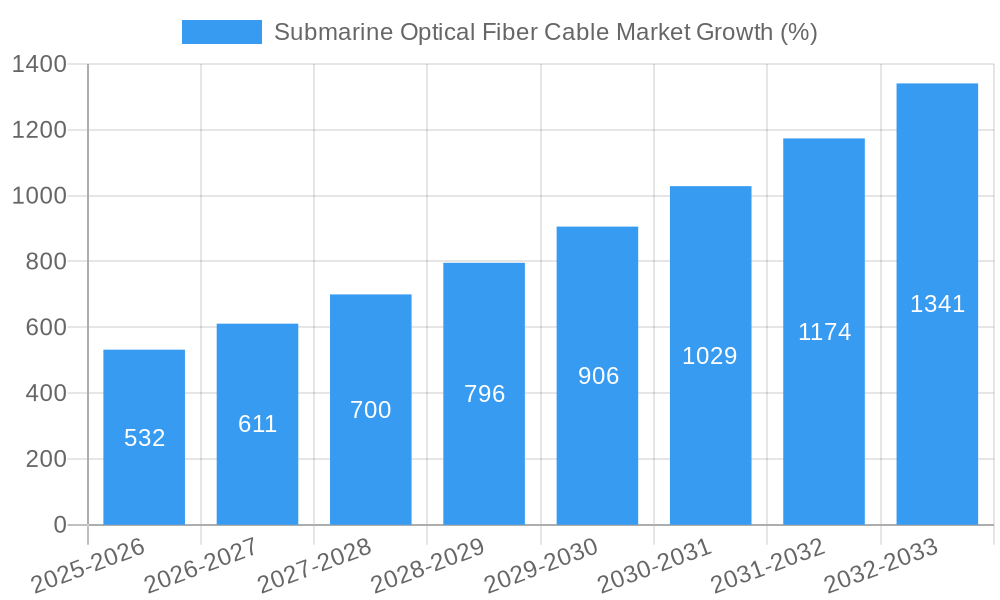
The global Submarine Optical Fiber Cable market is experiencing robust growth, projected to reach \$4.78 billion in 2025 and expand significantly over the forecast period (2025-2033). A Compound Annual Growth Rate (CAGR) of 11.02% indicates strong market momentum driven by several key factors. The increasing demand for high-speed internet connectivity, fueled by the proliferation of data-intensive applications like cloud computing, streaming services, and the Internet of Things (IoT), is a major driver. Furthermore, the expansion of renewable energy sources, particularly offshore wind farms, necessitates extensive submarine cable infrastructure for efficient energy transmission, contributing to market growth. The rising adoption of 5G networks and the need for improved international connectivity further bolster market expansion. Segmentation reveals a diversified market with single-core, multi-core, and hybrid cables catering to various telecommunications, internet connectivity, and renewable energy applications. Key players like NTT Communications, Nexans, Fujitsu, and Prysmian are actively shaping the market landscape through technological advancements and strategic partnerships. Geographical analysis shows strong growth potential across North America, Europe, and Asia-Pacific, with significant investments in infrastructure development driving market penetration in these regions. While challenges such as high installation costs and potential risks from underwater damage exist, the long-term outlook remains positive, driven by the ever-increasing global demand for high-bandwidth communication and energy transmission solutions.
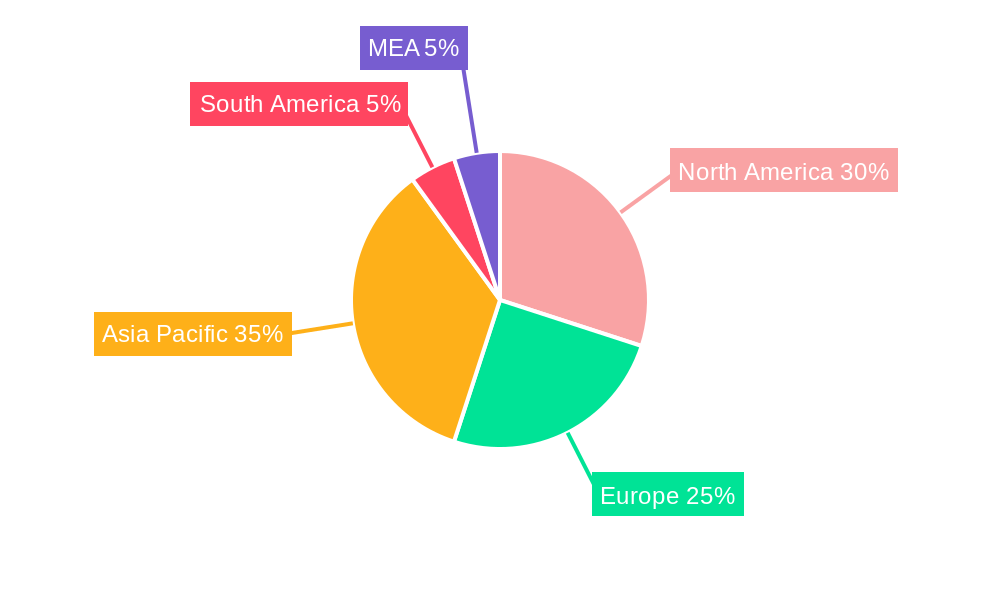
The market's regional distribution is expected to mirror existing infrastructure and economic development trends. North America and Europe are likely to maintain substantial market share, owing to well-established telecommunication networks and a high concentration of major players. However, the Asia-Pacific region is poised for significant growth, driven by rapid economic expansion and increasing internet penetration, particularly in countries like China, India, and Japan. South America and the Middle East & Africa regions also present opportunities, although they may exhibit slower growth due to factors like lower investment in infrastructure and regulatory hurdles. The market’s competitive landscape is characterized by a mix of established players and emerging companies, resulting in increased innovation and service diversification, ultimately benefiting consumers and driving further market expansion. The forecast period will likely see further consolidation and strategic alliances among key players aiming to secure market share and enhance technological capabilities.
Submarine Optical Fiber Cable Market: A Comprehensive Market Report (2019-2033)
This detailed report provides a comprehensive analysis of the Submarine Optical Fiber Cable Market, offering invaluable insights for industry stakeholders, investors, and strategic decision-makers. The study period spans from 2019 to 2033, with 2025 serving as the base and estimated year. The report meticulously examines market dynamics, competitive landscapes, technological advancements, and future growth projections, encompassing key segments and influential players. The market is projected to reach xx Million by 2033, exhibiting a CAGR of xx% during the forecast period (2025-2033).
Submarine Optical Fiber Cable Market Market Structure & Competitive Dynamics
The Submarine Optical Fiber Cable market is characterized by a moderately concentrated structure with several major players holding significant market share. The competitive landscape is dynamic, driven by ongoing technological innovations, strategic mergers and acquisitions (M&A), and evolving regulatory frameworks. Market concentration is influenced by factors like economies of scale, technological expertise, and global reach. Key players frequently engage in M&A activities to expand their market presence, enhance technological capabilities, and gain access to new markets. For instance, the value of M&A deals within the sector reached approximately xx Million in 2024.
- Market Concentration: The top 5 players collectively hold approximately xx% of the market share in 2025.
- Innovation Ecosystems: Collaborative partnerships between cable manufacturers, telecommunication companies, and research institutions drive innovation in materials science, cable design, and installation techniques.
- Regulatory Frameworks: Government policies regarding infrastructure development and data security significantly influence market growth and investment decisions.
- Product Substitutes: While submarine optical fiber cables remain the dominant technology for undersea communication, the emergence of satellite communication and other alternative technologies presents competitive pressures.
- End-User Trends: The increasing demand for high-bandwidth internet connectivity and the growth of data-intensive applications are major drivers of market expansion.
- M&A Activities: Strategic acquisitions and mergers are frequently used by major players to expand their geographic reach, acquire specialized technologies, and consolidate market share. Deals tend to range from xx Million to xx Million, depending on the size and strategic significance of the acquisition.
Submarine Optical Fiber Cable Market Industry Trends & Insights
The Submarine Optical Fiber Cable market is experiencing robust growth, fueled by several key trends. The escalating demand for high-speed internet connectivity, driven by increasing smartphone usage, video streaming, and cloud computing, is a primary growth catalyst. Technological advancements, such as the adoption of higher capacity cables and improved installation techniques, further enhance market expansion. The global shift towards digitalization and the rise of the Internet of Things (IoT) are also contributing significantly to market growth. Furthermore, investments in renewable energy infrastructure and the expanding need for reliable subsea power transmission present new growth opportunities. The market is anticipated to witness considerable disruption due to the introduction of next-generation optical fiber technologies offering increased bandwidth and capacity.
The market penetration of advanced fiber optic cables has increased steadily, with a xx% increase observed between 2024 and 2025. This growth is expected to continue at a CAGR of xx% during the forecast period. Competitive dynamics are intense, with key players engaging in price competition, technological differentiation, and strategic partnerships to maintain market share and drive growth.
Dominant Markets & Segments in Submarine Optical Fiber Cable Market
The Asia-Pacific region currently dominates the Submarine Optical Fiber Cable market, driven by substantial investments in telecommunication infrastructure, expanding internet connectivity, and rapid economic growth. Within this region, countries like China, Japan, and Singapore stand out as significant markets. The Telecommunications application segment represents the largest portion of the market due to its reliance on high-bandwidth submarine cables for global communication. Growth in this segment is closely tied to increasing internet adoption and demand for high-speed data transmission.
Key Drivers in Asia-Pacific:
- Massive investments in digital infrastructure development.
- Rapid growth of internet and mobile penetration.
- Government initiatives to promote digital economies.
- Expanding data centers and cloud computing services.
Dominance Analysis: The Asia-Pacific region accounts for approximately xx% of the global market share in 2025. The Telecommunications segment holds a xx% market share, significantly outpacing other applications. Within product types, Multi-core cables are the most dominant due to their cost-effectiveness and increased capacity.
Other Key Regional Markets: Europe and North America also show considerable market presence, with growth driven by ongoing infrastructural improvements and an increasing demand for high-speed internet. The renewable energy transmission segment is projected to witness substantial growth in the coming years, propelled by rising investments in offshore wind farms and other renewable energy projects.
Submarine Optical Fiber Cable Market Product Innovations
Significant advancements in submarine cable technology are transforming the market. Higher-capacity cables utilizing advanced modulation techniques are being developed to meet the growing demand for bandwidth. Innovative designs focusing on improved durability, reduced installation time, and enhanced resilience against natural disasters are gaining traction. The integration of advanced monitoring and maintenance systems contributes to improved cable longevity and operational efficiency. These innovations are driving the adoption of submarine cables in diverse applications, beyond traditional telecommunications, including offshore energy transmission and subsea data centers.
Report Segmentation & Scope
This report provides a detailed segmentation of the Submarine Optical Fiber Cable market based on product type and application:
Product Type:
- Single-core Cables: This segment is characterized by its simplicity and cost-effectiveness but limited capacity. The market is expected to grow at a CAGR of xx% between 2025 and 2033.
- Multi-core Cables: Offering increased bandwidth and capacity, this segment is experiencing rapid growth, projected at a CAGR of xx% during the forecast period. Competitive dynamics are intense due to ongoing innovation in fiber optic technologies.
- Hybrid Cables: Combining the advantages of single-core and multi-core cables, this segment is expected to gain significant traction in the future with a projected CAGR of xx%.
Application:
- Telecommunications: This segment remains the largest application for submarine cables, driven by an increasing demand for global communication networks. Growth is anticipated to be xx% CAGR between 2025 and 2033.
- Internet Connectivity: The explosive growth of internet usage is boosting the demand for high-bandwidth submarine cables in this segment. A CAGR of xx% is projected for the forecast period.
- Renewable Energy Transmission: This emerging segment is experiencing rapid growth as investments in offshore wind farms and other renewable energy projects increase. The forecast CAGR is xx%.
Key Drivers of Submarine Optical Fiber Cable Market Growth
The Submarine Optical Fiber Cable market is propelled by several key factors:
- Technological advancements: The development of higher-capacity cables and improved installation methods is driving market expansion.
- Increasing demand for high-speed internet: The global shift towards digitalization and the rise of data-intensive applications are fueling demand.
- Growth of cloud computing and data centers: The need for high-bandwidth connections between data centers is a major driver.
- Investments in renewable energy infrastructure: Offshore wind farms and other renewable energy projects are driving demand for subsea power transmission.
Challenges in the Submarine Optical Fiber Cable Market Sector
Several challenges hinder market growth:
- High installation costs: The cost of laying submarine cables remains a significant barrier to entry.
- Environmental concerns: The potential impact of cable installation on marine ecosystems poses a challenge.
- Geopolitical risks: Political instability and conflicts can disrupt cable installation and operations.
- Competition from alternative technologies: Satellite communication and other technologies pose a competitive threat.
Leading Players in the Submarine Optical Fiber Cable Market Market
- NTT Communications Corporation
- Nexans SA
- Fujitsu Ltd
- Global Marine Group
- PT Communication Cable System Indonesia TBK
- LS Cable & System Ltd
- HMN Technologies Co Ltd
- S B Submarine Systems Co Ltd (SBBS)
- Orange Marine
- IT International Telecom Inc
- Subcom LLC
- Alcatel Submarine Networks Ltd
- NEC Corporation
- Prysmian SPA
- Google LLC (Alphabet Inc.)
- Sumitomo Electric Industries Ltd
Key Developments in Submarine Optical Fiber Cable Market Sector
- October 2023: NEC Corporation completes the Patara-2 submarine cable system in Indonesia, enhancing connectivity across multiple islands. This 100 Gbps x 80 wavelengths x 2 fiber pairs system measures approximately 1,200 kilometers.
- September 2023: Nexans announces the construction of a third-generation cable layer vessel, set for delivery in 2026. This vessel will be equipped with three turntables, offering a 13,500-tonne loading capacity and the capability to lay up to four cables simultaneously.
Strategic Submarine Optical Fiber Cable Market Market Outlook
The future of the Submarine Optical Fiber Cable market appears bright. Continued investment in high-speed internet infrastructure, the expansion of global data centers, and the growth of offshore renewable energy projects will drive strong market growth. Strategic opportunities lie in developing advanced cable technologies, exploring new applications, and enhancing operational efficiency. The market is poised for significant expansion, presenting lucrative opportunities for innovative companies and strategic investors.
Submarine Optical Fiber Cable Market Segmentation
-
1. Product Type
- 1.1. Single-core Cables
- 1.2. Multi-core Cables
- 1.3. Hybrid Cables
-
2. Application
- 2.1. Telecommunications
- 2.2. Internet Connectivity
- 2.3. Renewable Energy Transmission
-
3. Region
- 3.1. Asia-Pacific
- 3.2. North America
- 3.3. Europe
- 3.4. Middle East and Africa
Submarine Optical Fiber Cable Market Segmentation By Geography
- 1. Asia-Pacific
- 2. North America
- 3. Europe
- 4. Middle East and Africa
Submarine Optical Fiber Cable Market REPORT HIGHLIGHTS
| Aspects | Details |
|---|---|
| Study Period | 2019-2033 |
| Base Year | 2024 |
| Estimated Year | 2025 |
| Forecast Period | 2025-2033 |
| Historical Period | 2019-2024 |
| Growth Rate | CAGR of 11.02% from 2019-2033 |
| Segmentation |
|
Table of Contents
- 1. Introduction
- 1.1. Research Scope
- 1.2. Market Segmentation
- 1.3. Research Methodology
- 1.4. Definitions and Assumptions
- 2. Executive Summary
- 2.1. Introduction
- 3. Market Dynamics
- 3.1. Introduction
- 3.2. Market Drivers
- 3.2.1. Growing Smartphone Penetration and Increasing Demand for Internet Bandwidth; Increasing Fiber Connectivity in Emerging Regions
- 3.3. Market Restrains
- 3.3.1. Inefficient Delivery Management
- 3.4. Market Trends
- 3.4.1. Growing Smartphone Penetration and Increasing Demand for Internet Bandwidth to Drive the Market
- 4. Market Factor Analysis
- 4.1. Porters Five Forces
- 4.2. Supply/Value Chain
- 4.3. PESTEL analysis
- 4.4. Market Entropy
- 4.5. Patent/Trademark Analysis
- 5. Global Submarine Optical Fiber Cable Market Analysis, Insights and Forecast, 2019-2031
- 5.1. Market Analysis, Insights and Forecast - by Product Type
- 5.1.1. Single-core Cables
- 5.1.2. Multi-core Cables
- 5.1.3. Hybrid Cables
- 5.2. Market Analysis, Insights and Forecast - by Application
- 5.2.1. Telecommunications
- 5.2.2. Internet Connectivity
- 5.2.3. Renewable Energy Transmission
- 5.3. Market Analysis, Insights and Forecast - by Region
- 5.3.1. Asia-Pacific
- 5.3.2. North America
- 5.3.3. Europe
- 5.3.4. Middle East and Africa
- 5.4. Market Analysis, Insights and Forecast - by Region
- 5.4.1. Asia-Pacific
- 5.4.2. North America
- 5.4.3. Europe
- 5.4.4. Middle East and Africa
- 5.1. Market Analysis, Insights and Forecast - by Product Type
- 6. Asia-Pacific Submarine Optical Fiber Cable Market Analysis, Insights and Forecast, 2019-2031
- 6.1. Market Analysis, Insights and Forecast - by Product Type
- 6.1.1. Single-core Cables
- 6.1.2. Multi-core Cables
- 6.1.3. Hybrid Cables
- 6.2. Market Analysis, Insights and Forecast - by Application
- 6.2.1. Telecommunications
- 6.2.2. Internet Connectivity
- 6.2.3. Renewable Energy Transmission
- 6.3. Market Analysis, Insights and Forecast - by Region
- 6.3.1. Asia-Pacific
- 6.3.2. North America
- 6.3.3. Europe
- 6.3.4. Middle East and Africa
- 6.1. Market Analysis, Insights and Forecast - by Product Type
- 7. North America Submarine Optical Fiber Cable Market Analysis, Insights and Forecast, 2019-2031
- 7.1. Market Analysis, Insights and Forecast - by Product Type
- 7.1.1. Single-core Cables
- 7.1.2. Multi-core Cables
- 7.1.3. Hybrid Cables
- 7.2. Market Analysis, Insights and Forecast - by Application
- 7.2.1. Telecommunications
- 7.2.2. Internet Connectivity
- 7.2.3. Renewable Energy Transmission
- 7.3. Market Analysis, Insights and Forecast - by Region
- 7.3.1. Asia-Pacific
- 7.3.2. North America
- 7.3.3. Europe
- 7.3.4. Middle East and Africa
- 7.1. Market Analysis, Insights and Forecast - by Product Type
- 8. Europe Submarine Optical Fiber Cable Market Analysis, Insights and Forecast, 2019-2031
- 8.1. Market Analysis, Insights and Forecast - by Product Type
- 8.1.1. Single-core Cables
- 8.1.2. Multi-core Cables
- 8.1.3. Hybrid Cables
- 8.2. Market Analysis, Insights and Forecast - by Application
- 8.2.1. Telecommunications
- 8.2.2. Internet Connectivity
- 8.2.3. Renewable Energy Transmission
- 8.3. Market Analysis, Insights and Forecast - by Region
- 8.3.1. Asia-Pacific
- 8.3.2. North America
- 8.3.3. Europe
- 8.3.4. Middle East and Africa
- 8.1. Market Analysis, Insights and Forecast - by Product Type
- 9. Middle East and Africa Submarine Optical Fiber Cable Market Analysis, Insights and Forecast, 2019-2031
- 9.1. Market Analysis, Insights and Forecast - by Product Type
- 9.1.1. Single-core Cables
- 9.1.2. Multi-core Cables
- 9.1.3. Hybrid Cables
- 9.2. Market Analysis, Insights and Forecast - by Application
- 9.2.1. Telecommunications
- 9.2.2. Internet Connectivity
- 9.2.3. Renewable Energy Transmission
- 9.3. Market Analysis, Insights and Forecast - by Region
- 9.3.1. Asia-Pacific
- 9.3.2. North America
- 9.3.3. Europe
- 9.3.4. Middle East and Africa
- 9.1. Market Analysis, Insights and Forecast - by Product Type
- 10. North America Submarine Optical Fiber Cable Market Analysis, Insights and Forecast, 2019-2031
- 10.1. Market Analysis, Insights and Forecast - By Country/Sub-region
- 10.1.1 United States
- 10.1.2 Canada
- 10.1.3 Mexico
- 11. Europe Submarine Optical Fiber Cable Market Analysis, Insights and Forecast, 2019-2031
- 11.1. Market Analysis, Insights and Forecast - By Country/Sub-region
- 11.1.1 Germany
- 11.1.2 United Kingdom
- 11.1.3 France
- 11.1.4 Spain
- 11.1.5 Italy
- 11.1.6 Spain
- 11.1.7 Belgium
- 11.1.8 Netherland
- 11.1.9 Nordics
- 11.1.10 Rest of Europe
- 12. Asia Pacific Submarine Optical Fiber Cable Market Analysis, Insights and Forecast, 2019-2031
- 12.1. Market Analysis, Insights and Forecast - By Country/Sub-region
- 12.1.1 China
- 12.1.2 Japan
- 12.1.3 India
- 12.1.4 South Korea
- 12.1.5 Southeast Asia
- 12.1.6 Australia
- 12.1.7 Indonesia
- 12.1.8 Phillipes
- 12.1.9 Singapore
- 12.1.10 Thailandc
- 12.1.11 Rest of Asia Pacific
- 13. South America Submarine Optical Fiber Cable Market Analysis, Insights and Forecast, 2019-2031
- 13.1. Market Analysis, Insights and Forecast - By Country/Sub-region
- 13.1.1 Brazil
- 13.1.2 Argentina
- 13.1.3 Peru
- 13.1.4 Chile
- 13.1.5 Colombia
- 13.1.6 Ecuador
- 13.1.7 Venezuela
- 13.1.8 Rest of South America
- 14. MEA Submarine Optical Fiber Cable Market Analysis, Insights and Forecast, 2019-2031
- 14.1. Market Analysis, Insights and Forecast - By Country/Sub-region
- 14.1.1 United Arab Emirates
- 14.1.2 Saudi Arabia
- 14.1.3 South Africa
- 14.1.4 Rest of Middle East and Africa
- 15. Competitive Analysis
- 15.1. Global Market Share Analysis 2024
- 15.2. Company Profiles
- 15.2.1 NTT Communications Corporation
- 15.2.1.1. Overview
- 15.2.1.2. Products
- 15.2.1.3. SWOT Analysis
- 15.2.1.4. Recent Developments
- 15.2.1.5. Financials (Based on Availability)
- 15.2.2 Nexans SA
- 15.2.2.1. Overview
- 15.2.2.2. Products
- 15.2.2.3. SWOT Analysis
- 15.2.2.4. Recent Developments
- 15.2.2.5. Financials (Based on Availability)
- 15.2.3 Fujitsu Ltd
- 15.2.3.1. Overview
- 15.2.3.2. Products
- 15.2.3.3. SWOT Analysis
- 15.2.3.4. Recent Developments
- 15.2.3.5. Financials (Based on Availability)
- 15.2.4 Global Marine Group
- 15.2.4.1. Overview
- 15.2.4.2. Products
- 15.2.4.3. SWOT Analysis
- 15.2.4.4. Recent Developments
- 15.2.4.5. Financials (Based on Availability)
- 15.2.5 PT Communication Cable System Indonesia TBK
- 15.2.5.1. Overview
- 15.2.5.2. Products
- 15.2.5.3. SWOT Analysis
- 15.2.5.4. Recent Developments
- 15.2.5.5. Financials (Based on Availability)
- 15.2.6 Pt Communication Cable System Indonesia TBK
- 15.2.6.1. Overview
- 15.2.6.2. Products
- 15.2.6.3. SWOT Analysis
- 15.2.6.4. Recent Developments
- 15.2.6.5. Financials (Based on Availability)
- 15.2.7 LS Cable & System Ltd
- 15.2.7.1. Overview
- 15.2.7.2. Products
- 15.2.7.3. SWOT Analysis
- 15.2.7.4. Recent Developments
- 15.2.7.5. Financials (Based on Availability)
- 15.2.8 HMN Technologies Co Ltd
- 15.2.8.1. Overview
- 15.2.8.2. Products
- 15.2.8.3. SWOT Analysis
- 15.2.8.4. Recent Developments
- 15.2.8.5. Financials (Based on Availability)
- 15.2.9 S B Submarine Systems Co Ltd (SBBS)
- 15.2.9.1. Overview
- 15.2.9.2. Products
- 15.2.9.3. SWOT Analysis
- 15.2.9.4. Recent Developments
- 15.2.9.5. Financials (Based on Availability)
- 15.2.10 Orange Marine
- 15.2.10.1. Overview
- 15.2.10.2. Products
- 15.2.10.3. SWOT Analysis
- 15.2.10.4. Recent Developments
- 15.2.10.5. Financials (Based on Availability)
- 15.2.11 IT International Telecom Inc
- 15.2.11.1. Overview
- 15.2.11.2. Products
- 15.2.11.3. SWOT Analysis
- 15.2.11.4. Recent Developments
- 15.2.11.5. Financials (Based on Availability)
- 15.2.12 Subcom LLC
- 15.2.12.1. Overview
- 15.2.12.2. Products
- 15.2.12.3. SWOT Analysis
- 15.2.12.4. Recent Developments
- 15.2.12.5. Financials (Based on Availability)
- 15.2.13 Alcatel Submarine Networks Ltd
- 15.2.13.1. Overview
- 15.2.13.2. Products
- 15.2.13.3. SWOT Analysis
- 15.2.13.4. Recent Developments
- 15.2.13.5. Financials (Based on Availability)
- 15.2.14 NEC Corporation
- 15.2.14.1. Overview
- 15.2.14.2. Products
- 15.2.14.3. SWOT Analysis
- 15.2.14.4. Recent Developments
- 15.2.14.5. Financials (Based on Availability)
- 15.2.15 Prysmian SPA
- 15.2.15.1. Overview
- 15.2.15.2. Products
- 15.2.15.3. SWOT Analysis
- 15.2.15.4. Recent Developments
- 15.2.15.5. Financials (Based on Availability)
- 15.2.16 Google LLC (Alphabet Inc
- 15.2.16.1. Overview
- 15.2.16.2. Products
- 15.2.16.3. SWOT Analysis
- 15.2.16.4. Recent Developments
- 15.2.16.5. Financials (Based on Availability)
- 15.2.17 Sumitomo Electric Industries Ltd
- 15.2.17.1. Overview
- 15.2.17.2. Products
- 15.2.17.3. SWOT Analysis
- 15.2.17.4. Recent Developments
- 15.2.17.5. Financials (Based on Availability)
- 15.2.1 NTT Communications Corporation
List of Figures
- Figure 1: Global Submarine Optical Fiber Cable Market Revenue Breakdown (Million, %) by Region 2024 & 2032
- Figure 2: Global Submarine Optical Fiber Cable Market Volume Breakdown (K Unit, %) by Region 2024 & 2032
- Figure 3: North America Submarine Optical Fiber Cable Market Revenue (Million), by Country 2024 & 2032
- Figure 4: North America Submarine Optical Fiber Cable Market Volume (K Unit), by Country 2024 & 2032
- Figure 5: North America Submarine Optical Fiber Cable Market Revenue Share (%), by Country 2024 & 2032
- Figure 6: North America Submarine Optical Fiber Cable Market Volume Share (%), by Country 2024 & 2032
- Figure 7: Europe Submarine Optical Fiber Cable Market Revenue (Million), by Country 2024 & 2032
- Figure 8: Europe Submarine Optical Fiber Cable Market Volume (K Unit), by Country 2024 & 2032
- Figure 9: Europe Submarine Optical Fiber Cable Market Revenue Share (%), by Country 2024 & 2032
- Figure 10: Europe Submarine Optical Fiber Cable Market Volume Share (%), by Country 2024 & 2032
- Figure 11: Asia Pacific Submarine Optical Fiber Cable Market Revenue (Million), by Country 2024 & 2032
- Figure 12: Asia Pacific Submarine Optical Fiber Cable Market Volume (K Unit), by Country 2024 & 2032
- Figure 13: Asia Pacific Submarine Optical Fiber Cable Market Revenue Share (%), by Country 2024 & 2032
- Figure 14: Asia Pacific Submarine Optical Fiber Cable Market Volume Share (%), by Country 2024 & 2032
- Figure 15: South America Submarine Optical Fiber Cable Market Revenue (Million), by Country 2024 & 2032
- Figure 16: South America Submarine Optical Fiber Cable Market Volume (K Unit), by Country 2024 & 2032
- Figure 17: South America Submarine Optical Fiber Cable Market Revenue Share (%), by Country 2024 & 2032
- Figure 18: South America Submarine Optical Fiber Cable Market Volume Share (%), by Country 2024 & 2032
- Figure 19: MEA Submarine Optical Fiber Cable Market Revenue (Million), by Country 2024 & 2032
- Figure 20: MEA Submarine Optical Fiber Cable Market Volume (K Unit), by Country 2024 & 2032
- Figure 21: MEA Submarine Optical Fiber Cable Market Revenue Share (%), by Country 2024 & 2032
- Figure 22: MEA Submarine Optical Fiber Cable Market Volume Share (%), by Country 2024 & 2032
- Figure 23: Asia-Pacific Submarine Optical Fiber Cable Market Revenue (Million), by Product Type 2024 & 2032
- Figure 24: Asia-Pacific Submarine Optical Fiber Cable Market Volume (K Unit), by Product Type 2024 & 2032
- Figure 25: Asia-Pacific Submarine Optical Fiber Cable Market Revenue Share (%), by Product Type 2024 & 2032
- Figure 26: Asia-Pacific Submarine Optical Fiber Cable Market Volume Share (%), by Product Type 2024 & 2032
- Figure 27: Asia-Pacific Submarine Optical Fiber Cable Market Revenue (Million), by Application 2024 & 2032
- Figure 28: Asia-Pacific Submarine Optical Fiber Cable Market Volume (K Unit), by Application 2024 & 2032
- Figure 29: Asia-Pacific Submarine Optical Fiber Cable Market Revenue Share (%), by Application 2024 & 2032
- Figure 30: Asia-Pacific Submarine Optical Fiber Cable Market Volume Share (%), by Application 2024 & 2032
- Figure 31: Asia-Pacific Submarine Optical Fiber Cable Market Revenue (Million), by Region 2024 & 2032
- Figure 32: Asia-Pacific Submarine Optical Fiber Cable Market Volume (K Unit), by Region 2024 & 2032
- Figure 33: Asia-Pacific Submarine Optical Fiber Cable Market Revenue Share (%), by Region 2024 & 2032
- Figure 34: Asia-Pacific Submarine Optical Fiber Cable Market Volume Share (%), by Region 2024 & 2032
- Figure 35: Asia-Pacific Submarine Optical Fiber Cable Market Revenue (Million), by Country 2024 & 2032
- Figure 36: Asia-Pacific Submarine Optical Fiber Cable Market Volume (K Unit), by Country 2024 & 2032
- Figure 37: Asia-Pacific Submarine Optical Fiber Cable Market Revenue Share (%), by Country 2024 & 2032
- Figure 38: Asia-Pacific Submarine Optical Fiber Cable Market Volume Share (%), by Country 2024 & 2032
- Figure 39: North America Submarine Optical Fiber Cable Market Revenue (Million), by Product Type 2024 & 2032
- Figure 40: North America Submarine Optical Fiber Cable Market Volume (K Unit), by Product Type 2024 & 2032
- Figure 41: North America Submarine Optical Fiber Cable Market Revenue Share (%), by Product Type 2024 & 2032
- Figure 42: North America Submarine Optical Fiber Cable Market Volume Share (%), by Product Type 2024 & 2032
- Figure 43: North America Submarine Optical Fiber Cable Market Revenue (Million), by Application 2024 & 2032
- Figure 44: North America Submarine Optical Fiber Cable Market Volume (K Unit), by Application 2024 & 2032
- Figure 45: North America Submarine Optical Fiber Cable Market Revenue Share (%), by Application 2024 & 2032
- Figure 46: North America Submarine Optical Fiber Cable Market Volume Share (%), by Application 2024 & 2032
- Figure 47: North America Submarine Optical Fiber Cable Market Revenue (Million), by Region 2024 & 2032
- Figure 48: North America Submarine Optical Fiber Cable Market Volume (K Unit), by Region 2024 & 2032
- Figure 49: North America Submarine Optical Fiber Cable Market Revenue Share (%), by Region 2024 & 2032
- Figure 50: North America Submarine Optical Fiber Cable Market Volume Share (%), by Region 2024 & 2032
- Figure 51: North America Submarine Optical Fiber Cable Market Revenue (Million), by Country 2024 & 2032
- Figure 52: North America Submarine Optical Fiber Cable Market Volume (K Unit), by Country 2024 & 2032
- Figure 53: North America Submarine Optical Fiber Cable Market Revenue Share (%), by Country 2024 & 2032
- Figure 54: North America Submarine Optical Fiber Cable Market Volume Share (%), by Country 2024 & 2032
- Figure 55: Europe Submarine Optical Fiber Cable Market Revenue (Million), by Product Type 2024 & 2032
- Figure 56: Europe Submarine Optical Fiber Cable Market Volume (K Unit), by Product Type 2024 & 2032
- Figure 57: Europe Submarine Optical Fiber Cable Market Revenue Share (%), by Product Type 2024 & 2032
- Figure 58: Europe Submarine Optical Fiber Cable Market Volume Share (%), by Product Type 2024 & 2032
- Figure 59: Europe Submarine Optical Fiber Cable Market Revenue (Million), by Application 2024 & 2032
- Figure 60: Europe Submarine Optical Fiber Cable Market Volume (K Unit), by Application 2024 & 2032
- Figure 61: Europe Submarine Optical Fiber Cable Market Revenue Share (%), by Application 2024 & 2032
- Figure 62: Europe Submarine Optical Fiber Cable Market Volume Share (%), by Application 2024 & 2032
- Figure 63: Europe Submarine Optical Fiber Cable Market Revenue (Million), by Region 2024 & 2032
- Figure 64: Europe Submarine Optical Fiber Cable Market Volume (K Unit), by Region 2024 & 2032
- Figure 65: Europe Submarine Optical Fiber Cable Market Revenue Share (%), by Region 2024 & 2032
- Figure 66: Europe Submarine Optical Fiber Cable Market Volume Share (%), by Region 2024 & 2032
- Figure 67: Europe Submarine Optical Fiber Cable Market Revenue (Million), by Country 2024 & 2032
- Figure 68: Europe Submarine Optical Fiber Cable Market Volume (K Unit), by Country 2024 & 2032
- Figure 69: Europe Submarine Optical Fiber Cable Market Revenue Share (%), by Country 2024 & 2032
- Figure 70: Europe Submarine Optical Fiber Cable Market Volume Share (%), by Country 2024 & 2032
- Figure 71: Middle East and Africa Submarine Optical Fiber Cable Market Revenue (Million), by Product Type 2024 & 2032
- Figure 72: Middle East and Africa Submarine Optical Fiber Cable Market Volume (K Unit), by Product Type 2024 & 2032
- Figure 73: Middle East and Africa Submarine Optical Fiber Cable Market Revenue Share (%), by Product Type 2024 & 2032
- Figure 74: Middle East and Africa Submarine Optical Fiber Cable Market Volume Share (%), by Product Type 2024 & 2032
- Figure 75: Middle East and Africa Submarine Optical Fiber Cable Market Revenue (Million), by Application 2024 & 2032
- Figure 76: Middle East and Africa Submarine Optical Fiber Cable Market Volume (K Unit), by Application 2024 & 2032
- Figure 77: Middle East and Africa Submarine Optical Fiber Cable Market Revenue Share (%), by Application 2024 & 2032
- Figure 78: Middle East and Africa Submarine Optical Fiber Cable Market Volume Share (%), by Application 2024 & 2032
- Figure 79: Middle East and Africa Submarine Optical Fiber Cable Market Revenue (Million), by Region 2024 & 2032
- Figure 80: Middle East and Africa Submarine Optical Fiber Cable Market Volume (K Unit), by Region 2024 & 2032
- Figure 81: Middle East and Africa Submarine Optical Fiber Cable Market Revenue Share (%), by Region 2024 & 2032
- Figure 82: Middle East and Africa Submarine Optical Fiber Cable Market Volume Share (%), by Region 2024 & 2032
- Figure 83: Middle East and Africa Submarine Optical Fiber Cable Market Revenue (Million), by Country 2024 & 2032
- Figure 84: Middle East and Africa Submarine Optical Fiber Cable Market Volume (K Unit), by Country 2024 & 2032
- Figure 85: Middle East and Africa Submarine Optical Fiber Cable Market Revenue Share (%), by Country 2024 & 2032
- Figure 86: Middle East and Africa Submarine Optical Fiber Cable Market Volume Share (%), by Country 2024 & 2032
List of Tables
- Table 1: Global Submarine Optical Fiber Cable Market Revenue Million Forecast, by Region 2019 & 2032
- Table 2: Global Submarine Optical Fiber Cable Market Volume K Unit Forecast, by Region 2019 & 2032
- Table 3: Global Submarine Optical Fiber Cable Market Revenue Million Forecast, by Product Type 2019 & 2032
- Table 4: Global Submarine Optical Fiber Cable Market Volume K Unit Forecast, by Product Type 2019 & 2032
- Table 5: Global Submarine Optical Fiber Cable Market Revenue Million Forecast, by Application 2019 & 2032
- Table 6: Global Submarine Optical Fiber Cable Market Volume K Unit Forecast, by Application 2019 & 2032
- Table 7: Global Submarine Optical Fiber Cable Market Revenue Million Forecast, by Region 2019 & 2032
- Table 8: Global Submarine Optical Fiber Cable Market Volume K Unit Forecast, by Region 2019 & 2032
- Table 9: Global Submarine Optical Fiber Cable Market Revenue Million Forecast, by Region 2019 & 2032
- Table 10: Global Submarine Optical Fiber Cable Market Volume K Unit Forecast, by Region 2019 & 2032
- Table 11: Global Submarine Optical Fiber Cable Market Revenue Million Forecast, by Country 2019 & 2032
- Table 12: Global Submarine Optical Fiber Cable Market Volume K Unit Forecast, by Country 2019 & 2032
- Table 13: United States Submarine Optical Fiber Cable Market Revenue (Million) Forecast, by Application 2019 & 2032
- Table 14: United States Submarine Optical Fiber Cable Market Volume (K Unit) Forecast, by Application 2019 & 2032
- Table 15: Canada Submarine Optical Fiber Cable Market Revenue (Million) Forecast, by Application 2019 & 2032
- Table 16: Canada Submarine Optical Fiber Cable Market Volume (K Unit) Forecast, by Application 2019 & 2032
- Table 17: Mexico Submarine Optical Fiber Cable Market Revenue (Million) Forecast, by Application 2019 & 2032
- Table 18: Mexico Submarine Optical Fiber Cable Market Volume (K Unit) Forecast, by Application 2019 & 2032
- Table 19: Global Submarine Optical Fiber Cable Market Revenue Million Forecast, by Country 2019 & 2032
- Table 20: Global Submarine Optical Fiber Cable Market Volume K Unit Forecast, by Country 2019 & 2032
- Table 21: Germany Submarine Optical Fiber Cable Market Revenue (Million) Forecast, by Application 2019 & 2032
- Table 22: Germany Submarine Optical Fiber Cable Market Volume (K Unit) Forecast, by Application 2019 & 2032
- Table 23: United Kingdom Submarine Optical Fiber Cable Market Revenue (Million) Forecast, by Application 2019 & 2032
- Table 24: United Kingdom Submarine Optical Fiber Cable Market Volume (K Unit) Forecast, by Application 2019 & 2032
- Table 25: France Submarine Optical Fiber Cable Market Revenue (Million) Forecast, by Application 2019 & 2032
- Table 26: France Submarine Optical Fiber Cable Market Volume (K Unit) Forecast, by Application 2019 & 2032
- Table 27: Spain Submarine Optical Fiber Cable Market Revenue (Million) Forecast, by Application 2019 & 2032
- Table 28: Spain Submarine Optical Fiber Cable Market Volume (K Unit) Forecast, by Application 2019 & 2032
- Table 29: Italy Submarine Optical Fiber Cable Market Revenue (Million) Forecast, by Application 2019 & 2032
- Table 30: Italy Submarine Optical Fiber Cable Market Volume (K Unit) Forecast, by Application 2019 & 2032
- Table 31: Spain Submarine Optical Fiber Cable Market Revenue (Million) Forecast, by Application 2019 & 2032
- Table 32: Spain Submarine Optical Fiber Cable Market Volume (K Unit) Forecast, by Application 2019 & 2032
- Table 33: Belgium Submarine Optical Fiber Cable Market Revenue (Million) Forecast, by Application 2019 & 2032
- Table 34: Belgium Submarine Optical Fiber Cable Market Volume (K Unit) Forecast, by Application 2019 & 2032
- Table 35: Netherland Submarine Optical Fiber Cable Market Revenue (Million) Forecast, by Application 2019 & 2032
- Table 36: Netherland Submarine Optical Fiber Cable Market Volume (K Unit) Forecast, by Application 2019 & 2032
- Table 37: Nordics Submarine Optical Fiber Cable Market Revenue (Million) Forecast, by Application 2019 & 2032
- Table 38: Nordics Submarine Optical Fiber Cable Market Volume (K Unit) Forecast, by Application 2019 & 2032
- Table 39: Rest of Europe Submarine Optical Fiber Cable Market Revenue (Million) Forecast, by Application 2019 & 2032
- Table 40: Rest of Europe Submarine Optical Fiber Cable Market Volume (K Unit) Forecast, by Application 2019 & 2032
- Table 41: Global Submarine Optical Fiber Cable Market Revenue Million Forecast, by Country 2019 & 2032
- Table 42: Global Submarine Optical Fiber Cable Market Volume K Unit Forecast, by Country 2019 & 2032
- Table 43: China Submarine Optical Fiber Cable Market Revenue (Million) Forecast, by Application 2019 & 2032
- Table 44: China Submarine Optical Fiber Cable Market Volume (K Unit) Forecast, by Application 2019 & 2032
- Table 45: Japan Submarine Optical Fiber Cable Market Revenue (Million) Forecast, by Application 2019 & 2032
- Table 46: Japan Submarine Optical Fiber Cable Market Volume (K Unit) Forecast, by Application 2019 & 2032
- Table 47: India Submarine Optical Fiber Cable Market Revenue (Million) Forecast, by Application 2019 & 2032
- Table 48: India Submarine Optical Fiber Cable Market Volume (K Unit) Forecast, by Application 2019 & 2032
- Table 49: South Korea Submarine Optical Fiber Cable Market Revenue (Million) Forecast, by Application 2019 & 2032
- Table 50: South Korea Submarine Optical Fiber Cable Market Volume (K Unit) Forecast, by Application 2019 & 2032
- Table 51: Southeast Asia Submarine Optical Fiber Cable Market Revenue (Million) Forecast, by Application 2019 & 2032
- Table 52: Southeast Asia Submarine Optical Fiber Cable Market Volume (K Unit) Forecast, by Application 2019 & 2032
- Table 53: Australia Submarine Optical Fiber Cable Market Revenue (Million) Forecast, by Application 2019 & 2032
- Table 54: Australia Submarine Optical Fiber Cable Market Volume (K Unit) Forecast, by Application 2019 & 2032
- Table 55: Indonesia Submarine Optical Fiber Cable Market Revenue (Million) Forecast, by Application 2019 & 2032
- Table 56: Indonesia Submarine Optical Fiber Cable Market Volume (K Unit) Forecast, by Application 2019 & 2032
- Table 57: Phillipes Submarine Optical Fiber Cable Market Revenue (Million) Forecast, by Application 2019 & 2032
- Table 58: Phillipes Submarine Optical Fiber Cable Market Volume (K Unit) Forecast, by Application 2019 & 2032
- Table 59: Singapore Submarine Optical Fiber Cable Market Revenue (Million) Forecast, by Application 2019 & 2032
- Table 60: Singapore Submarine Optical Fiber Cable Market Volume (K Unit) Forecast, by Application 2019 & 2032
- Table 61: Thailandc Submarine Optical Fiber Cable Market Revenue (Million) Forecast, by Application 2019 & 2032
- Table 62: Thailandc Submarine Optical Fiber Cable Market Volume (K Unit) Forecast, by Application 2019 & 2032
- Table 63: Rest of Asia Pacific Submarine Optical Fiber Cable Market Revenue (Million) Forecast, by Application 2019 & 2032
- Table 64: Rest of Asia Pacific Submarine Optical Fiber Cable Market Volume (K Unit) Forecast, by Application 2019 & 2032
- Table 65: Global Submarine Optical Fiber Cable Market Revenue Million Forecast, by Country 2019 & 2032
- Table 66: Global Submarine Optical Fiber Cable Market Volume K Unit Forecast, by Country 2019 & 2032
- Table 67: Brazil Submarine Optical Fiber Cable Market Revenue (Million) Forecast, by Application 2019 & 2032
- Table 68: Brazil Submarine Optical Fiber Cable Market Volume (K Unit) Forecast, by Application 2019 & 2032
- Table 69: Argentina Submarine Optical Fiber Cable Market Revenue (Million) Forecast, by Application 2019 & 2032
- Table 70: Argentina Submarine Optical Fiber Cable Market Volume (K Unit) Forecast, by Application 2019 & 2032
- Table 71: Peru Submarine Optical Fiber Cable Market Revenue (Million) Forecast, by Application 2019 & 2032
- Table 72: Peru Submarine Optical Fiber Cable Market Volume (K Unit) Forecast, by Application 2019 & 2032
- Table 73: Chile Submarine Optical Fiber Cable Market Revenue (Million) Forecast, by Application 2019 & 2032
- Table 74: Chile Submarine Optical Fiber Cable Market Volume (K Unit) Forecast, by Application 2019 & 2032
- Table 75: Colombia Submarine Optical Fiber Cable Market Revenue (Million) Forecast, by Application 2019 & 2032
- Table 76: Colombia Submarine Optical Fiber Cable Market Volume (K Unit) Forecast, by Application 2019 & 2032
- Table 77: Ecuador Submarine Optical Fiber Cable Market Revenue (Million) Forecast, by Application 2019 & 2032
- Table 78: Ecuador Submarine Optical Fiber Cable Market Volume (K Unit) Forecast, by Application 2019 & 2032
- Table 79: Venezuela Submarine Optical Fiber Cable Market Revenue (Million) Forecast, by Application 2019 & 2032
- Table 80: Venezuela Submarine Optical Fiber Cable Market Volume (K Unit) Forecast, by Application 2019 & 2032
- Table 81: Rest of South America Submarine Optical Fiber Cable Market Revenue (Million) Forecast, by Application 2019 & 2032
- Table 82: Rest of South America Submarine Optical Fiber Cable Market Volume (K Unit) Forecast, by Application 2019 & 2032
- Table 83: Global Submarine Optical Fiber Cable Market Revenue Million Forecast, by Country 2019 & 2032
- Table 84: Global Submarine Optical Fiber Cable Market Volume K Unit Forecast, by Country 2019 & 2032
- Table 85: United Arab Emirates Submarine Optical Fiber Cable Market Revenue (Million) Forecast, by Application 2019 & 2032
- Table 86: United Arab Emirates Submarine Optical Fiber Cable Market Volume (K Unit) Forecast, by Application 2019 & 2032
- Table 87: Saudi Arabia Submarine Optical Fiber Cable Market Revenue (Million) Forecast, by Application 2019 & 2032
- Table 88: Saudi Arabia Submarine Optical Fiber Cable Market Volume (K Unit) Forecast, by Application 2019 & 2032
- Table 89: South Africa Submarine Optical Fiber Cable Market Revenue (Million) Forecast, by Application 2019 & 2032
- Table 90: South Africa Submarine Optical Fiber Cable Market Volume (K Unit) Forecast, by Application 2019 & 2032
- Table 91: Rest of Middle East and Africa Submarine Optical Fiber Cable Market Revenue (Million) Forecast, by Application 2019 & 2032
- Table 92: Rest of Middle East and Africa Submarine Optical Fiber Cable Market Volume (K Unit) Forecast, by Application 2019 & 2032
- Table 93: Global Submarine Optical Fiber Cable Market Revenue Million Forecast, by Product Type 2019 & 2032
- Table 94: Global Submarine Optical Fiber Cable Market Volume K Unit Forecast, by Product Type 2019 & 2032
- Table 95: Global Submarine Optical Fiber Cable Market Revenue Million Forecast, by Application 2019 & 2032
- Table 96: Global Submarine Optical Fiber Cable Market Volume K Unit Forecast, by Application 2019 & 2032
- Table 97: Global Submarine Optical Fiber Cable Market Revenue Million Forecast, by Region 2019 & 2032
- Table 98: Global Submarine Optical Fiber Cable Market Volume K Unit Forecast, by Region 2019 & 2032
- Table 99: Global Submarine Optical Fiber Cable Market Revenue Million Forecast, by Country 2019 & 2032
- Table 100: Global Submarine Optical Fiber Cable Market Volume K Unit Forecast, by Country 2019 & 2032
- Table 101: Global Submarine Optical Fiber Cable Market Revenue Million Forecast, by Product Type 2019 & 2032
- Table 102: Global Submarine Optical Fiber Cable Market Volume K Unit Forecast, by Product Type 2019 & 2032
- Table 103: Global Submarine Optical Fiber Cable Market Revenue Million Forecast, by Application 2019 & 2032
- Table 104: Global Submarine Optical Fiber Cable Market Volume K Unit Forecast, by Application 2019 & 2032
- Table 105: Global Submarine Optical Fiber Cable Market Revenue Million Forecast, by Region 2019 & 2032
- Table 106: Global Submarine Optical Fiber Cable Market Volume K Unit Forecast, by Region 2019 & 2032
- Table 107: Global Submarine Optical Fiber Cable Market Revenue Million Forecast, by Country 2019 & 2032
- Table 108: Global Submarine Optical Fiber Cable Market Volume K Unit Forecast, by Country 2019 & 2032
- Table 109: Global Submarine Optical Fiber Cable Market Revenue Million Forecast, by Product Type 2019 & 2032
- Table 110: Global Submarine Optical Fiber Cable Market Volume K Unit Forecast, by Product Type 2019 & 2032
- Table 111: Global Submarine Optical Fiber Cable Market Revenue Million Forecast, by Application 2019 & 2032
- Table 112: Global Submarine Optical Fiber Cable Market Volume K Unit Forecast, by Application 2019 & 2032
- Table 113: Global Submarine Optical Fiber Cable Market Revenue Million Forecast, by Region 2019 & 2032
- Table 114: Global Submarine Optical Fiber Cable Market Volume K Unit Forecast, by Region 2019 & 2032
- Table 115: Global Submarine Optical Fiber Cable Market Revenue Million Forecast, by Country 2019 & 2032
- Table 116: Global Submarine Optical Fiber Cable Market Volume K Unit Forecast, by Country 2019 & 2032
- Table 117: Global Submarine Optical Fiber Cable Market Revenue Million Forecast, by Product Type 2019 & 2032
- Table 118: Global Submarine Optical Fiber Cable Market Volume K Unit Forecast, by Product Type 2019 & 2032
- Table 119: Global Submarine Optical Fiber Cable Market Revenue Million Forecast, by Application 2019 & 2032
- Table 120: Global Submarine Optical Fiber Cable Market Volume K Unit Forecast, by Application 2019 & 2032
- Table 121: Global Submarine Optical Fiber Cable Market Revenue Million Forecast, by Region 2019 & 2032
- Table 122: Global Submarine Optical Fiber Cable Market Volume K Unit Forecast, by Region 2019 & 2032
- Table 123: Global Submarine Optical Fiber Cable Market Revenue Million Forecast, by Country 2019 & 2032
- Table 124: Global Submarine Optical Fiber Cable Market Volume K Unit Forecast, by Country 2019 & 2032
Frequently Asked Questions
1. What is the projected Compound Annual Growth Rate (CAGR) of the Submarine Optical Fiber Cable Market?
The projected CAGR is approximately 11.02%.
2. Which companies are prominent players in the Submarine Optical Fiber Cable Market?
Key companies in the market include NTT Communications Corporation, Nexans SA, Fujitsu Ltd, Global Marine Group, PT Communication Cable System Indonesia TBK, Pt Communication Cable System Indonesia TBK, LS Cable & System Ltd, HMN Technologies Co Ltd, S B Submarine Systems Co Ltd (SBBS), Orange Marine, IT International Telecom Inc, Subcom LLC, Alcatel Submarine Networks Ltd, NEC Corporation, Prysmian SPA, Google LLC (Alphabet Inc, Sumitomo Electric Industries Ltd.
3. What are the main segments of the Submarine Optical Fiber Cable Market?
The market segments include Product Type, Application, Region.
4. Can you provide details about the market size?
The market size is estimated to be USD 4.78 Million as of 2022.
5. What are some drivers contributing to market growth?
Growing Smartphone Penetration and Increasing Demand for Internet Bandwidth; Increasing Fiber Connectivity in Emerging Regions.
6. What are the notable trends driving market growth?
Growing Smartphone Penetration and Increasing Demand for Internet Bandwidth to Drive the Market.
7. Are there any restraints impacting market growth?
Inefficient Delivery Management.
8. Can you provide examples of recent developments in the market?
October 2023 - NEC Corporation announced that the Patara-2 submarine cable system, owned by Telkom Indonesia, the digital telco in Indonesia, is now complete and operational. This system connects multiple islands across Indonesia. NEC Corporation highlighted that the Patara-2 is a 100 Gigabit per second (Gbps) x 80 wavelengths (wl) x 2 fiber pairs (fp) optical fiber submarine cable system measuring approximately 1,200 kilometers. In addition to the existing Sulawesi Maluku Papua Cable System (SMPCS) and others provided by NEC in India, this new cable system is said to enhance connectivity among the cities of Waisai, Manokwari, and Supiori.
9. What pricing options are available for accessing the report?
Pricing options include single-user, multi-user, and enterprise licenses priced at USD 4750, USD 5250, and USD 8750 respectively.
10. Is the market size provided in terms of value or volume?
The market size is provided in terms of value, measured in Million and volume, measured in K Unit.
11. Are there any specific market keywords associated with the report?
Yes, the market keyword associated with the report is "Submarine Optical Fiber Cable Market," which aids in identifying and referencing the specific market segment covered.
12. How do I determine which pricing option suits my needs best?
The pricing options vary based on user requirements and access needs. Individual users may opt for single-user licenses, while businesses requiring broader access may choose multi-user or enterprise licenses for cost-effective access to the report.
13. Are there any additional resources or data provided in the Submarine Optical Fiber Cable Market report?
While the report offers comprehensive insights, it's advisable to review the specific contents or supplementary materials provided to ascertain if additional resources or data are available.
14. How can I stay updated on further developments or reports in the Submarine Optical Fiber Cable Market?
To stay informed about further developments, trends, and reports in the Submarine Optical Fiber Cable Market, consider subscribing to industry newsletters, following relevant companies and organizations, or regularly checking reputable industry news sources and publications.
Methodology
Step 1 - Identification of Relevant Samples Size from Population Database


Step 2 - Approaches for Defining Global Market Size (Value, Volume* & Price*)

Note*: In applicable scenarios
Step 3 - Data Sources
Primary Research
- Web Analytics
- Survey Reports
- Research Institute
- Latest Research Reports
- Opinion Leaders
Secondary Research
- Annual Reports
- White Paper
- Latest Press Release
- Industry Association
- Paid Database
- Investor Presentations

Step 4 - Data Triangulation
Involves using different sources of information in order to increase the validity of a study
These sources are likely to be stakeholders in a program - participants, other researchers, program staff, other community members, and so on.
Then we put all data in single framework & apply various statistical tools to find out the dynamic on the market.
During the analysis stage, feedback from the stakeholder groups would be compared to determine areas of agreement as well as areas of divergence


