
Key Insights
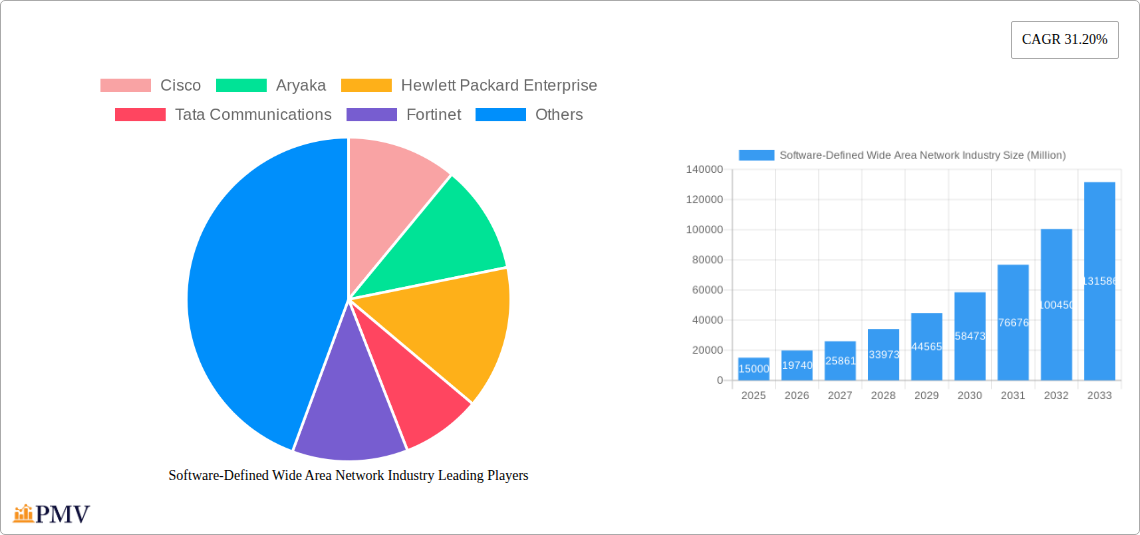
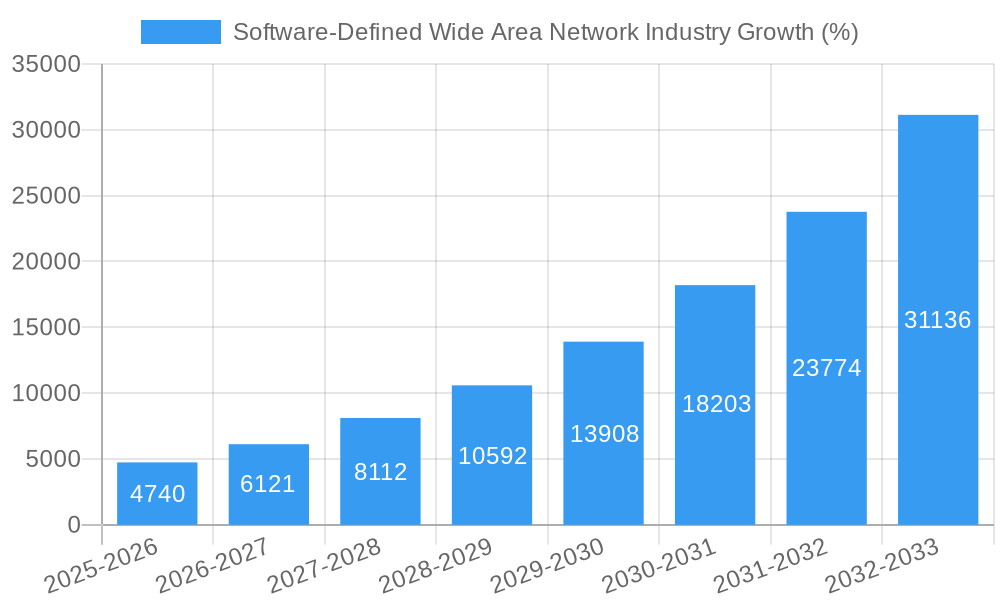
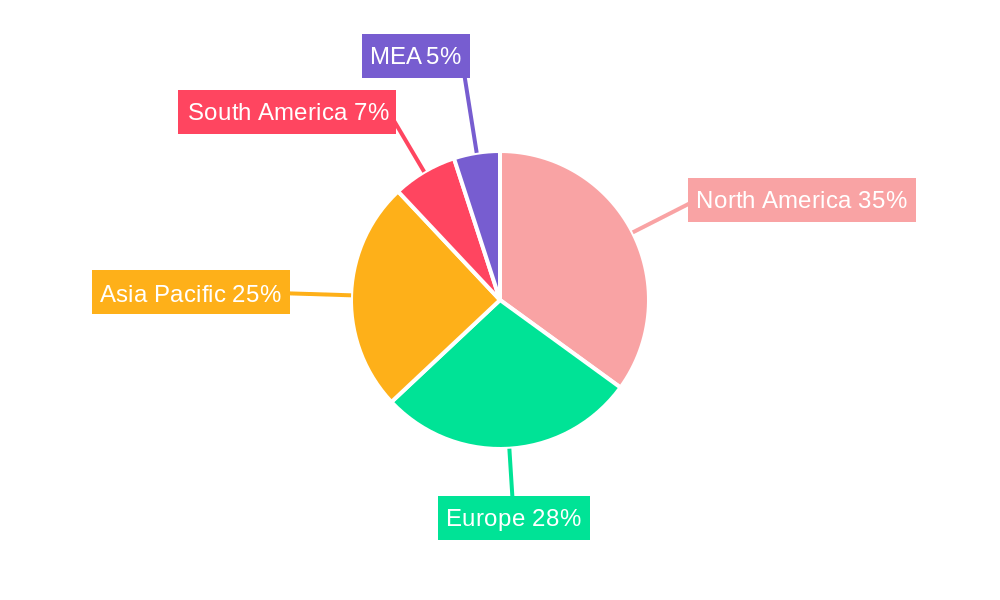
The Software-Defined Wide Area Network (SD-WAN) market is experiencing robust growth, driven by the increasing adoption of cloud-based applications, the need for enhanced network security, and the demand for improved network agility and scalability. The market's 31.20% CAGR indicates significant expansion, with a projected substantial increase in market value from 2025 onwards. Large enterprises are leading the adoption, followed by Small and Medium Enterprises (SMEs), driven by the need for cost optimization and improved network performance. The healthcare, banking and financial services, and retail sectors are key end-user industries showing strong growth, fueled by their reliance on secure and reliable network connectivity for critical operations. The cloud deployment model dominates, reflecting the shift towards flexible and scalable network solutions. Solutions, encompassing SD-WAN controllers and gateways, constitute a larger market share compared to services, which primarily comprise managed SD-WAN services and professional services. Competition is intense, with established players like Cisco, Aryaka, and Hewlett Packard Enterprise alongside emerging players vying for market share. Geographic distribution shows North America and Europe as mature markets, while the Asia-Pacific region exhibits high growth potential, driven by increasing digitalization and infrastructure development.
The continued expansion of the SD-WAN market will be fueled by several factors. The rising adoption of 5G technology will provide higher bandwidth and lower latency, making SD-WAN even more attractive. The increasing sophistication of cyber threats necessitates enhanced network security, further propelling SD-WAN adoption. Furthermore, the growing adoption of hybrid work models will necessitate more flexible and secure network solutions, creating a demand for SD-WAN's capabilities. However, factors like integration complexity and the need for skilled professionals to manage SD-WAN deployments could pose challenges to market growth. Nevertheless, the overall outlook for the SD-WAN market remains positive, projecting continued expansion and market penetration across various industries and geographies throughout the forecast period.
Software-Defined Wide Area Network (SD-WAN) Industry Report: 2019-2033
This comprehensive report provides a detailed analysis of the Software-Defined Wide Area Network (SD-WAN) industry, offering invaluable insights for businesses, investors, and stakeholders. The report covers the period from 2019 to 2033, with a focus on the estimated year 2025 and a forecast period from 2025 to 2033. The study analyzes key market trends, competitive dynamics, and growth opportunities within the SD-WAN market, valued at xx Million in 2025, projected to reach xx Million by 2033, exhibiting a CAGR of xx%.
Software-Defined Wide Area Network Industry Market Structure & Competitive Dynamics
The SD-WAN market is characterized by a dynamic competitive landscape with a mix of established players and emerging innovators. Market concentration is moderate, with several key players holding significant market share. Cisco, Aryaka, Hewlett Packard Enterprise, Tata Communications, Fortinet, Huawei, Ericsson, VMware, Nokia, and MCM Telecom are among the leading vendors, each employing diverse strategies to capture market share. These strategies include organic growth through product innovation and inorganic growth via mergers and acquisitions (M&A). Recent M&A activity has focused on strengthening capabilities in areas such as security and cloud integration, reflecting the evolving needs of enterprise customers. The total value of M&A deals in the SD-WAN sector from 2019-2024 is estimated to be approximately xx Million. Regulatory frameworks, particularly concerning data privacy and security, significantly influence market dynamics. The increasing adoption of cloud-based solutions and the growing demand for secure, reliable network connectivity are driving market growth. Product substitutes, such as traditional MPLS networks, are facing challenges due to the cost-effectiveness and flexibility offered by SD-WAN. Finally, end-user trends, particularly the increasing adoption of digital transformation initiatives and remote work models, are fueling the demand for SD-WAN solutions.
- Market Concentration: Moderate, with several major players holding significant shares.
- Innovation Ecosystems: Strong, with continuous development of new features and integrations.
- Regulatory Frameworks: Increasingly stringent, impacting data security and privacy.
- Product Substitutes: Traditional MPLS networks facing pressure due to SD-WAN advantages.
- End-User Trends: Growing adoption of digital transformation and remote work models.
- M&A Activity: Significant activity focused on enhancing security and cloud integration.
Software-Defined Wide Area Network Industry Industry Trends & Insights
The SD-WAN market is experiencing robust growth driven by several key factors. The increasing adoption of cloud-based applications and services is a major driver, as SD-WAN simplifies and secures connectivity to these resources. Businesses are also increasingly adopting hybrid work models, which require flexible and scalable network solutions. Furthermore, the rising demand for enhanced security features, such as integrated firewalls and intrusion prevention systems, is driving the adoption of SD-WAN solutions. Technological disruptions, such as the rise of 5G and edge computing, are further shaping the landscape. Consumer preferences are shifting towards solutions offering greater agility, scalability, and ease of management. Competitive dynamics are characterized by intense rivalry among vendors focused on innovation, pricing, and customer support. The market penetration of SD-WAN solutions is increasing rapidly across various industries, driven by the aforementioned factors.
Dominant Markets & Segments in Software-Defined Wide Area Network Industry
The North American region currently dominates the SD-WAN market, followed by Europe and Asia-Pacific. Within these regions, large enterprises are the largest segment by organization size, driven by their greater need for sophisticated network management and security capabilities. The banking and financial services, healthcare, and retail and consumer services sectors exhibit the highest adoption rates among end-user industries, due to their reliance on secure and reliable connectivity. Cloud deployment mode is gaining significant traction, propelled by the advantages of scalability, cost-effectiveness, and flexibility. Finally, the solutions segment holds the largest market share by component type, due to its comprehensive nature encompassing software, hardware, and associated services.
- Key Drivers for Large Enterprises: Demand for advanced network security, scalability, and centralized management.
- Key Drivers for Banking and Financial Services: Stringent regulatory compliance, need for secure transactions.
- Key Drivers for Cloud Deployment: Scalability, cost-effectiveness, and flexibility.
- Key Drivers for Solutions Segment: Comprehensive feature set, including software, hardware, and services.
Software-Defined Wide Area Network Industry Product Innovations
Recent product innovations in the SD-WAN market focus on enhancing security, integrating AI-powered analytics, and improving network visibility. Vendors are incorporating advanced security features, such as zero trust security and advanced threat protection, into their SD-WAN solutions. AI-driven analytics provide enhanced network monitoring and troubleshooting capabilities, streamlining operations and improving network performance. Improved network visibility allows businesses to better understand their network traffic patterns, facilitating improved resource allocation and optimization. These innovations demonstrate the evolution of SD-WAN towards more comprehensive and intelligent network management solutions, catering to the evolving needs of enterprise customers.
Report Segmentation & Scope
This report segments the SD-WAN market by organization size (Large Enterprises, Small-Medium Enterprises), end-user industry (Healthcare, Banking and Financial Services, Retail and Consumer Services, Manufacturing, Transport and Logistics, IT and Telecom, Other End-user Industries), deployment mode (Premise, Cloud, Hybrid), and component type (Solutions, Services). Each segment is analyzed in detail, providing growth projections, market sizes, and competitive dynamics for the period 2019-2033. The report offers a comprehensive overview of the market, enabling informed decision-making for all stakeholders.
Key Drivers of Software-Defined Wide Area Network Industry Growth
The growth of the SD-WAN market is driven by several key factors: increasing adoption of cloud services, the rise of remote work, the need for enhanced network security, and the ongoing digital transformation initiatives by businesses worldwide. Technological advancements such as AI and machine learning are also contributing to the expansion of the market. Furthermore, government initiatives aimed at promoting digital infrastructure development and favorable regulatory frameworks play a vital role in fostering growth.
Challenges in the Software-Defined Wide Area Network Industry Sector
The SD-WAN market faces several challenges, including the complexities of network integration, ensuring seamless interoperability across diverse environments, and maintaining high security standards. Supply chain disruptions can also impact the availability of hardware components, affecting the market's overall growth. Furthermore, intense competition among vendors and the need to constantly innovate to stay ahead of the curve pose significant challenges. The cost of implementation and ongoing maintenance can be a barrier for smaller businesses.
Leading Players in the Software-Defined Wide Area Network Industry Market
- Cisco
- Aryaka
- Hewlett Packard Enterprise
- Tata Communications
- Fortinet
- Huawei
- Ericsson
- VMware
- Nokia
- MCM Telecom
Key Developments in Software-Defined Wide Area Network Industry Sector
- Dec 2022: Five new managed security service providers (MSSPs) – B.Online, Cirion, ngena, PT&T, and Telefónica – adopted Fortinet Secure SD-WAN, strengthening Fortinet's market position and highlighting the growing demand for secure SD-WAN solutions.
- Sept 2022: Fortinet launched AI-based network operations management for 5G/LTE gateways, enhancing network visibility and operational efficiency.
- Sept 2022: Hughes Communication India launched India's first high-throughput satellite (HTS) service, expanding broadband access and potentially impacting SD-WAN deployments in remote areas.
Strategic Software-Defined Wide Area Network Industry Market Outlook
The future of the SD-WAN market is bright, with significant growth potential driven by ongoing technological advancements, increasing cloud adoption, and the expanding need for secure and reliable network connectivity. Strategic opportunities exist for vendors to focus on developing innovative solutions that address the specific needs of various industry verticals, enhancing security features, and leveraging AI and machine learning for improved network management and optimization. The market is expected to experience sustained growth, creating opportunities for new entrants and established players alike.
Software-Defined Wide Area Network Industry Segmentation
-
1. Deployment Mode
- 1.1. Premise
- 1.2. Cloud
- 1.3. Hybrid
-
2. Component Type
- 2.1. Solutions
- 2.2. Services
-
3. Organisation Size
- 3.1. Large Enterprises
- 3.2. Small-Medium Enterprises
-
4. End-user Industry
- 4.1. Healthcare
- 4.2. Banking and Financial Services
- 4.3. Retail and Consumer Services
- 4.4. Manufacturing
- 4.5. Transport and Logistics
- 4.6. IT and Telecom
- 4.7. Other End-user Industries
Software-Defined Wide Area Network Industry Segmentation By Geography
-
1. North America
- 1.1. United States
- 1.2. Canada
- 1.3. Mexico
- 1.4. Rest of North America
-
2. Europe
- 2.1. United Kingdom
- 2.2. France
- 2.3. Germany
- 2.4. Rest of Europe
-
3. Asia Pacific
- 3.1. China
- 3.2. India
- 3.3. Japan
- 3.4. Australia
- 3.5. South Korea
- 3.6. Rest of Asia Pacific
-
4. Latin America
- 4.1. Brazil
- 4.2. Mexico
- 4.3. Rest of Latin America
-
5. MEA
- 5.1. UAE
- 5.2. South Africa
- 5.3. Saudi Arabia
- 5.4. Rest Of MEA
Software-Defined Wide Area Network Industry REPORT HIGHLIGHTS
| Aspects | Details |
|---|---|
| Study Period | 2019-2033 |
| Base Year | 2024 |
| Estimated Year | 2025 |
| Forecast Period | 2025-2033 |
| Historical Period | 2019-2024 |
| Growth Rate | CAGR of 31.20% from 2019-2033 |
| Segmentation |
|
Table of Contents
- 1. Introduction
- 1.1. Research Scope
- 1.2. Market Segmentation
- 1.3. Research Methodology
- 1.4. Definitions and Assumptions
- 2. Executive Summary
- 2.1. Introduction
- 3. Market Dynamics
- 3.1. Introduction
- 3.2. Market Drivers
- 3.2.1. Increased Number of Cloud-based Solution; Simplified Network Solution; Growing Demand for Mobility Services
- 3.3. Market Restrains
- 3.3.1. Data Security; Lack of Qualified Trainers
- 3.4. Market Trends
- 3.4.1. Enterprise Sector will Add to the SD-WAN Market Growth
- 4. Market Factor Analysis
- 4.1. Porters Five Forces
- 4.2. Supply/Value Chain
- 4.3. PESTEL analysis
- 4.4. Market Entropy
- 4.5. Patent/Trademark Analysis
- 5. Global Software-Defined Wide Area Network Industry Analysis, Insights and Forecast, 2019-2031
- 5.1. Market Analysis, Insights and Forecast - by Deployment Mode
- 5.1.1. Premise
- 5.1.2. Cloud
- 5.1.3. Hybrid
- 5.2. Market Analysis, Insights and Forecast - by Component Type
- 5.2.1. Solutions
- 5.2.2. Services
- 5.3. Market Analysis, Insights and Forecast - by Organisation Size
- 5.3.1. Large Enterprises
- 5.3.2. Small-Medium Enterprises
- 5.4. Market Analysis, Insights and Forecast - by End-user Industry
- 5.4.1. Healthcare
- 5.4.2. Banking and Financial Services
- 5.4.3. Retail and Consumer Services
- 5.4.4. Manufacturing
- 5.4.5. Transport and Logistics
- 5.4.6. IT and Telecom
- 5.4.7. Other End-user Industries
- 5.5. Market Analysis, Insights and Forecast - by Region
- 5.5.1. North America
- 5.5.2. Europe
- 5.5.3. Asia Pacific
- 5.5.4. Latin America
- 5.5.5. MEA
- 5.1. Market Analysis, Insights and Forecast - by Deployment Mode
- 6. North America Software-Defined Wide Area Network Industry Analysis, Insights and Forecast, 2019-2031
- 6.1. Market Analysis, Insights and Forecast - by Deployment Mode
- 6.1.1. Premise
- 6.1.2. Cloud
- 6.1.3. Hybrid
- 6.2. Market Analysis, Insights and Forecast - by Component Type
- 6.2.1. Solutions
- 6.2.2. Services
- 6.3. Market Analysis, Insights and Forecast - by Organisation Size
- 6.3.1. Large Enterprises
- 6.3.2. Small-Medium Enterprises
- 6.4. Market Analysis, Insights and Forecast - by End-user Industry
- 6.4.1. Healthcare
- 6.4.2. Banking and Financial Services
- 6.4.3. Retail and Consumer Services
- 6.4.4. Manufacturing
- 6.4.5. Transport and Logistics
- 6.4.6. IT and Telecom
- 6.4.7. Other End-user Industries
- 6.1. Market Analysis, Insights and Forecast - by Deployment Mode
- 7. Europe Software-Defined Wide Area Network Industry Analysis, Insights and Forecast, 2019-2031
- 7.1. Market Analysis, Insights and Forecast - by Deployment Mode
- 7.1.1. Premise
- 7.1.2. Cloud
- 7.1.3. Hybrid
- 7.2. Market Analysis, Insights and Forecast - by Component Type
- 7.2.1. Solutions
- 7.2.2. Services
- 7.3. Market Analysis, Insights and Forecast - by Organisation Size
- 7.3.1. Large Enterprises
- 7.3.2. Small-Medium Enterprises
- 7.4. Market Analysis, Insights and Forecast - by End-user Industry
- 7.4.1. Healthcare
- 7.4.2. Banking and Financial Services
- 7.4.3. Retail and Consumer Services
- 7.4.4. Manufacturing
- 7.4.5. Transport and Logistics
- 7.4.6. IT and Telecom
- 7.4.7. Other End-user Industries
- 7.1. Market Analysis, Insights and Forecast - by Deployment Mode
- 8. Asia Pacific Software-Defined Wide Area Network Industry Analysis, Insights and Forecast, 2019-2031
- 8.1. Market Analysis, Insights and Forecast - by Deployment Mode
- 8.1.1. Premise
- 8.1.2. Cloud
- 8.1.3. Hybrid
- 8.2. Market Analysis, Insights and Forecast - by Component Type
- 8.2.1. Solutions
- 8.2.2. Services
- 8.3. Market Analysis, Insights and Forecast - by Organisation Size
- 8.3.1. Large Enterprises
- 8.3.2. Small-Medium Enterprises
- 8.4. Market Analysis, Insights and Forecast - by End-user Industry
- 8.4.1. Healthcare
- 8.4.2. Banking and Financial Services
- 8.4.3. Retail and Consumer Services
- 8.4.4. Manufacturing
- 8.4.5. Transport and Logistics
- 8.4.6. IT and Telecom
- 8.4.7. Other End-user Industries
- 8.1. Market Analysis, Insights and Forecast - by Deployment Mode
- 9. Latin America Software-Defined Wide Area Network Industry Analysis, Insights and Forecast, 2019-2031
- 9.1. Market Analysis, Insights and Forecast - by Deployment Mode
- 9.1.1. Premise
- 9.1.2. Cloud
- 9.1.3. Hybrid
- 9.2. Market Analysis, Insights and Forecast - by Component Type
- 9.2.1. Solutions
- 9.2.2. Services
- 9.3. Market Analysis, Insights and Forecast - by Organisation Size
- 9.3.1. Large Enterprises
- 9.3.2. Small-Medium Enterprises
- 9.4. Market Analysis, Insights and Forecast - by End-user Industry
- 9.4.1. Healthcare
- 9.4.2. Banking and Financial Services
- 9.4.3. Retail and Consumer Services
- 9.4.4. Manufacturing
- 9.4.5. Transport and Logistics
- 9.4.6. IT and Telecom
- 9.4.7. Other End-user Industries
- 9.1. Market Analysis, Insights and Forecast - by Deployment Mode
- 10. MEA Software-Defined Wide Area Network Industry Analysis, Insights and Forecast, 2019-2031
- 10.1. Market Analysis, Insights and Forecast - by Deployment Mode
- 10.1.1. Premise
- 10.1.2. Cloud
- 10.1.3. Hybrid
- 10.2. Market Analysis, Insights and Forecast - by Component Type
- 10.2.1. Solutions
- 10.2.2. Services
- 10.3. Market Analysis, Insights and Forecast - by Organisation Size
- 10.3.1. Large Enterprises
- 10.3.2. Small-Medium Enterprises
- 10.4. Market Analysis, Insights and Forecast - by End-user Industry
- 10.4.1. Healthcare
- 10.4.2. Banking and Financial Services
- 10.4.3. Retail and Consumer Services
- 10.4.4. Manufacturing
- 10.4.5. Transport and Logistics
- 10.4.6. IT and Telecom
- 10.4.7. Other End-user Industries
- 10.1. Market Analysis, Insights and Forecast - by Deployment Mode
- 11. North America Software-Defined Wide Area Network Industry Analysis, Insights and Forecast, 2019-2031
- 11.1. Market Analysis, Insights and Forecast - By Country/Sub-region
- 11.1.1 United States
- 11.1.2 Canada
- 11.1.3 Mexico
- 12. Europe Software-Defined Wide Area Network Industry Analysis, Insights and Forecast, 2019-2031
- 12.1. Market Analysis, Insights and Forecast - By Country/Sub-region
- 12.1.1 Germany
- 12.1.2 United Kingdom
- 12.1.3 France
- 12.1.4 Spain
- 12.1.5 Italy
- 12.1.6 Spain
- 12.1.7 Belgium
- 12.1.8 Netherland
- 12.1.9 Nordics
- 12.1.10 Rest of Europe
- 13. Asia Pacific Software-Defined Wide Area Network Industry Analysis, Insights and Forecast, 2019-2031
- 13.1. Market Analysis, Insights and Forecast - By Country/Sub-region
- 13.1.1 China
- 13.1.2 Japan
- 13.1.3 India
- 13.1.4 South Korea
- 13.1.5 Southeast Asia
- 13.1.6 Australia
- 13.1.7 Indonesia
- 13.1.8 Phillipes
- 13.1.9 Singapore
- 13.1.10 Thailandc
- 13.1.11 Rest of Asia Pacific
- 14. South America Software-Defined Wide Area Network Industry Analysis, Insights and Forecast, 2019-2031
- 14.1. Market Analysis, Insights and Forecast - By Country/Sub-region
- 14.1.1 Brazil
- 14.1.2 Argentina
- 14.1.3 Peru
- 14.1.4 Chile
- 14.1.5 Colombia
- 14.1.6 Ecuador
- 14.1.7 Venezuela
- 14.1.8 Rest of South America
- 15. North America Software-Defined Wide Area Network Industry Analysis, Insights and Forecast, 2019-2031
- 15.1. Market Analysis, Insights and Forecast - By Country/Sub-region
- 15.1.1 United States
- 15.1.2 Canada
- 15.1.3 Mexico
- 16. MEA Software-Defined Wide Area Network Industry Analysis, Insights and Forecast, 2019-2031
- 16.1. Market Analysis, Insights and Forecast - By Country/Sub-region
- 16.1.1 United Arab Emirates
- 16.1.2 Saudi Arabia
- 16.1.3 South Africa
- 16.1.4 Rest of Middle East and Africa
- 17. Competitive Analysis
- 17.1. Global Market Share Analysis 2024
- 17.2. Company Profiles
- 17.2.1 Cisco
- 17.2.1.1. Overview
- 17.2.1.2. Products
- 17.2.1.3. SWOT Analysis
- 17.2.1.4. Recent Developments
- 17.2.1.5. Financials (Based on Availability)
- 17.2.2 Aryaka
- 17.2.2.1. Overview
- 17.2.2.2. Products
- 17.2.2.3. SWOT Analysis
- 17.2.2.4. Recent Developments
- 17.2.2.5. Financials (Based on Availability)
- 17.2.3 Hewlett Packard Enterprise
- 17.2.3.1. Overview
- 17.2.3.2. Products
- 17.2.3.3. SWOT Analysis
- 17.2.3.4. Recent Developments
- 17.2.3.5. Financials (Based on Availability)
- 17.2.4 Tata Communications
- 17.2.4.1. Overview
- 17.2.4.2. Products
- 17.2.4.3. SWOT Analysis
- 17.2.4.4. Recent Developments
- 17.2.4.5. Financials (Based on Availability)
- 17.2.5 Fortinet
- 17.2.5.1. Overview
- 17.2.5.2. Products
- 17.2.5.3. SWOT Analysis
- 17.2.5.4. Recent Developments
- 17.2.5.5. Financials (Based on Availability)
- 17.2.6 Huawei
- 17.2.6.1. Overview
- 17.2.6.2. Products
- 17.2.6.3. SWOT Analysis
- 17.2.6.4. Recent Developments
- 17.2.6.5. Financials (Based on Availability)
- 17.2.7 Ericsson
- 17.2.7.1. Overview
- 17.2.7.2. Products
- 17.2.7.3. SWOT Analysis
- 17.2.7.4. Recent Developments
- 17.2.7.5. Financials (Based on Availability)
- 17.2.8 vmware
- 17.2.8.1. Overview
- 17.2.8.2. Products
- 17.2.8.3. SWOT Analysis
- 17.2.8.4. Recent Developments
- 17.2.8.5. Financials (Based on Availability)
- 17.2.9 Nokia
- 17.2.9.1. Overview
- 17.2.9.2. Products
- 17.2.9.3. SWOT Analysis
- 17.2.9.4. Recent Developments
- 17.2.9.5. Financials (Based on Availability)
- 17.2.10 MCM Telecom
- 17.2.10.1. Overview
- 17.2.10.2. Products
- 17.2.10.3. SWOT Analysis
- 17.2.10.4. Recent Developments
- 17.2.10.5. Financials (Based on Availability)
- 17.2.1 Cisco
List of Figures
- Figure 1: Global Software-Defined Wide Area Network Industry Revenue Breakdown (Million, %) by Region 2024 & 2032
- Figure 2: Global Software-Defined Wide Area Network Industry Volume Breakdown (K Unit, %) by Region 2024 & 2032
- Figure 3: North America Software-Defined Wide Area Network Industry Revenue (Million), by Country 2024 & 2032
- Figure 4: North America Software-Defined Wide Area Network Industry Volume (K Unit), by Country 2024 & 2032
- Figure 5: North America Software-Defined Wide Area Network Industry Revenue Share (%), by Country 2024 & 2032
- Figure 6: North America Software-Defined Wide Area Network Industry Volume Share (%), by Country 2024 & 2032
- Figure 7: Europe Software-Defined Wide Area Network Industry Revenue (Million), by Country 2024 & 2032
- Figure 8: Europe Software-Defined Wide Area Network Industry Volume (K Unit), by Country 2024 & 2032
- Figure 9: Europe Software-Defined Wide Area Network Industry Revenue Share (%), by Country 2024 & 2032
- Figure 10: Europe Software-Defined Wide Area Network Industry Volume Share (%), by Country 2024 & 2032
- Figure 11: Asia Pacific Software-Defined Wide Area Network Industry Revenue (Million), by Country 2024 & 2032
- Figure 12: Asia Pacific Software-Defined Wide Area Network Industry Volume (K Unit), by Country 2024 & 2032
- Figure 13: Asia Pacific Software-Defined Wide Area Network Industry Revenue Share (%), by Country 2024 & 2032
- Figure 14: Asia Pacific Software-Defined Wide Area Network Industry Volume Share (%), by Country 2024 & 2032
- Figure 15: South America Software-Defined Wide Area Network Industry Revenue (Million), by Country 2024 & 2032
- Figure 16: South America Software-Defined Wide Area Network Industry Volume (K Unit), by Country 2024 & 2032
- Figure 17: South America Software-Defined Wide Area Network Industry Revenue Share (%), by Country 2024 & 2032
- Figure 18: South America Software-Defined Wide Area Network Industry Volume Share (%), by Country 2024 & 2032
- Figure 19: North America Software-Defined Wide Area Network Industry Revenue (Million), by Country 2024 & 2032
- Figure 20: North America Software-Defined Wide Area Network Industry Volume (K Unit), by Country 2024 & 2032
- Figure 21: North America Software-Defined Wide Area Network Industry Revenue Share (%), by Country 2024 & 2032
- Figure 22: North America Software-Defined Wide Area Network Industry Volume Share (%), by Country 2024 & 2032
- Figure 23: MEA Software-Defined Wide Area Network Industry Revenue (Million), by Country 2024 & 2032
- Figure 24: MEA Software-Defined Wide Area Network Industry Volume (K Unit), by Country 2024 & 2032
- Figure 25: MEA Software-Defined Wide Area Network Industry Revenue Share (%), by Country 2024 & 2032
- Figure 26: MEA Software-Defined Wide Area Network Industry Volume Share (%), by Country 2024 & 2032
- Figure 27: North America Software-Defined Wide Area Network Industry Revenue (Million), by Deployment Mode 2024 & 2032
- Figure 28: North America Software-Defined Wide Area Network Industry Volume (K Unit), by Deployment Mode 2024 & 2032
- Figure 29: North America Software-Defined Wide Area Network Industry Revenue Share (%), by Deployment Mode 2024 & 2032
- Figure 30: North America Software-Defined Wide Area Network Industry Volume Share (%), by Deployment Mode 2024 & 2032
- Figure 31: North America Software-Defined Wide Area Network Industry Revenue (Million), by Component Type 2024 & 2032
- Figure 32: North America Software-Defined Wide Area Network Industry Volume (K Unit), by Component Type 2024 & 2032
- Figure 33: North America Software-Defined Wide Area Network Industry Revenue Share (%), by Component Type 2024 & 2032
- Figure 34: North America Software-Defined Wide Area Network Industry Volume Share (%), by Component Type 2024 & 2032
- Figure 35: North America Software-Defined Wide Area Network Industry Revenue (Million), by Organisation Size 2024 & 2032
- Figure 36: North America Software-Defined Wide Area Network Industry Volume (K Unit), by Organisation Size 2024 & 2032
- Figure 37: North America Software-Defined Wide Area Network Industry Revenue Share (%), by Organisation Size 2024 & 2032
- Figure 38: North America Software-Defined Wide Area Network Industry Volume Share (%), by Organisation Size 2024 & 2032
- Figure 39: North America Software-Defined Wide Area Network Industry Revenue (Million), by End-user Industry 2024 & 2032
- Figure 40: North America Software-Defined Wide Area Network Industry Volume (K Unit), by End-user Industry 2024 & 2032
- Figure 41: North America Software-Defined Wide Area Network Industry Revenue Share (%), by End-user Industry 2024 & 2032
- Figure 42: North America Software-Defined Wide Area Network Industry Volume Share (%), by End-user Industry 2024 & 2032
- Figure 43: North America Software-Defined Wide Area Network Industry Revenue (Million), by Country 2024 & 2032
- Figure 44: North America Software-Defined Wide Area Network Industry Volume (K Unit), by Country 2024 & 2032
- Figure 45: North America Software-Defined Wide Area Network Industry Revenue Share (%), by Country 2024 & 2032
- Figure 46: North America Software-Defined Wide Area Network Industry Volume Share (%), by Country 2024 & 2032
- Figure 47: Europe Software-Defined Wide Area Network Industry Revenue (Million), by Deployment Mode 2024 & 2032
- Figure 48: Europe Software-Defined Wide Area Network Industry Volume (K Unit), by Deployment Mode 2024 & 2032
- Figure 49: Europe Software-Defined Wide Area Network Industry Revenue Share (%), by Deployment Mode 2024 & 2032
- Figure 50: Europe Software-Defined Wide Area Network Industry Volume Share (%), by Deployment Mode 2024 & 2032
- Figure 51: Europe Software-Defined Wide Area Network Industry Revenue (Million), by Component Type 2024 & 2032
- Figure 52: Europe Software-Defined Wide Area Network Industry Volume (K Unit), by Component Type 2024 & 2032
- Figure 53: Europe Software-Defined Wide Area Network Industry Revenue Share (%), by Component Type 2024 & 2032
- Figure 54: Europe Software-Defined Wide Area Network Industry Volume Share (%), by Component Type 2024 & 2032
- Figure 55: Europe Software-Defined Wide Area Network Industry Revenue (Million), by Organisation Size 2024 & 2032
- Figure 56: Europe Software-Defined Wide Area Network Industry Volume (K Unit), by Organisation Size 2024 & 2032
- Figure 57: Europe Software-Defined Wide Area Network Industry Revenue Share (%), by Organisation Size 2024 & 2032
- Figure 58: Europe Software-Defined Wide Area Network Industry Volume Share (%), by Organisation Size 2024 & 2032
- Figure 59: Europe Software-Defined Wide Area Network Industry Revenue (Million), by End-user Industry 2024 & 2032
- Figure 60: Europe Software-Defined Wide Area Network Industry Volume (K Unit), by End-user Industry 2024 & 2032
- Figure 61: Europe Software-Defined Wide Area Network Industry Revenue Share (%), by End-user Industry 2024 & 2032
- Figure 62: Europe Software-Defined Wide Area Network Industry Volume Share (%), by End-user Industry 2024 & 2032
- Figure 63: Europe Software-Defined Wide Area Network Industry Revenue (Million), by Country 2024 & 2032
- Figure 64: Europe Software-Defined Wide Area Network Industry Volume (K Unit), by Country 2024 & 2032
- Figure 65: Europe Software-Defined Wide Area Network Industry Revenue Share (%), by Country 2024 & 2032
- Figure 66: Europe Software-Defined Wide Area Network Industry Volume Share (%), by Country 2024 & 2032
- Figure 67: Asia Pacific Software-Defined Wide Area Network Industry Revenue (Million), by Deployment Mode 2024 & 2032
- Figure 68: Asia Pacific Software-Defined Wide Area Network Industry Volume (K Unit), by Deployment Mode 2024 & 2032
- Figure 69: Asia Pacific Software-Defined Wide Area Network Industry Revenue Share (%), by Deployment Mode 2024 & 2032
- Figure 70: Asia Pacific Software-Defined Wide Area Network Industry Volume Share (%), by Deployment Mode 2024 & 2032
- Figure 71: Asia Pacific Software-Defined Wide Area Network Industry Revenue (Million), by Component Type 2024 & 2032
- Figure 72: Asia Pacific Software-Defined Wide Area Network Industry Volume (K Unit), by Component Type 2024 & 2032
- Figure 73: Asia Pacific Software-Defined Wide Area Network Industry Revenue Share (%), by Component Type 2024 & 2032
- Figure 74: Asia Pacific Software-Defined Wide Area Network Industry Volume Share (%), by Component Type 2024 & 2032
- Figure 75: Asia Pacific Software-Defined Wide Area Network Industry Revenue (Million), by Organisation Size 2024 & 2032
- Figure 76: Asia Pacific Software-Defined Wide Area Network Industry Volume (K Unit), by Organisation Size 2024 & 2032
- Figure 77: Asia Pacific Software-Defined Wide Area Network Industry Revenue Share (%), by Organisation Size 2024 & 2032
- Figure 78: Asia Pacific Software-Defined Wide Area Network Industry Volume Share (%), by Organisation Size 2024 & 2032
- Figure 79: Asia Pacific Software-Defined Wide Area Network Industry Revenue (Million), by End-user Industry 2024 & 2032
- Figure 80: Asia Pacific Software-Defined Wide Area Network Industry Volume (K Unit), by End-user Industry 2024 & 2032
- Figure 81: Asia Pacific Software-Defined Wide Area Network Industry Revenue Share (%), by End-user Industry 2024 & 2032
- Figure 82: Asia Pacific Software-Defined Wide Area Network Industry Volume Share (%), by End-user Industry 2024 & 2032
- Figure 83: Asia Pacific Software-Defined Wide Area Network Industry Revenue (Million), by Country 2024 & 2032
- Figure 84: Asia Pacific Software-Defined Wide Area Network Industry Volume (K Unit), by Country 2024 & 2032
- Figure 85: Asia Pacific Software-Defined Wide Area Network Industry Revenue Share (%), by Country 2024 & 2032
- Figure 86: Asia Pacific Software-Defined Wide Area Network Industry Volume Share (%), by Country 2024 & 2032
- Figure 87: Latin America Software-Defined Wide Area Network Industry Revenue (Million), by Deployment Mode 2024 & 2032
- Figure 88: Latin America Software-Defined Wide Area Network Industry Volume (K Unit), by Deployment Mode 2024 & 2032
- Figure 89: Latin America Software-Defined Wide Area Network Industry Revenue Share (%), by Deployment Mode 2024 & 2032
- Figure 90: Latin America Software-Defined Wide Area Network Industry Volume Share (%), by Deployment Mode 2024 & 2032
- Figure 91: Latin America Software-Defined Wide Area Network Industry Revenue (Million), by Component Type 2024 & 2032
- Figure 92: Latin America Software-Defined Wide Area Network Industry Volume (K Unit), by Component Type 2024 & 2032
- Figure 93: Latin America Software-Defined Wide Area Network Industry Revenue Share (%), by Component Type 2024 & 2032
- Figure 94: Latin America Software-Defined Wide Area Network Industry Volume Share (%), by Component Type 2024 & 2032
- Figure 95: Latin America Software-Defined Wide Area Network Industry Revenue (Million), by Organisation Size 2024 & 2032
- Figure 96: Latin America Software-Defined Wide Area Network Industry Volume (K Unit), by Organisation Size 2024 & 2032
- Figure 97: Latin America Software-Defined Wide Area Network Industry Revenue Share (%), by Organisation Size 2024 & 2032
- Figure 98: Latin America Software-Defined Wide Area Network Industry Volume Share (%), by Organisation Size 2024 & 2032
- Figure 99: Latin America Software-Defined Wide Area Network Industry Revenue (Million), by End-user Industry 2024 & 2032
- Figure 100: Latin America Software-Defined Wide Area Network Industry Volume (K Unit), by End-user Industry 2024 & 2032
- Figure 101: Latin America Software-Defined Wide Area Network Industry Revenue Share (%), by End-user Industry 2024 & 2032
- Figure 102: Latin America Software-Defined Wide Area Network Industry Volume Share (%), by End-user Industry 2024 & 2032
- Figure 103: Latin America Software-Defined Wide Area Network Industry Revenue (Million), by Country 2024 & 2032
- Figure 104: Latin America Software-Defined Wide Area Network Industry Volume (K Unit), by Country 2024 & 2032
- Figure 105: Latin America Software-Defined Wide Area Network Industry Revenue Share (%), by Country 2024 & 2032
- Figure 106: Latin America Software-Defined Wide Area Network Industry Volume Share (%), by Country 2024 & 2032
- Figure 107: MEA Software-Defined Wide Area Network Industry Revenue (Million), by Deployment Mode 2024 & 2032
- Figure 108: MEA Software-Defined Wide Area Network Industry Volume (K Unit), by Deployment Mode 2024 & 2032
- Figure 109: MEA Software-Defined Wide Area Network Industry Revenue Share (%), by Deployment Mode 2024 & 2032
- Figure 110: MEA Software-Defined Wide Area Network Industry Volume Share (%), by Deployment Mode 2024 & 2032
- Figure 111: MEA Software-Defined Wide Area Network Industry Revenue (Million), by Component Type 2024 & 2032
- Figure 112: MEA Software-Defined Wide Area Network Industry Volume (K Unit), by Component Type 2024 & 2032
- Figure 113: MEA Software-Defined Wide Area Network Industry Revenue Share (%), by Component Type 2024 & 2032
- Figure 114: MEA Software-Defined Wide Area Network Industry Volume Share (%), by Component Type 2024 & 2032
- Figure 115: MEA Software-Defined Wide Area Network Industry Revenue (Million), by Organisation Size 2024 & 2032
- Figure 116: MEA Software-Defined Wide Area Network Industry Volume (K Unit), by Organisation Size 2024 & 2032
- Figure 117: MEA Software-Defined Wide Area Network Industry Revenue Share (%), by Organisation Size 2024 & 2032
- Figure 118: MEA Software-Defined Wide Area Network Industry Volume Share (%), by Organisation Size 2024 & 2032
- Figure 119: MEA Software-Defined Wide Area Network Industry Revenue (Million), by End-user Industry 2024 & 2032
- Figure 120: MEA Software-Defined Wide Area Network Industry Volume (K Unit), by End-user Industry 2024 & 2032
- Figure 121: MEA Software-Defined Wide Area Network Industry Revenue Share (%), by End-user Industry 2024 & 2032
- Figure 122: MEA Software-Defined Wide Area Network Industry Volume Share (%), by End-user Industry 2024 & 2032
- Figure 123: MEA Software-Defined Wide Area Network Industry Revenue (Million), by Country 2024 & 2032
- Figure 124: MEA Software-Defined Wide Area Network Industry Volume (K Unit), by Country 2024 & 2032
- Figure 125: MEA Software-Defined Wide Area Network Industry Revenue Share (%), by Country 2024 & 2032
- Figure 126: MEA Software-Defined Wide Area Network Industry Volume Share (%), by Country 2024 & 2032
List of Tables
- Table 1: Global Software-Defined Wide Area Network Industry Revenue Million Forecast, by Region 2019 & 2032
- Table 2: Global Software-Defined Wide Area Network Industry Volume K Unit Forecast, by Region 2019 & 2032
- Table 3: Global Software-Defined Wide Area Network Industry Revenue Million Forecast, by Deployment Mode 2019 & 2032
- Table 4: Global Software-Defined Wide Area Network Industry Volume K Unit Forecast, by Deployment Mode 2019 & 2032
- Table 5: Global Software-Defined Wide Area Network Industry Revenue Million Forecast, by Component Type 2019 & 2032
- Table 6: Global Software-Defined Wide Area Network Industry Volume K Unit Forecast, by Component Type 2019 & 2032
- Table 7: Global Software-Defined Wide Area Network Industry Revenue Million Forecast, by Organisation Size 2019 & 2032
- Table 8: Global Software-Defined Wide Area Network Industry Volume K Unit Forecast, by Organisation Size 2019 & 2032
- Table 9: Global Software-Defined Wide Area Network Industry Revenue Million Forecast, by End-user Industry 2019 & 2032
- Table 10: Global Software-Defined Wide Area Network Industry Volume K Unit Forecast, by End-user Industry 2019 & 2032
- Table 11: Global Software-Defined Wide Area Network Industry Revenue Million Forecast, by Region 2019 & 2032
- Table 12: Global Software-Defined Wide Area Network Industry Volume K Unit Forecast, by Region 2019 & 2032
- Table 13: Global Software-Defined Wide Area Network Industry Revenue Million Forecast, by Country 2019 & 2032
- Table 14: Global Software-Defined Wide Area Network Industry Volume K Unit Forecast, by Country 2019 & 2032
- Table 15: United States Software-Defined Wide Area Network Industry Revenue (Million) Forecast, by Application 2019 & 2032
- Table 16: United States Software-Defined Wide Area Network Industry Volume (K Unit) Forecast, by Application 2019 & 2032
- Table 17: Canada Software-Defined Wide Area Network Industry Revenue (Million) Forecast, by Application 2019 & 2032
- Table 18: Canada Software-Defined Wide Area Network Industry Volume (K Unit) Forecast, by Application 2019 & 2032
- Table 19: Mexico Software-Defined Wide Area Network Industry Revenue (Million) Forecast, by Application 2019 & 2032
- Table 20: Mexico Software-Defined Wide Area Network Industry Volume (K Unit) Forecast, by Application 2019 & 2032
- Table 21: Global Software-Defined Wide Area Network Industry Revenue Million Forecast, by Country 2019 & 2032
- Table 22: Global Software-Defined Wide Area Network Industry Volume K Unit Forecast, by Country 2019 & 2032
- Table 23: Germany Software-Defined Wide Area Network Industry Revenue (Million) Forecast, by Application 2019 & 2032
- Table 24: Germany Software-Defined Wide Area Network Industry Volume (K Unit) Forecast, by Application 2019 & 2032
- Table 25: United Kingdom Software-Defined Wide Area Network Industry Revenue (Million) Forecast, by Application 2019 & 2032
- Table 26: United Kingdom Software-Defined Wide Area Network Industry Volume (K Unit) Forecast, by Application 2019 & 2032
- Table 27: France Software-Defined Wide Area Network Industry Revenue (Million) Forecast, by Application 2019 & 2032
- Table 28: France Software-Defined Wide Area Network Industry Volume (K Unit) Forecast, by Application 2019 & 2032
- Table 29: Spain Software-Defined Wide Area Network Industry Revenue (Million) Forecast, by Application 2019 & 2032
- Table 30: Spain Software-Defined Wide Area Network Industry Volume (K Unit) Forecast, by Application 2019 & 2032
- Table 31: Italy Software-Defined Wide Area Network Industry Revenue (Million) Forecast, by Application 2019 & 2032
- Table 32: Italy Software-Defined Wide Area Network Industry Volume (K Unit) Forecast, by Application 2019 & 2032
- Table 33: Spain Software-Defined Wide Area Network Industry Revenue (Million) Forecast, by Application 2019 & 2032
- Table 34: Spain Software-Defined Wide Area Network Industry Volume (K Unit) Forecast, by Application 2019 & 2032
- Table 35: Belgium Software-Defined Wide Area Network Industry Revenue (Million) Forecast, by Application 2019 & 2032
- Table 36: Belgium Software-Defined Wide Area Network Industry Volume (K Unit) Forecast, by Application 2019 & 2032
- Table 37: Netherland Software-Defined Wide Area Network Industry Revenue (Million) Forecast, by Application 2019 & 2032
- Table 38: Netherland Software-Defined Wide Area Network Industry Volume (K Unit) Forecast, by Application 2019 & 2032
- Table 39: Nordics Software-Defined Wide Area Network Industry Revenue (Million) Forecast, by Application 2019 & 2032
- Table 40: Nordics Software-Defined Wide Area Network Industry Volume (K Unit) Forecast, by Application 2019 & 2032
- Table 41: Rest of Europe Software-Defined Wide Area Network Industry Revenue (Million) Forecast, by Application 2019 & 2032
- Table 42: Rest of Europe Software-Defined Wide Area Network Industry Volume (K Unit) Forecast, by Application 2019 & 2032
- Table 43: Global Software-Defined Wide Area Network Industry Revenue Million Forecast, by Country 2019 & 2032
- Table 44: Global Software-Defined Wide Area Network Industry Volume K Unit Forecast, by Country 2019 & 2032
- Table 45: China Software-Defined Wide Area Network Industry Revenue (Million) Forecast, by Application 2019 & 2032
- Table 46: China Software-Defined Wide Area Network Industry Volume (K Unit) Forecast, by Application 2019 & 2032
- Table 47: Japan Software-Defined Wide Area Network Industry Revenue (Million) Forecast, by Application 2019 & 2032
- Table 48: Japan Software-Defined Wide Area Network Industry Volume (K Unit) Forecast, by Application 2019 & 2032
- Table 49: India Software-Defined Wide Area Network Industry Revenue (Million) Forecast, by Application 2019 & 2032
- Table 50: India Software-Defined Wide Area Network Industry Volume (K Unit) Forecast, by Application 2019 & 2032
- Table 51: South Korea Software-Defined Wide Area Network Industry Revenue (Million) Forecast, by Application 2019 & 2032
- Table 52: South Korea Software-Defined Wide Area Network Industry Volume (K Unit) Forecast, by Application 2019 & 2032
- Table 53: Southeast Asia Software-Defined Wide Area Network Industry Revenue (Million) Forecast, by Application 2019 & 2032
- Table 54: Southeast Asia Software-Defined Wide Area Network Industry Volume (K Unit) Forecast, by Application 2019 & 2032
- Table 55: Australia Software-Defined Wide Area Network Industry Revenue (Million) Forecast, by Application 2019 & 2032
- Table 56: Australia Software-Defined Wide Area Network Industry Volume (K Unit) Forecast, by Application 2019 & 2032
- Table 57: Indonesia Software-Defined Wide Area Network Industry Revenue (Million) Forecast, by Application 2019 & 2032
- Table 58: Indonesia Software-Defined Wide Area Network Industry Volume (K Unit) Forecast, by Application 2019 & 2032
- Table 59: Phillipes Software-Defined Wide Area Network Industry Revenue (Million) Forecast, by Application 2019 & 2032
- Table 60: Phillipes Software-Defined Wide Area Network Industry Volume (K Unit) Forecast, by Application 2019 & 2032
- Table 61: Singapore Software-Defined Wide Area Network Industry Revenue (Million) Forecast, by Application 2019 & 2032
- Table 62: Singapore Software-Defined Wide Area Network Industry Volume (K Unit) Forecast, by Application 2019 & 2032
- Table 63: Thailandc Software-Defined Wide Area Network Industry Revenue (Million) Forecast, by Application 2019 & 2032
- Table 64: Thailandc Software-Defined Wide Area Network Industry Volume (K Unit) Forecast, by Application 2019 & 2032
- Table 65: Rest of Asia Pacific Software-Defined Wide Area Network Industry Revenue (Million) Forecast, by Application 2019 & 2032
- Table 66: Rest of Asia Pacific Software-Defined Wide Area Network Industry Volume (K Unit) Forecast, by Application 2019 & 2032
- Table 67: Global Software-Defined Wide Area Network Industry Revenue Million Forecast, by Country 2019 & 2032
- Table 68: Global Software-Defined Wide Area Network Industry Volume K Unit Forecast, by Country 2019 & 2032
- Table 69: Brazil Software-Defined Wide Area Network Industry Revenue (Million) Forecast, by Application 2019 & 2032
- Table 70: Brazil Software-Defined Wide Area Network Industry Volume (K Unit) Forecast, by Application 2019 & 2032
- Table 71: Argentina Software-Defined Wide Area Network Industry Revenue (Million) Forecast, by Application 2019 & 2032
- Table 72: Argentina Software-Defined Wide Area Network Industry Volume (K Unit) Forecast, by Application 2019 & 2032
- Table 73: Peru Software-Defined Wide Area Network Industry Revenue (Million) Forecast, by Application 2019 & 2032
- Table 74: Peru Software-Defined Wide Area Network Industry Volume (K Unit) Forecast, by Application 2019 & 2032
- Table 75: Chile Software-Defined Wide Area Network Industry Revenue (Million) Forecast, by Application 2019 & 2032
- Table 76: Chile Software-Defined Wide Area Network Industry Volume (K Unit) Forecast, by Application 2019 & 2032
- Table 77: Colombia Software-Defined Wide Area Network Industry Revenue (Million) Forecast, by Application 2019 & 2032
- Table 78: Colombia Software-Defined Wide Area Network Industry Volume (K Unit) Forecast, by Application 2019 & 2032
- Table 79: Ecuador Software-Defined Wide Area Network Industry Revenue (Million) Forecast, by Application 2019 & 2032
- Table 80: Ecuador Software-Defined Wide Area Network Industry Volume (K Unit) Forecast, by Application 2019 & 2032
- Table 81: Venezuela Software-Defined Wide Area Network Industry Revenue (Million) Forecast, by Application 2019 & 2032
- Table 82: Venezuela Software-Defined Wide Area Network Industry Volume (K Unit) Forecast, by Application 2019 & 2032
- Table 83: Rest of South America Software-Defined Wide Area Network Industry Revenue (Million) Forecast, by Application 2019 & 2032
- Table 84: Rest of South America Software-Defined Wide Area Network Industry Volume (K Unit) Forecast, by Application 2019 & 2032
- Table 85: Global Software-Defined Wide Area Network Industry Revenue Million Forecast, by Country 2019 & 2032
- Table 86: Global Software-Defined Wide Area Network Industry Volume K Unit Forecast, by Country 2019 & 2032
- Table 87: United States Software-Defined Wide Area Network Industry Revenue (Million) Forecast, by Application 2019 & 2032
- Table 88: United States Software-Defined Wide Area Network Industry Volume (K Unit) Forecast, by Application 2019 & 2032
- Table 89: Canada Software-Defined Wide Area Network Industry Revenue (Million) Forecast, by Application 2019 & 2032
- Table 90: Canada Software-Defined Wide Area Network Industry Volume (K Unit) Forecast, by Application 2019 & 2032
- Table 91: Mexico Software-Defined Wide Area Network Industry Revenue (Million) Forecast, by Application 2019 & 2032
- Table 92: Mexico Software-Defined Wide Area Network Industry Volume (K Unit) Forecast, by Application 2019 & 2032
- Table 93: Global Software-Defined Wide Area Network Industry Revenue Million Forecast, by Country 2019 & 2032
- Table 94: Global Software-Defined Wide Area Network Industry Volume K Unit Forecast, by Country 2019 & 2032
- Table 95: United Arab Emirates Software-Defined Wide Area Network Industry Revenue (Million) Forecast, by Application 2019 & 2032
- Table 96: United Arab Emirates Software-Defined Wide Area Network Industry Volume (K Unit) Forecast, by Application 2019 & 2032
- Table 97: Saudi Arabia Software-Defined Wide Area Network Industry Revenue (Million) Forecast, by Application 2019 & 2032
- Table 98: Saudi Arabia Software-Defined Wide Area Network Industry Volume (K Unit) Forecast, by Application 2019 & 2032
- Table 99: South Africa Software-Defined Wide Area Network Industry Revenue (Million) Forecast, by Application 2019 & 2032
- Table 100: South Africa Software-Defined Wide Area Network Industry Volume (K Unit) Forecast, by Application 2019 & 2032
- Table 101: Rest of Middle East and Africa Software-Defined Wide Area Network Industry Revenue (Million) Forecast, by Application 2019 & 2032
- Table 102: Rest of Middle East and Africa Software-Defined Wide Area Network Industry Volume (K Unit) Forecast, by Application 2019 & 2032
- Table 103: Global Software-Defined Wide Area Network Industry Revenue Million Forecast, by Deployment Mode 2019 & 2032
- Table 104: Global Software-Defined Wide Area Network Industry Volume K Unit Forecast, by Deployment Mode 2019 & 2032
- Table 105: Global Software-Defined Wide Area Network Industry Revenue Million Forecast, by Component Type 2019 & 2032
- Table 106: Global Software-Defined Wide Area Network Industry Volume K Unit Forecast, by Component Type 2019 & 2032
- Table 107: Global Software-Defined Wide Area Network Industry Revenue Million Forecast, by Organisation Size 2019 & 2032
- Table 108: Global Software-Defined Wide Area Network Industry Volume K Unit Forecast, by Organisation Size 2019 & 2032
- Table 109: Global Software-Defined Wide Area Network Industry Revenue Million Forecast, by End-user Industry 2019 & 2032
- Table 110: Global Software-Defined Wide Area Network Industry Volume K Unit Forecast, by End-user Industry 2019 & 2032
- Table 111: Global Software-Defined Wide Area Network Industry Revenue Million Forecast, by Country 2019 & 2032
- Table 112: Global Software-Defined Wide Area Network Industry Volume K Unit Forecast, by Country 2019 & 2032
- Table 113: United States Software-Defined Wide Area Network Industry Revenue (Million) Forecast, by Application 2019 & 2032
- Table 114: United States Software-Defined Wide Area Network Industry Volume (K Unit) Forecast, by Application 2019 & 2032
- Table 115: Canada Software-Defined Wide Area Network Industry Revenue (Million) Forecast, by Application 2019 & 2032
- Table 116: Canada Software-Defined Wide Area Network Industry Volume (K Unit) Forecast, by Application 2019 & 2032
- Table 117: Mexico Software-Defined Wide Area Network Industry Revenue (Million) Forecast, by Application 2019 & 2032
- Table 118: Mexico Software-Defined Wide Area Network Industry Volume (K Unit) Forecast, by Application 2019 & 2032
- Table 119: Rest of North America Software-Defined Wide Area Network Industry Revenue (Million) Forecast, by Application 2019 & 2032
- Table 120: Rest of North America Software-Defined Wide Area Network Industry Volume (K Unit) Forecast, by Application 2019 & 2032
- Table 121: Global Software-Defined Wide Area Network Industry Revenue Million Forecast, by Deployment Mode 2019 & 2032
- Table 122: Global Software-Defined Wide Area Network Industry Volume K Unit Forecast, by Deployment Mode 2019 & 2032
- Table 123: Global Software-Defined Wide Area Network Industry Revenue Million Forecast, by Component Type 2019 & 2032
- Table 124: Global Software-Defined Wide Area Network Industry Volume K Unit Forecast, by Component Type 2019 & 2032
- Table 125: Global Software-Defined Wide Area Network Industry Revenue Million Forecast, by Organisation Size 2019 & 2032
- Table 126: Global Software-Defined Wide Area Network Industry Volume K Unit Forecast, by Organisation Size 2019 & 2032
- Table 127: Global Software-Defined Wide Area Network Industry Revenue Million Forecast, by End-user Industry 2019 & 2032
- Table 128: Global Software-Defined Wide Area Network Industry Volume K Unit Forecast, by End-user Industry 2019 & 2032
- Table 129: Global Software-Defined Wide Area Network Industry Revenue Million Forecast, by Country 2019 & 2032
- Table 130: Global Software-Defined Wide Area Network Industry Volume K Unit Forecast, by Country 2019 & 2032
- Table 131: United Kingdom Software-Defined Wide Area Network Industry Revenue (Million) Forecast, by Application 2019 & 2032
- Table 132: United Kingdom Software-Defined Wide Area Network Industry Volume (K Unit) Forecast, by Application 2019 & 2032
- Table 133: France Software-Defined Wide Area Network Industry Revenue (Million) Forecast, by Application 2019 & 2032
- Table 134: France Software-Defined Wide Area Network Industry Volume (K Unit) Forecast, by Application 2019 & 2032
- Table 135: Germany Software-Defined Wide Area Network Industry Revenue (Million) Forecast, by Application 2019 & 2032
- Table 136: Germany Software-Defined Wide Area Network Industry Volume (K Unit) Forecast, by Application 2019 & 2032
- Table 137: Rest of Europe Software-Defined Wide Area Network Industry Revenue (Million) Forecast, by Application 2019 & 2032
- Table 138: Rest of Europe Software-Defined Wide Area Network Industry Volume (K Unit) Forecast, by Application 2019 & 2032
- Table 139: Global Software-Defined Wide Area Network Industry Revenue Million Forecast, by Deployment Mode 2019 & 2032
- Table 140: Global Software-Defined Wide Area Network Industry Volume K Unit Forecast, by Deployment Mode 2019 & 2032
- Table 141: Global Software-Defined Wide Area Network Industry Revenue Million Forecast, by Component Type 2019 & 2032
- Table 142: Global Software-Defined Wide Area Network Industry Volume K Unit Forecast, by Component Type 2019 & 2032
- Table 143: Global Software-Defined Wide Area Network Industry Revenue Million Forecast, by Organisation Size 2019 & 2032
- Table 144: Global Software-Defined Wide Area Network Industry Volume K Unit Forecast, by Organisation Size 2019 & 2032
- Table 145: Global Software-Defined Wide Area Network Industry Revenue Million Forecast, by End-user Industry 2019 & 2032
- Table 146: Global Software-Defined Wide Area Network Industry Volume K Unit Forecast, by End-user Industry 2019 & 2032
- Table 147: Global Software-Defined Wide Area Network Industry Revenue Million Forecast, by Country 2019 & 2032
- Table 148: Global Software-Defined Wide Area Network Industry Volume K Unit Forecast, by Country 2019 & 2032
- Table 149: China Software-Defined Wide Area Network Industry Revenue (Million) Forecast, by Application 2019 & 2032
- Table 150: China Software-Defined Wide Area Network Industry Volume (K Unit) Forecast, by Application 2019 & 2032
- Table 151: India Software-Defined Wide Area Network Industry Revenue (Million) Forecast, by Application 2019 & 2032
- Table 152: India Software-Defined Wide Area Network Industry Volume (K Unit) Forecast, by Application 2019 & 2032
- Table 153: Japan Software-Defined Wide Area Network Industry Revenue (Million) Forecast, by Application 2019 & 2032
- Table 154: Japan Software-Defined Wide Area Network Industry Volume (K Unit) Forecast, by Application 2019 & 2032
- Table 155: Australia Software-Defined Wide Area Network Industry Revenue (Million) Forecast, by Application 2019 & 2032
- Table 156: Australia Software-Defined Wide Area Network Industry Volume (K Unit) Forecast, by Application 2019 & 2032
- Table 157: South Korea Software-Defined Wide Area Network Industry Revenue (Million) Forecast, by Application 2019 & 2032
- Table 158: South Korea Software-Defined Wide Area Network Industry Volume (K Unit) Forecast, by Application 2019 & 2032
- Table 159: Rest of Asia Pacific Software-Defined Wide Area Network Industry Revenue (Million) Forecast, by Application 2019 & 2032
- Table 160: Rest of Asia Pacific Software-Defined Wide Area Network Industry Volume (K Unit) Forecast, by Application 2019 & 2032
- Table 161: Global Software-Defined Wide Area Network Industry Revenue Million Forecast, by Deployment Mode 2019 & 2032
- Table 162: Global Software-Defined Wide Area Network Industry Volume K Unit Forecast, by Deployment Mode 2019 & 2032
- Table 163: Global Software-Defined Wide Area Network Industry Revenue Million Forecast, by Component Type 2019 & 2032
- Table 164: Global Software-Defined Wide Area Network Industry Volume K Unit Forecast, by Component Type 2019 & 2032
- Table 165: Global Software-Defined Wide Area Network Industry Revenue Million Forecast, by Organisation Size 2019 & 2032
- Table 166: Global Software-Defined Wide Area Network Industry Volume K Unit Forecast, by Organisation Size 2019 & 2032
- Table 167: Global Software-Defined Wide Area Network Industry Revenue Million Forecast, by End-user Industry 2019 & 2032
- Table 168: Global Software-Defined Wide Area Network Industry Volume K Unit Forecast, by End-user Industry 2019 & 2032
- Table 169: Global Software-Defined Wide Area Network Industry Revenue Million Forecast, by Country 2019 & 2032
- Table 170: Global Software-Defined Wide Area Network Industry Volume K Unit Forecast, by Country 2019 & 2032
- Table 171: Brazil Software-Defined Wide Area Network Industry Revenue (Million) Forecast, by Application 2019 & 2032
- Table 172: Brazil Software-Defined Wide Area Network Industry Volume (K Unit) Forecast, by Application 2019 & 2032
- Table 173: Mexico Software-Defined Wide Area Network Industry Revenue (Million) Forecast, by Application 2019 & 2032
- Table 174: Mexico Software-Defined Wide Area Network Industry Volume (K Unit) Forecast, by Application 2019 & 2032
- Table 175: Rest of Latin America Software-Defined Wide Area Network Industry Revenue (Million) Forecast, by Application 2019 & 2032
- Table 176: Rest of Latin America Software-Defined Wide Area Network Industry Volume (K Unit) Forecast, by Application 2019 & 2032
- Table 177: Global Software-Defined Wide Area Network Industry Revenue Million Forecast, by Deployment Mode 2019 & 2032
- Table 178: Global Software-Defined Wide Area Network Industry Volume K Unit Forecast, by Deployment Mode 2019 & 2032
- Table 179: Global Software-Defined Wide Area Network Industry Revenue Million Forecast, by Component Type 2019 & 2032
- Table 180: Global Software-Defined Wide Area Network Industry Volume K Unit Forecast, by Component Type 2019 & 2032
- Table 181: Global Software-Defined Wide Area Network Industry Revenue Million Forecast, by Organisation Size 2019 & 2032
- Table 182: Global Software-Defined Wide Area Network Industry Volume K Unit Forecast, by Organisation Size 2019 & 2032
- Table 183: Global Software-Defined Wide Area Network Industry Revenue Million Forecast, by End-user Industry 2019 & 2032
- Table 184: Global Software-Defined Wide Area Network Industry Volume K Unit Forecast, by End-user Industry 2019 & 2032
- Table 185: Global Software-Defined Wide Area Network Industry Revenue Million Forecast, by Country 2019 & 2032
- Table 186: Global Software-Defined Wide Area Network Industry Volume K Unit Forecast, by Country 2019 & 2032
- Table 187: UAE Software-Defined Wide Area Network Industry Revenue (Million) Forecast, by Application 2019 & 2032
- Table 188: UAE Software-Defined Wide Area Network Industry Volume (K Unit) Forecast, by Application 2019 & 2032
- Table 189: South Africa Software-Defined Wide Area Network Industry Revenue (Million) Forecast, by Application 2019 & 2032
- Table 190: South Africa Software-Defined Wide Area Network Industry Volume (K Unit) Forecast, by Application 2019 & 2032
- Table 191: Saudi Arabia Software-Defined Wide Area Network Industry Revenue (Million) Forecast, by Application 2019 & 2032
- Table 192: Saudi Arabia Software-Defined Wide Area Network Industry Volume (K Unit) Forecast, by Application 2019 & 2032
- Table 193: Rest Of MEA Software-Defined Wide Area Network Industry Revenue (Million) Forecast, by Application 2019 & 2032
- Table 194: Rest Of MEA Software-Defined Wide Area Network Industry Volume (K Unit) Forecast, by Application 2019 & 2032
Frequently Asked Questions
1. What is the projected Compound Annual Growth Rate (CAGR) of the Software-Defined Wide Area Network Industry?
The projected CAGR is approximately 31.20%.
2. Which companies are prominent players in the Software-Defined Wide Area Network Industry?
Key companies in the market include Cisco, Aryaka, Hewlett Packard Enterprise, Tata Communications, Fortinet, Huawei, Ericsson, vmware, Nokia, MCM Telecom.
3. What are the main segments of the Software-Defined Wide Area Network Industry?
The market segments include Deployment Mode, Component Type, Organisation Size, End-user Industry.
4. Can you provide details about the market size?
The market size is estimated to be USD XX Million as of 2022.
5. What are some drivers contributing to market growth?
Increased Number of Cloud-based Solution; Simplified Network Solution; Growing Demand for Mobility Services.
6. What are the notable trends driving market growth?
Enterprise Sector will Add to the SD-WAN Market Growth.
7. Are there any restraints impacting market growth?
Data Security; Lack of Qualified Trainers.
8. Can you provide examples of recent developments in the market?
Dec 2022: Five new managed security service providers (MSSP), namely B.Online, Cirion, ngena, PT&T, and Telefónica, adopted Fortinet Secure SD-WAN to help drive better business outcomes and experiences for their customers. Fortinet is a global leader in broad, integrated, and automated cybersecurity solutions. Fortinet Secure SD-WAN will provide the MSSPs Secure Networks in present as well as future years.
9. What pricing options are available for accessing the report?
Pricing options include single-user, multi-user, and enterprise licenses priced at USD 4750, USD 5250, and USD 8750 respectively.
10. Is the market size provided in terms of value or volume?
The market size is provided in terms of value, measured in Million and volume, measured in K Unit.
11. Are there any specific market keywords associated with the report?
Yes, the market keyword associated with the report is "Software-Defined Wide Area Network Industry," which aids in identifying and referencing the specific market segment covered.
12. How do I determine which pricing option suits my needs best?
The pricing options vary based on user requirements and access needs. Individual users may opt for single-user licenses, while businesses requiring broader access may choose multi-user or enterprise licenses for cost-effective access to the report.
13. Are there any additional resources or data provided in the Software-Defined Wide Area Network Industry report?
While the report offers comprehensive insights, it's advisable to review the specific contents or supplementary materials provided to ascertain if additional resources or data are available.
14. How can I stay updated on further developments or reports in the Software-Defined Wide Area Network Industry?
To stay informed about further developments, trends, and reports in the Software-Defined Wide Area Network Industry, consider subscribing to industry newsletters, following relevant companies and organizations, or regularly checking reputable industry news sources and publications.
Methodology
Step 1 - Identification of Relevant Samples Size from Population Database


Step 2 - Approaches for Defining Global Market Size (Value, Volume* & Price*)

Note*: In applicable scenarios
Step 3 - Data Sources
Primary Research
- Web Analytics
- Survey Reports
- Research Institute
- Latest Research Reports
- Opinion Leaders
Secondary Research
- Annual Reports
- White Paper
- Latest Press Release
- Industry Association
- Paid Database
- Investor Presentations

Step 4 - Data Triangulation
Involves using different sources of information in order to increase the validity of a study
These sources are likely to be stakeholders in a program - participants, other researchers, program staff, other community members, and so on.
Then we put all data in single framework & apply various statistical tools to find out the dynamic on the market.
During the analysis stage, feedback from the stakeholder groups would be compared to determine areas of agreement as well as areas of divergence


