Smartphone Camera Lenses Industry Market Predictions and Opportunities 2025-2033

Smartphone Camera Lenses Industry by Production Analysis, by Consumption Analysis, by Import Market Analysis (Value & Volume), by Export Market Analysis (Value & Volume), by Price Trend Analysis, by Asia Pacific, by Americas, by Europe, by Rest of the World Forecast 2025-2033

Jun 24 2025
Base Year: 2024

234 Pages
Main Logo

Smartphone Camera Lenses Industry Market Predictions and Opportunities 2025-2033


Home
Industries
Technology, Media and Telecom
sponsor image
sponsor image
sponsor image
sponsor image
sponsor image
sponsor image
sponsor image
sponsor image
sponsor image
sponsor image
sponsor image
sponsor image
sponsor image
sponsor image
sponsor image
sponsor image
sponsor image
sponsor image
sponsor image
sponsor image

Tailored for you

  • In-depth Analysis Tailored to Specified Regions or Segments
  • Company Profiles Customized to User Preferences
  • Comprehensive Insights Focused on Specific Segments or Regions
  • Customized Evaluation of Competitive Landscape to Meet Your Needs
  • Tailored Customization to Address Other Specific Requirements
Ask for customization


Key Insights

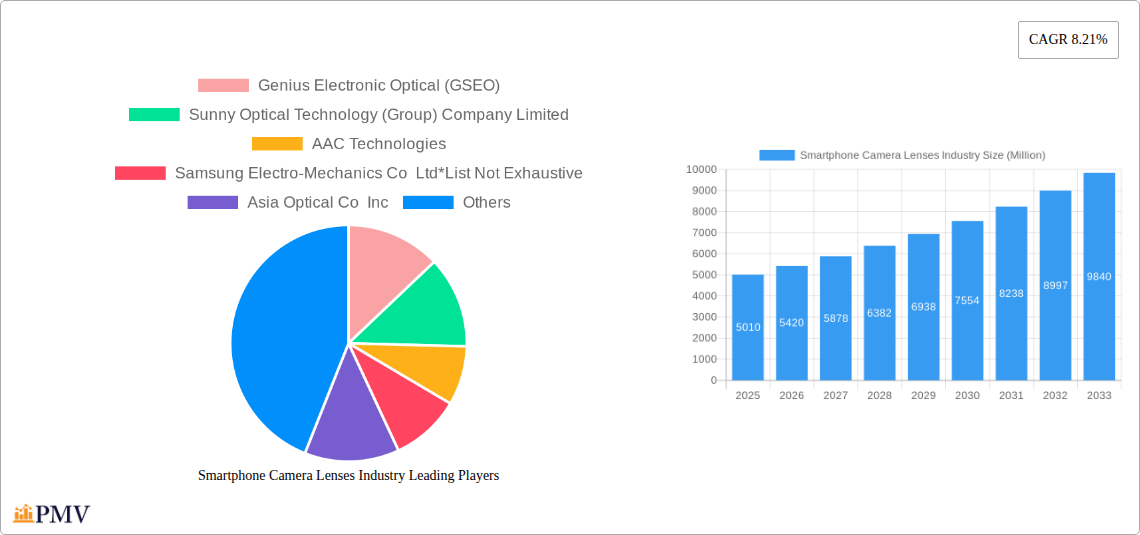
The global smartphone camera lens market, valued at $5.01 billion in 2025, is projected to experience robust growth, driven by several key factors. The increasing demand for high-resolution and advanced camera features in smartphones, fueled by the rise of mobile photography and videography, is a primary driver. Consumers are increasingly prioritizing camera quality when selecting a smartphone, pushing manufacturers to integrate superior lens technology. Technological advancements, including the development of multi-lens systems (wide-angle, telephoto, macro), improved image stabilization, and enhanced low-light performance, are further stimulating market expansion. The integration of artificial intelligence (AI) and computational photography features within smartphone cameras also enhances image quality and creates new market opportunities. The market is segmented by lens type (wide-angle, telephoto, macro, fixed-focus) and end-use (smartphones, tablets, laptops), with smartphones currently dominating the market share. Significant growth is anticipated in regions like Asia-Pacific, particularly China and India, driven by rising smartphone penetration and increasing disposable incomes. However, challenges such as fluctuating raw material prices and intense competition among lens manufacturers could potentially restrain market growth to some extent. The forecast period (2025-2033) anticipates a consistent expansion fueled by ongoing technological innovation and the persistent demand for enhanced mobile photography capabilities.

The competitive landscape is characterized by a mix of established players like Sunny Optical, Largan Precision, and LG Innotek, alongside emerging companies vying for market share. These companies are continuously investing in research and development to improve lens technology, offering innovative features like periscope lenses and improved autofocus mechanisms. The market's future trajectory depends heavily on technological advancements, evolving consumer preferences, and the strategic actions of key players. Maintaining a competitive edge requires manufacturers to adapt swiftly to evolving market demands and invest in next-generation lens technologies to ensure sustained growth in the coming years. A crucial aspect for future success will be the ability to offer cost-effective yet high-quality lenses to cater to the broad spectrum of smartphone price points.

Smartphone Camera Lenses Industry Research Report - Market Size, Growth & Forecast

Smartphone Camera Lenses Industry: A Comprehensive Market Report (2019-2033)

This in-depth report provides a comprehensive analysis of the global Smartphone Camera Lenses industry, offering invaluable insights for stakeholders, investors, and industry professionals. The study period covers 2019-2033, with 2025 as the base and estimated year. The report projects a market value exceeding xx Million by 2033, fueled by technological advancements and increasing smartphone adoption.

Smartphone Camera Lenses Industry Market Structure & Competitive Dynamics

The Smartphone Camera Lenses market exhibits a moderately concentrated structure, with key players like Genius Electronic Optical (GSEO), Sunny Optical Technology (Group) Company Limited, AAC Technologies, Samsung Electro-Mechanics Co Ltd, Asia Optical Co Inc, Ofilm Group Co Ltd, Largan Precision Company Limited, SEKONIX Co Ltd, Kantatsu Co Ltd (Sharp Corporation), Haesung Optics Co Ltd, LG Innotek, and Kinko Optical Co Ltd holding significant market share. The combined market share of the top five players is estimated at xx%, indicating a competitive landscape. Innovation ecosystems are crucial, with companies investing heavily in R&D for advanced lens technologies like periscope lenses and improved image stabilization. Regulatory frameworks, particularly concerning material sourcing and environmental standards, influence operational costs and strategies. The market sees continuous product substitution, with advancements in lens materials and designs constantly replacing older technologies. End-user trends, particularly towards higher megapixel counts and improved low-light photography, are key drivers of innovation. Mergers and acquisitions (M&A) activity remains relatively modest, with deal values averaging around xx Million per transaction in the historical period (2019-2024). However, strategic partnerships are becoming increasingly prevalent for accessing new technologies and markets.

  • Market Concentration: Top 5 players hold approximately xx% market share.
  • M&A Activity: Average deal value: xx Million (2019-2024).
  • Innovation Focus: Periscope lenses, improved image stabilization, advanced materials.
  • Regulatory Landscape: Environmental standards and material sourcing regulations are key factors.

Smartphone Camera Lenses Industry Industry Trends & Insights

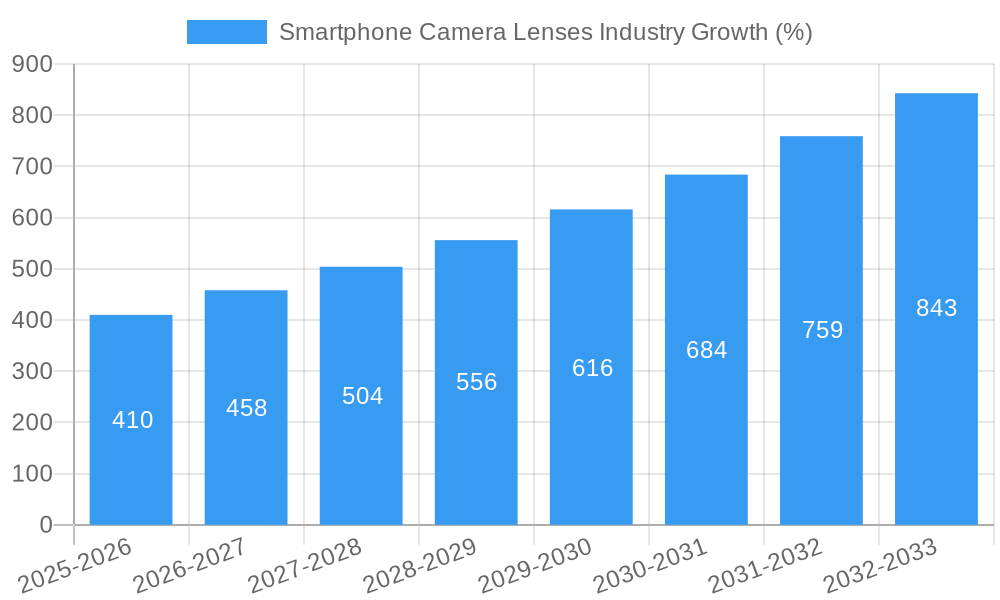
The Smartphone Camera Lenses market is experiencing robust growth, with a projected Compound Annual Growth Rate (CAGR) of xx% during the forecast period (2025-2033). This growth is fueled by several key factors: the rising adoption of smartphones globally, particularly in emerging markets; the increasing demand for high-quality camera features in smartphones; and continuous technological advancements leading to better image quality, zoom capabilities, and low-light performance. Disruptive technologies such as AI-powered image processing, improved sensor technology, and the integration of multiple lenses in a single camera module are driving market penetration. Consumer preference is shifting towards slimmer, lighter smartphone designs, which presents both challenges and opportunities for lens manufacturers. The market is highly competitive, with companies focusing on differentiation through technological innovation, cost optimization, and strategic partnerships. Market penetration of advanced features like periscope zoom lenses is steadily increasing, currently estimated at xx%.

Smartphone Camera Lenses Industry Growth

Dominant Markets & Segments in Smartphone Camera Lenses Industry

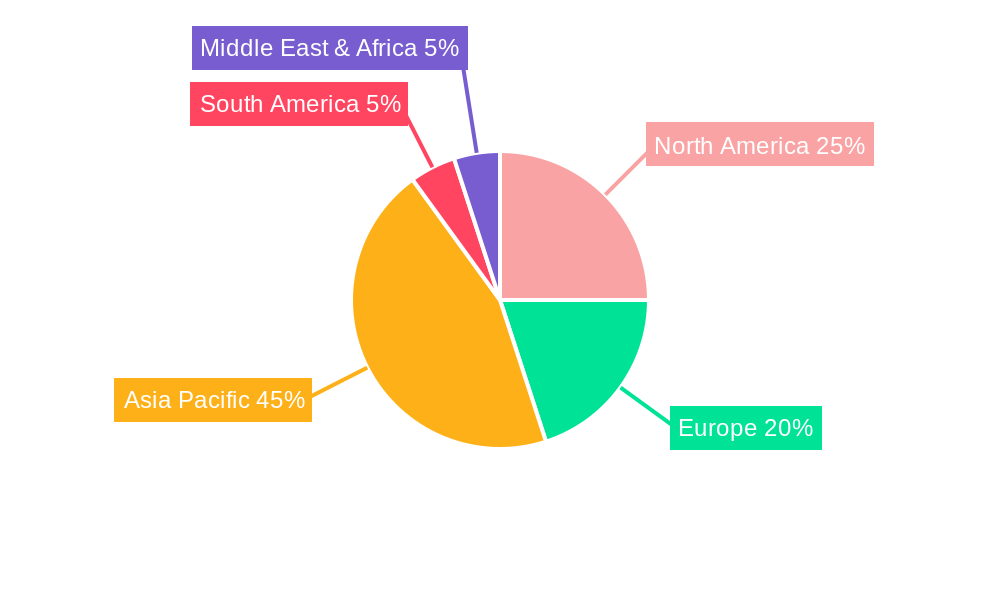
The Asia-Pacific region dominates the Smartphone Camera Lenses market, driven by a large and rapidly growing smartphone market, extensive manufacturing capabilities, and supportive government policies. Within the region, China and India are particularly significant. The smartphone segment holds the largest market share within the end-use categories, surpassing Tablets and Laptops due to the higher integration of advanced camera systems and features.

Key Drivers for Asia-Pacific Dominance:

  • High Smartphone Adoption: Rapid growth in smartphone ownership and penetration.
  • Manufacturing Hub: Concentrated manufacturing facilities and supply chain.
  • Favorable Government Policies: Incentives and support for technological advancements.

Segment Dominance Analysis:

  • By Lens Type: Wide-angle lenses currently hold the largest market share due to their versatility in everyday photography. However, telephoto lenses are experiencing the fastest growth rate due to the increasing demand for high-quality zoom capabilities.
  • By End-Use: Smartphones represent the dominant segment, driven by increasing consumer demand for enhanced camera functionality in portable devices.

Smartphone Camera Lenses Industry Product Innovations

Recent innovations in smartphone camera lenses include the integration of AI-powered image processing algorithms, enabling features like improved night mode photography and enhanced portrait mode capabilities. Periscope lenses offer significant zoom capabilities in compact form factors. The development of advanced materials is leading to lenses that are both more durable and capable of delivering superior image quality. These innovations are enhancing market fit by aligning with consumer preferences for improved image quality and functionality.

Report Segmentation & Scope

This report segments the Smartphone Camera Lenses market by lens type (Wide-angle Lenses, Telephoto Lenses, Macro Lenses, Fixed-Focus Lenses) and by end-use (Smartphones, Tablets, Laptops). Each segment's growth projections, market size, and competitive dynamics are analyzed in detail. The wide-angle lens segment is projected to hold the largest market share in 2025 but will experience significant competition from telephoto lenses, which are experiencing faster growth. The smartphone segment dominates the end-use market with substantial growth projected throughout the forecast period.

Key Drivers of Smartphone Camera Lenses Industry Growth

Several key factors drive the growth of the Smartphone Camera Lenses industry: technological advancements like improved sensor technology, AI-powered image processing, and innovative lens designs; increasing smartphone adoption globally, particularly in emerging markets; rising consumer demand for high-quality camera features; and supportive government policies promoting technological advancements in various regions. The integration of multiple camera systems (triple, quad, and penta) also boosts demand for specialized lenses.

Challenges in the Smartphone Camera Lenses Industry Sector

The Smartphone Camera Lenses industry faces challenges such as intense competition, requiring continuous innovation and cost optimization; supply chain disruptions impacting component availability and production costs; fluctuations in raw material prices; and stringent regulatory requirements regarding environmental standards and material sourcing. The increasing complexity of lens modules also necessitates ongoing investment in R&D. The estimated negative impact of these factors on market growth during the forecast period is xx%.

Leading Players in the Smartphone Camera Lenses Industry Market

  • Genius Electronic Optical (GSEO)
  • Sunny Optical Technology (Group) Company Limited
  • AAC Technologies
  • Samsung Electro-Mechanics Co Ltd
  • Asia Optical Co Inc
  • Ofilm Group Co Ltd
  • Largan Precision Company Limited
  • SEKONIX Co Ltd
  • Kantatsu Co Ltd (Sharp Corporation)
  • Haesung Optics Co Ltd
  • LG Innotek
  • Kinko Optical Co Ltd

Key Developments in Smartphone Camera Lenses Industry Sector

  • October 2023: Google's Pixel 8 series launch showcases AI-powered image processing for enhanced group photos. Samsung's Galaxy S22 Ultra utilizes approximately 60 AI models for superior camera functionality, enhancing night photography.
  • April 2023: OnePlus Nord CE 3 Lite launch features a triple-camera setup, reflecting a trend toward multiple-camera smartphones. The increasing popularity of quad-camera smartphones highlights innovation in lens technology and integration.

Strategic Smartphone Camera Lenses Industry Market Outlook

The Smartphone Camera Lenses market holds significant future potential, driven by technological innovations like augmented reality (AR) integration and improved computational photography capabilities. Strategic opportunities exist for companies to focus on developing advanced lens technologies, improving manufacturing efficiency, and expanding into emerging markets. Partnerships and collaborations will be crucial to accelerating innovation and meeting the rising demand for high-quality smartphone camera lenses.

Smartphone Camera Lenses Industry Segmentation

  • 1. Production Analysis
  • 2. Consumption Analysis
  • 3. Import Market Analysis (Value & Volume)
  • 4. Export Market Analysis (Value & Volume)
  • 5. Price Trend Analysis

Smartphone Camera Lenses Industry Segmentation By Geography

  • 1. Asia Pacific
  • 2. Americas
  • 3. Europe
  • 4. Rest of the World
Smartphone Camera Lenses Industry Regional Share


Smartphone Camera Lenses Industry REPORT HIGHLIGHTS

AspectsDetails
Study Period 2019-2033
Base Year 2024
Estimated Year 2025
Forecast Period2025-2033
Historical Period2019-2024
Growth RateCAGR of 8.21% from 2019-2033
Segmentation
    • By Production Analysis
    • By Consumption Analysis
    • By Import Market Analysis (Value & Volume)
    • By Export Market Analysis (Value & Volume)
    • By Price Trend Analysis
  • By Geography
    • Asia Pacific
    • Americas
    • Europe
    • Rest of the World


Table of Contents

  1. 1. Introduction
    • 1.1. Research Scope
    • 1.2. Market Segmentation
    • 1.3. Research Methodology
    • 1.4. Definitions and Assumptions
  2. 2. Executive Summary
    • 2.1. Introduction
  3. 3. Market Dynamics
    • 3.1. Introduction
      • 3.2. Market Drivers
        • 3.2.1. Increasing Popularity of Multiple Camera Smartphones and the Introduction of Advanced Camera Technologies
      • 3.3. Market Restrains
        • 3.3.1. Slow Down of Smartphone Sales and Increasing Pricing Competition
      • 3.4. Market Trends
        • 3.4.1. Increasing Popularity of Multiple Camera Smartphones and the Introduction of Advanced Camera Technologies will Drive the Market
  4. 4. Market Factor Analysis
    • 4.1. Porters Five Forces
    • 4.2. Supply/Value Chain
    • 4.3. PESTEL analysis
    • 4.4. Market Entropy
    • 4.5. Patent/Trademark Analysis
  5. 5. Global Smartphone Camera Lenses Industry Analysis, Insights and Forecast, 2019-2031
    • 5.1. Market Analysis, Insights and Forecast - by Production Analysis
      • 5.2. Market Analysis, Insights and Forecast - by Consumption Analysis
        • 5.3. Market Analysis, Insights and Forecast - by Import Market Analysis (Value & Volume)
          • 5.4. Market Analysis, Insights and Forecast - by Export Market Analysis (Value & Volume)
            • 5.5. Market Analysis, Insights and Forecast - by Price Trend Analysis
              • 5.6. Market Analysis, Insights and Forecast - by Region
                • 5.6.1. Asia Pacific
                • 5.6.2. Americas
                • 5.6.3. Europe
                • 5.6.4. Rest of the World
            • 6. Asia Pacific Smartphone Camera Lenses Industry Analysis, Insights and Forecast, 2019-2031
              • 6.1. Market Analysis, Insights and Forecast - by Production Analysis
                • 6.2. Market Analysis, Insights and Forecast - by Consumption Analysis
                  • 6.3. Market Analysis, Insights and Forecast - by Import Market Analysis (Value & Volume)
                    • 6.4. Market Analysis, Insights and Forecast - by Export Market Analysis (Value & Volume)
                      • 6.5. Market Analysis, Insights and Forecast - by Price Trend Analysis
                      • 7. Americas Smartphone Camera Lenses Industry Analysis, Insights and Forecast, 2019-2031
                        • 7.1. Market Analysis, Insights and Forecast - by Production Analysis
                          • 7.2. Market Analysis, Insights and Forecast - by Consumption Analysis
                            • 7.3. Market Analysis, Insights and Forecast - by Import Market Analysis (Value & Volume)
                              • 7.4. Market Analysis, Insights and Forecast - by Export Market Analysis (Value & Volume)
                                • 7.5. Market Analysis, Insights and Forecast - by Price Trend Analysis
                                • 8. Europe Smartphone Camera Lenses Industry Analysis, Insights and Forecast, 2019-2031
                                  • 8.1. Market Analysis, Insights and Forecast - by Production Analysis
                                    • 8.2. Market Analysis, Insights and Forecast - by Consumption Analysis
                                      • 8.3. Market Analysis, Insights and Forecast - by Import Market Analysis (Value & Volume)
                                        • 8.4. Market Analysis, Insights and Forecast - by Export Market Analysis (Value & Volume)
                                          • 8.5. Market Analysis, Insights and Forecast - by Price Trend Analysis
                                          • 9. Rest of the World Smartphone Camera Lenses Industry Analysis, Insights and Forecast, 2019-2031
                                            • 9.1. Market Analysis, Insights and Forecast - by Production Analysis
                                              • 9.2. Market Analysis, Insights and Forecast - by Consumption Analysis
                                                • 9.3. Market Analysis, Insights and Forecast - by Import Market Analysis (Value & Volume)
                                                  • 9.4. Market Analysis, Insights and Forecast - by Export Market Analysis (Value & Volume)
                                                    • 9.5. Market Analysis, Insights and Forecast - by Price Trend Analysis
                                                    • 10. Asia Pacific Smartphone Camera Lenses Industry Analysis, Insights and Forecast, 2019-2031
                                                        • 10.1. Market Analysis, Insights and Forecast - By Country/Sub-region
                                                          • 10.1.1 China
                                                          • 10.1.2 Japan
                                                          • 10.1.3 India
                                                          • 10.1.4 South Korea
                                                          • 10.1.5 Taiwan
                                                          • 10.1.6 Australia
                                                          • 10.1.7 Rest of Asia-Pacific
                                                    • 11. North America Smartphone Camera Lenses Industry Analysis, Insights and Forecast, 2019-2031
                                                        • 11.1. Market Analysis, Insights and Forecast - By Country/Sub-region
                                                          • 11.1.1 United States
                                                          • 11.1.2 Canada
                                                          • 11.1.3 Mexico
                                                    • 12. Europe Smartphone Camera Lenses Industry Analysis, Insights and Forecast, 2019-2031
                                                        • 12.1. Market Analysis, Insights and Forecast - By Country/Sub-region
                                                          • 12.1.1 Germany
                                                          • 12.1.2 France
                                                          • 12.1.3 Italy
                                                          • 12.1.4 United Kingdom
                                                          • 12.1.5 Netherlands
                                                          • 12.1.6 Sweden
                                                          • 12.1.7 Rest of Europe
                                                    • 13. South America Smartphone Camera Lenses Industry Analysis, Insights and Forecast, 2019-2031
                                                        • 13.1. Market Analysis, Insights and Forecast - By Country/Sub-region
                                                          • 13.1.1 Brazil
                                                          • 13.1.2 Argentina
                                                          • 13.1.3 Rest of South America
                                                    • 14. Middle East & Africa Smartphone Camera Lenses Industry Analysis, Insights and Forecast, 2019-2031
                                                        • 14.1. Market Analysis, Insights and Forecast - By Country/Sub-region
                                                          • 14.1.1 UAE
                                                          • 14.1.2 South Africa
                                                          • 14.1.3 Saudi Arabia
                                                          • 14.1.4 Rest of MEA
                                                    • 15. Competitive Analysis
                                                      • 15.1. Global Market Share Analysis 2024
                                                        • 15.2. Company Profiles
                                                          • 15.2.1 Genius Electronic Optical (GSEO)
                                                            • 15.2.1.1. Overview
                                                            • 15.2.1.2. Products
                                                            • 15.2.1.3. SWOT Analysis
                                                            • 15.2.1.4. Recent Developments
                                                            • 15.2.1.5. Financials (Based on Availability)
                                                          • 15.2.2 Sunny Optical Technology (Group) Company Limited
                                                            • 15.2.2.1. Overview
                                                            • 15.2.2.2. Products
                                                            • 15.2.2.3. SWOT Analysis
                                                            • 15.2.2.4. Recent Developments
                                                            • 15.2.2.5. Financials (Based on Availability)
                                                          • 15.2.3 AAC Technologies
                                                            • 15.2.3.1. Overview
                                                            • 15.2.3.2. Products
                                                            • 15.2.3.3. SWOT Analysis
                                                            • 15.2.3.4. Recent Developments
                                                            • 15.2.3.5. Financials (Based on Availability)
                                                          • 15.2.4 Samsung Electro-Mechanics Co Ltd*List Not Exhaustive
                                                            • 15.2.4.1. Overview
                                                            • 15.2.4.2. Products
                                                            • 15.2.4.3. SWOT Analysis
                                                            • 15.2.4.4. Recent Developments
                                                            • 15.2.4.5. Financials (Based on Availability)
                                                          • 15.2.5 Asia Optical Co Inc
                                                            • 15.2.5.1. Overview
                                                            • 15.2.5.2. Products
                                                            • 15.2.5.3. SWOT Analysis
                                                            • 15.2.5.4. Recent Developments
                                                            • 15.2.5.5. Financials (Based on Availability)
                                                          • 15.2.6 Ofilm Group Co Ltd
                                                            • 15.2.6.1. Overview
                                                            • 15.2.6.2. Products
                                                            • 15.2.6.3. SWOT Analysis
                                                            • 15.2.6.4. Recent Developments
                                                            • 15.2.6.5. Financials (Based on Availability)
                                                          • 15.2.7 Largan Precision Company Limited
                                                            • 15.2.7.1. Overview
                                                            • 15.2.7.2. Products
                                                            • 15.2.7.3. SWOT Analysis
                                                            • 15.2.7.4. Recent Developments
                                                            • 15.2.7.5. Financials (Based on Availability)
                                                          • 15.2.8 SEKONIX Co Ltd
                                                            • 15.2.8.1. Overview
                                                            • 15.2.8.2. Products
                                                            • 15.2.8.3. SWOT Analysis
                                                            • 15.2.8.4. Recent Developments
                                                            • 15.2.8.5. Financials (Based on Availability)
                                                          • 15.2.9 Kantatsu Co Ltd (Sharp Corporation
                                                            • 15.2.9.1. Overview
                                                            • 15.2.9.2. Products
                                                            • 15.2.9.3. SWOT Analysis
                                                            • 15.2.9.4. Recent Developments
                                                            • 15.2.9.5. Financials (Based on Availability)
                                                          • 15.2.10 Haesung Optics Co Ltd
                                                            • 15.2.10.1. Overview
                                                            • 15.2.10.2. Products
                                                            • 15.2.10.3. SWOT Analysis
                                                            • 15.2.10.4. Recent Developments
                                                            • 15.2.10.5. Financials (Based on Availability)
                                                          • 15.2.11 LG Innotek
                                                            • 15.2.11.1. Overview
                                                            • 15.2.11.2. Products
                                                            • 15.2.11.3. SWOT Analysis
                                                            • 15.2.11.4. Recent Developments
                                                            • 15.2.11.5. Financials (Based on Availability)
                                                          • 15.2.12 Kinko Optical Co Ltd
                                                            • 15.2.12.1. Overview
                                                            • 15.2.12.2. Products
                                                            • 15.2.12.3. SWOT Analysis
                                                            • 15.2.12.4. Recent Developments
                                                            • 15.2.12.5. Financials (Based on Availability)

                                                    List of Figures

                                                    1. Figure 1: Global Smartphone Camera Lenses Industry Revenue Breakdown (Million, %) by Region 2024 & 2032
                                                    2. Figure 2: Asia Pacific Smartphone Camera Lenses Industry Revenue (Million), by Country 2024 & 2032
                                                    3. Figure 3: Asia Pacific Smartphone Camera Lenses Industry Revenue Share (%), by Country 2024 & 2032
                                                    4. Figure 4: North America Smartphone Camera Lenses Industry Revenue (Million), by Country 2024 & 2032
                                                    5. Figure 5: North America Smartphone Camera Lenses Industry Revenue Share (%), by Country 2024 & 2032
                                                    6. Figure 6: Europe Smartphone Camera Lenses Industry Revenue (Million), by Country 2024 & 2032
                                                    7. Figure 7: Europe Smartphone Camera Lenses Industry Revenue Share (%), by Country 2024 & 2032
                                                    8. Figure 8: South America Smartphone Camera Lenses Industry Revenue (Million), by Country 2024 & 2032
                                                    9. Figure 9: South America Smartphone Camera Lenses Industry Revenue Share (%), by Country 2024 & 2032
                                                    10. Figure 10: Middle East & Africa Smartphone Camera Lenses Industry Revenue (Million), by Country 2024 & 2032
                                                    11. Figure 11: Middle East & Africa Smartphone Camera Lenses Industry Revenue Share (%), by Country 2024 & 2032
                                                    12. Figure 12: Asia Pacific Smartphone Camera Lenses Industry Revenue (Million), by Production Analysis 2024 & 2032
                                                    13. Figure 13: Asia Pacific Smartphone Camera Lenses Industry Revenue Share (%), by Production Analysis 2024 & 2032
                                                    14. Figure 14: Asia Pacific Smartphone Camera Lenses Industry Revenue (Million), by Consumption Analysis 2024 & 2032
                                                    15. Figure 15: Asia Pacific Smartphone Camera Lenses Industry Revenue Share (%), by Consumption Analysis 2024 & 2032
                                                    16. Figure 16: Asia Pacific Smartphone Camera Lenses Industry Revenue (Million), by Import Market Analysis (Value & Volume) 2024 & 2032
                                                    17. Figure 17: Asia Pacific Smartphone Camera Lenses Industry Revenue Share (%), by Import Market Analysis (Value & Volume) 2024 & 2032
                                                    18. Figure 18: Asia Pacific Smartphone Camera Lenses Industry Revenue (Million), by Export Market Analysis (Value & Volume) 2024 & 2032
                                                    19. Figure 19: Asia Pacific Smartphone Camera Lenses Industry Revenue Share (%), by Export Market Analysis (Value & Volume) 2024 & 2032
                                                    20. Figure 20: Asia Pacific Smartphone Camera Lenses Industry Revenue (Million), by Price Trend Analysis 2024 & 2032
                                                    21. Figure 21: Asia Pacific Smartphone Camera Lenses Industry Revenue Share (%), by Price Trend Analysis 2024 & 2032
                                                    22. Figure 22: Asia Pacific Smartphone Camera Lenses Industry Revenue (Million), by Country 2024 & 2032
                                                    23. Figure 23: Asia Pacific Smartphone Camera Lenses Industry Revenue Share (%), by Country 2024 & 2032
                                                    24. Figure 24: Americas Smartphone Camera Lenses Industry Revenue (Million), by Production Analysis 2024 & 2032
                                                    25. Figure 25: Americas Smartphone Camera Lenses Industry Revenue Share (%), by Production Analysis 2024 & 2032
                                                    26. Figure 26: Americas Smartphone Camera Lenses Industry Revenue (Million), by Consumption Analysis 2024 & 2032
                                                    27. Figure 27: Americas Smartphone Camera Lenses Industry Revenue Share (%), by Consumption Analysis 2024 & 2032
                                                    28. Figure 28: Americas Smartphone Camera Lenses Industry Revenue (Million), by Import Market Analysis (Value & Volume) 2024 & 2032
                                                    29. Figure 29: Americas Smartphone Camera Lenses Industry Revenue Share (%), by Import Market Analysis (Value & Volume) 2024 & 2032
                                                    30. Figure 30: Americas Smartphone Camera Lenses Industry Revenue (Million), by Export Market Analysis (Value & Volume) 2024 & 2032
                                                    31. Figure 31: Americas Smartphone Camera Lenses Industry Revenue Share (%), by Export Market Analysis (Value & Volume) 2024 & 2032
                                                    32. Figure 32: Americas Smartphone Camera Lenses Industry Revenue (Million), by Price Trend Analysis 2024 & 2032
                                                    33. Figure 33: Americas Smartphone Camera Lenses Industry Revenue Share (%), by Price Trend Analysis 2024 & 2032
                                                    34. Figure 34: Americas Smartphone Camera Lenses Industry Revenue (Million), by Country 2024 & 2032
                                                    35. Figure 35: Americas Smartphone Camera Lenses Industry Revenue Share (%), by Country 2024 & 2032
                                                    36. Figure 36: Europe Smartphone Camera Lenses Industry Revenue (Million), by Production Analysis 2024 & 2032
                                                    37. Figure 37: Europe Smartphone Camera Lenses Industry Revenue Share (%), by Production Analysis 2024 & 2032
                                                    38. Figure 38: Europe Smartphone Camera Lenses Industry Revenue (Million), by Consumption Analysis 2024 & 2032
                                                    39. Figure 39: Europe Smartphone Camera Lenses Industry Revenue Share (%), by Consumption Analysis 2024 & 2032
                                                    40. Figure 40: Europe Smartphone Camera Lenses Industry Revenue (Million), by Import Market Analysis (Value & Volume) 2024 & 2032
                                                    41. Figure 41: Europe Smartphone Camera Lenses Industry Revenue Share (%), by Import Market Analysis (Value & Volume) 2024 & 2032
                                                    42. Figure 42: Europe Smartphone Camera Lenses Industry Revenue (Million), by Export Market Analysis (Value & Volume) 2024 & 2032
                                                    43. Figure 43: Europe Smartphone Camera Lenses Industry Revenue Share (%), by Export Market Analysis (Value & Volume) 2024 & 2032
                                                    44. Figure 44: Europe Smartphone Camera Lenses Industry Revenue (Million), by Price Trend Analysis 2024 & 2032
                                                    45. Figure 45: Europe Smartphone Camera Lenses Industry Revenue Share (%), by Price Trend Analysis 2024 & 2032
                                                    46. Figure 46: Europe Smartphone Camera Lenses Industry Revenue (Million), by Country 2024 & 2032
                                                    47. Figure 47: Europe Smartphone Camera Lenses Industry Revenue Share (%), by Country 2024 & 2032
                                                    48. Figure 48: Rest of the World Smartphone Camera Lenses Industry Revenue (Million), by Production Analysis 2024 & 2032
                                                    49. Figure 49: Rest of the World Smartphone Camera Lenses Industry Revenue Share (%), by Production Analysis 2024 & 2032
                                                    50. Figure 50: Rest of the World Smartphone Camera Lenses Industry Revenue (Million), by Consumption Analysis 2024 & 2032
                                                    51. Figure 51: Rest of the World Smartphone Camera Lenses Industry Revenue Share (%), by Consumption Analysis 2024 & 2032
                                                    52. Figure 52: Rest of the World Smartphone Camera Lenses Industry Revenue (Million), by Import Market Analysis (Value & Volume) 2024 & 2032
                                                    53. Figure 53: Rest of the World Smartphone Camera Lenses Industry Revenue Share (%), by Import Market Analysis (Value & Volume) 2024 & 2032
                                                    54. Figure 54: Rest of the World Smartphone Camera Lenses Industry Revenue (Million), by Export Market Analysis (Value & Volume) 2024 & 2032
                                                    55. Figure 55: Rest of the World Smartphone Camera Lenses Industry Revenue Share (%), by Export Market Analysis (Value & Volume) 2024 & 2032
                                                    56. Figure 56: Rest of the World Smartphone Camera Lenses Industry Revenue (Million), by Price Trend Analysis 2024 & 2032
                                                    57. Figure 57: Rest of the World Smartphone Camera Lenses Industry Revenue Share (%), by Price Trend Analysis 2024 & 2032
                                                    58. Figure 58: Rest of the World Smartphone Camera Lenses Industry Revenue (Million), by Country 2024 & 2032
                                                    59. Figure 59: Rest of the World Smartphone Camera Lenses Industry Revenue Share (%), by Country 2024 & 2032

                                                    List of Tables

                                                    1. Table 1: Global Smartphone Camera Lenses Industry Revenue Million Forecast, by Region 2019 & 2032
                                                    2. Table 2: Global Smartphone Camera Lenses Industry Revenue Million Forecast, by Production Analysis 2019 & 2032
                                                    3. Table 3: Global Smartphone Camera Lenses Industry Revenue Million Forecast, by Consumption Analysis 2019 & 2032
                                                    4. Table 4: Global Smartphone Camera Lenses Industry Revenue Million Forecast, by Import Market Analysis (Value & Volume) 2019 & 2032
                                                    5. Table 5: Global Smartphone Camera Lenses Industry Revenue Million Forecast, by Export Market Analysis (Value & Volume) 2019 & 2032
                                                    6. Table 6: Global Smartphone Camera Lenses Industry Revenue Million Forecast, by Price Trend Analysis 2019 & 2032
                                                    7. Table 7: Global Smartphone Camera Lenses Industry Revenue Million Forecast, by Region 2019 & 2032
                                                    8. Table 8: Global Smartphone Camera Lenses Industry Revenue Million Forecast, by Country 2019 & 2032
                                                    9. Table 9: China Smartphone Camera Lenses Industry Revenue (Million) Forecast, by Application 2019 & 2032
                                                    10. Table 10: Japan Smartphone Camera Lenses Industry Revenue (Million) Forecast, by Application 2019 & 2032
                                                    11. Table 11: India Smartphone Camera Lenses Industry Revenue (Million) Forecast, by Application 2019 & 2032
                                                    12. Table 12: South Korea Smartphone Camera Lenses Industry Revenue (Million) Forecast, by Application 2019 & 2032
                                                    13. Table 13: Taiwan Smartphone Camera Lenses Industry Revenue (Million) Forecast, by Application 2019 & 2032
                                                    14. Table 14: Australia Smartphone Camera Lenses Industry Revenue (Million) Forecast, by Application 2019 & 2032
                                                    15. Table 15: Rest of Asia-Pacific Smartphone Camera Lenses Industry Revenue (Million) Forecast, by Application 2019 & 2032
                                                    16. Table 16: Global Smartphone Camera Lenses Industry Revenue Million Forecast, by Country 2019 & 2032
                                                    17. Table 17: United States Smartphone Camera Lenses Industry Revenue (Million) Forecast, by Application 2019 & 2032
                                                    18. Table 18: Canada Smartphone Camera Lenses Industry Revenue (Million) Forecast, by Application 2019 & 2032
                                                    19. Table 19: Mexico Smartphone Camera Lenses Industry Revenue (Million) Forecast, by Application 2019 & 2032
                                                    20. Table 20: Global Smartphone Camera Lenses Industry Revenue Million Forecast, by Country 2019 & 2032
                                                    21. Table 21: Germany Smartphone Camera Lenses Industry Revenue (Million) Forecast, by Application 2019 & 2032
                                                    22. Table 22: France Smartphone Camera Lenses Industry Revenue (Million) Forecast, by Application 2019 & 2032
                                                    23. Table 23: Italy Smartphone Camera Lenses Industry Revenue (Million) Forecast, by Application 2019 & 2032
                                                    24. Table 24: United Kingdom Smartphone Camera Lenses Industry Revenue (Million) Forecast, by Application 2019 & 2032
                                                    25. Table 25: Netherlands Smartphone Camera Lenses Industry Revenue (Million) Forecast, by Application 2019 & 2032
                                                    26. Table 26: Sweden Smartphone Camera Lenses Industry Revenue (Million) Forecast, by Application 2019 & 2032
                                                    27. Table 27: Rest of Europe Smartphone Camera Lenses Industry Revenue (Million) Forecast, by Application 2019 & 2032
                                                    28. Table 28: Global Smartphone Camera Lenses Industry Revenue Million Forecast, by Country 2019 & 2032
                                                    29. Table 29: Brazil Smartphone Camera Lenses Industry Revenue (Million) Forecast, by Application 2019 & 2032
                                                    30. Table 30: Argentina Smartphone Camera Lenses Industry Revenue (Million) Forecast, by Application 2019 & 2032
                                                    31. Table 31: Rest of South America Smartphone Camera Lenses Industry Revenue (Million) Forecast, by Application 2019 & 2032
                                                    32. Table 32: Global Smartphone Camera Lenses Industry Revenue Million Forecast, by Country 2019 & 2032
                                                    33. Table 33: UAE Smartphone Camera Lenses Industry Revenue (Million) Forecast, by Application 2019 & 2032
                                                    34. Table 34: South Africa Smartphone Camera Lenses Industry Revenue (Million) Forecast, by Application 2019 & 2032
                                                    35. Table 35: Saudi Arabia Smartphone Camera Lenses Industry Revenue (Million) Forecast, by Application 2019 & 2032
                                                    36. Table 36: Rest of MEA Smartphone Camera Lenses Industry Revenue (Million) Forecast, by Application 2019 & 2032
                                                    37. Table 37: Global Smartphone Camera Lenses Industry Revenue Million Forecast, by Production Analysis 2019 & 2032
                                                    38. Table 38: Global Smartphone Camera Lenses Industry Revenue Million Forecast, by Consumption Analysis 2019 & 2032
                                                    39. Table 39: Global Smartphone Camera Lenses Industry Revenue Million Forecast, by Import Market Analysis (Value & Volume) 2019 & 2032
                                                    40. Table 40: Global Smartphone Camera Lenses Industry Revenue Million Forecast, by Export Market Analysis (Value & Volume) 2019 & 2032
                                                    41. Table 41: Global Smartphone Camera Lenses Industry Revenue Million Forecast, by Price Trend Analysis 2019 & 2032
                                                    42. Table 42: Global Smartphone Camera Lenses Industry Revenue Million Forecast, by Country 2019 & 2032
                                                    43. Table 43: Global Smartphone Camera Lenses Industry Revenue Million Forecast, by Production Analysis 2019 & 2032
                                                    44. Table 44: Global Smartphone Camera Lenses Industry Revenue Million Forecast, by Consumption Analysis 2019 & 2032
                                                    45. Table 45: Global Smartphone Camera Lenses Industry Revenue Million Forecast, by Import Market Analysis (Value & Volume) 2019 & 2032
                                                    46. Table 46: Global Smartphone Camera Lenses Industry Revenue Million Forecast, by Export Market Analysis (Value & Volume) 2019 & 2032
                                                    47. Table 47: Global Smartphone Camera Lenses Industry Revenue Million Forecast, by Price Trend Analysis 2019 & 2032
                                                    48. Table 48: Global Smartphone Camera Lenses Industry Revenue Million Forecast, by Country 2019 & 2032
                                                    49. Table 49: Global Smartphone Camera Lenses Industry Revenue Million Forecast, by Production Analysis 2019 & 2032
                                                    50. Table 50: Global Smartphone Camera Lenses Industry Revenue Million Forecast, by Consumption Analysis 2019 & 2032
                                                    51. Table 51: Global Smartphone Camera Lenses Industry Revenue Million Forecast, by Import Market Analysis (Value & Volume) 2019 & 2032
                                                    52. Table 52: Global Smartphone Camera Lenses Industry Revenue Million Forecast, by Export Market Analysis (Value & Volume) 2019 & 2032
                                                    53. Table 53: Global Smartphone Camera Lenses Industry Revenue Million Forecast, by Price Trend Analysis 2019 & 2032
                                                    54. Table 54: Global Smartphone Camera Lenses Industry Revenue Million Forecast, by Country 2019 & 2032
                                                    55. Table 55: Global Smartphone Camera Lenses Industry Revenue Million Forecast, by Production Analysis 2019 & 2032
                                                    56. Table 56: Global Smartphone Camera Lenses Industry Revenue Million Forecast, by Consumption Analysis 2019 & 2032
                                                    57. Table 57: Global Smartphone Camera Lenses Industry Revenue Million Forecast, by Import Market Analysis (Value & Volume) 2019 & 2032
                                                    58. Table 58: Global Smartphone Camera Lenses Industry Revenue Million Forecast, by Export Market Analysis (Value & Volume) 2019 & 2032
                                                    59. Table 59: Global Smartphone Camera Lenses Industry Revenue Million Forecast, by Price Trend Analysis 2019 & 2032
                                                    60. Table 60: Global Smartphone Camera Lenses Industry Revenue Million Forecast, by Country 2019 & 2032


                                                    Frequently Asked Questions

                                                    1. What is the projected Compound Annual Growth Rate (CAGR) of the Smartphone Camera Lenses Industry?

                                                    The projected CAGR is approximately 8.21%.

                                                    2. Which companies are prominent players in the Smartphone Camera Lenses Industry?

                                                    Key companies in the market include Genius Electronic Optical (GSEO), Sunny Optical Technology (Group) Company Limited, AAC Technologies, Samsung Electro-Mechanics Co Ltd*List Not Exhaustive, Asia Optical Co Inc, Ofilm Group Co Ltd, Largan Precision Company Limited, SEKONIX Co Ltd, Kantatsu Co Ltd (Sharp Corporation, Haesung Optics Co Ltd, LG Innotek, Kinko Optical Co Ltd.

                                                    3. What are the main segments of the Smartphone Camera Lenses Industry?

                                                    The market segments include Production Analysis, Consumption Analysis, Import Market Analysis (Value & Volume), Export Market Analysis (Value & Volume), Price Trend Analysis.

                                                    4. Can you provide details about the market size?

                                                    The market size is estimated to be USD 5.01 Million as of 2022.

                                                    5. What are some drivers contributing to market growth?

                                                    Increasing Popularity of Multiple Camera Smartphones and the Introduction of Advanced Camera Technologies.

                                                    6. What are the notable trends driving market growth?

                                                    Increasing Popularity of Multiple Camera Smartphones and the Introduction of Advanced Camera Technologies will Drive the Market.

                                                    7. Are there any restraints impacting market growth?

                                                    Slow Down of Smartphone Sales and Increasing Pricing Competition.

                                                    8. Can you provide examples of recent developments in the market?

                                                    October 2023 - Google launched its Pixel 8 series. It uses AI algorithms to pick out the best facial expressions in batches of group photos and easily paste them into a different image template. Samsung also applied around 60 AI models for the functions of the cameras on its Galaxy S22 Ultra, thereby allowing customers to click detailed close-up photos of night scenes and match the quality of a DSLR.

                                                    9. What pricing options are available for accessing the report?

                                                    Pricing options include single-user, multi-user, and enterprise licenses priced at USD 4750, USD 5250, and USD 8750 respectively.

                                                    10. Is the market size provided in terms of value or volume?

                                                    The market size is provided in terms of value, measured in Million.

                                                    11. Are there any specific market keywords associated with the report?

                                                    Yes, the market keyword associated with the report is "Smartphone Camera Lenses Industry," which aids in identifying and referencing the specific market segment covered.

                                                    12. How do I determine which pricing option suits my needs best?

                                                    The pricing options vary based on user requirements and access needs. Individual users may opt for single-user licenses, while businesses requiring broader access may choose multi-user or enterprise licenses for cost-effective access to the report.

                                                    13. Are there any additional resources or data provided in the Smartphone Camera Lenses Industry report?

                                                    While the report offers comprehensive insights, it's advisable to review the specific contents or supplementary materials provided to ascertain if additional resources or data are available.

                                                    14. How can I stay updated on further developments or reports in the Smartphone Camera Lenses Industry?

                                                    To stay informed about further developments, trends, and reports in the Smartphone Camera Lenses Industry, consider subscribing to industry newsletters, following relevant companies and organizations, or regularly checking reputable industry news sources and publications.


                                                    Methodology

                                                    Step 1 - Identification of Relevant Samples Size from Population Database

                                                    Step Chart
                                                    Bar Chart
                                                    Method Chart

                                                    Step 2 - Approaches for Defining Global Market Size (Value, Volume* & Price*)

                                                    Approach Chart
                                                    Top-down and bottom-up approaches are used to validate the global market size and estimate the market size for manufactures, regional segments, product, and application.

                                                    Note*: In applicable scenarios

                                                    Step 3 - Data Sources

                                                    Primary Research

                                                    • Web Analytics
                                                    • Survey Reports
                                                    • Research Institute
                                                    • Latest Research Reports
                                                    • Opinion Leaders

                                                    Secondary Research

                                                    • Annual Reports
                                                    • White Paper
                                                    • Latest Press Release
                                                    • Industry Association
                                                    • Paid Database
                                                    • Investor Presentations
                                                    Analyst Chart

                                                    Step 4 - Data Triangulation

                                                    Involves using different sources of information in order to increase the validity of a study

                                                    These sources are likely to be stakeholders in a program - participants, other researchers, program staff, other community members, and so on.

                                                    Then we put all data in single framework & apply various statistical tools to find out the dynamic on the market.

                                                    During the analysis stage, feedback from the stakeholder groups would be compared to determine areas of agreement as well as areas of divergence

                                                    Additionally, after gathering mixed and scattered data from a wide range of sources, data is triangulated and correlated to come up with estimated figures which are further validated through primary mediums or industry experts, opinion leaders.

                                                    About Precision Market View

                                                    Precision Market View offers precise market research, industry intelligence, and data analysis for healthcare, manufacturing, technology, and energy. Our reports provide the clarity you need to make informed decisions and drive growth.

                                                    Our team combines primary research, advanced analytics, and industry expertise to deliver actionable intelligence. We offer syndicated reports, custom research, and consulting services tailored to your business needs.

                                                    At Precision Market View, we are committed to quality, transparency, and client satisfaction. Every report is rigorously validated to ensure accuracy and relevance. Our global perspective and local expertise help you understand both the big picture and the finer details of your market.

                                                    Stay informed with Precision Market View. Subscribe to our newsletter for the latest updates and research highlights, and follow us on social media for real-time insights.

                                                    Precision Market View – Clarity for Your Strategic Decisions.

                                                    artwork spiralartwork spiralRelated Reports
                                                    artwork underline

                                                    Future-Forward Strategies for Additive Manufacturing Industry Industry

                                                    The Additive Manufacturing market is booming, projected to reach $78.93 billion by 2025, with a 20.70% CAGR. Explore key trends, drivers, restraints, and leading companies shaping this revolutionary industry. Discover market insights by technology, end-user, and region.

                                                    July 2025
                                                    Base Year: 2024
                                                    No Of Pages: 234
                                                    Price: $4750

                                                    Europe IP Video Intercom Device and Equipment Market Trends and Forecasts: Comprehensive Insights

                                                    The European IP Video Intercom market is booming, projected to reach significant value by 2033. Discover key drivers, trends, and restraints shaping this dynamic sector, including leading companies and regional breakdowns. Explore market size, CAGR, and future growth projections for IP video intercom devices and equipment in Europe.

                                                    July 2025
                                                    Base Year: 2024
                                                    No Of Pages: 210
                                                    Price: $4750

                                                    United States MRO Market Growth Forecast and Consumer Insights

                                                    Discover the latest insights on the booming US MRO market. This in-depth analysis reveals a $91.55 billion market in 2025, poised for steady growth driven by industrial automation and digitalization. Learn about key players, market trends, and future projections.

                                                    July 2025
                                                    Base Year: 2024
                                                    No Of Pages: 197
                                                    Price: $3800

                                                    Europe BFSI Biometrics Market Charting Growth Trajectories 2025-2033: Strategic Insights and Forecasts

                                                    The Europe BFSI Biometrics Market is booming, projected to reach €2.3 Billion in 2025 and grow at a CAGR of 15.20% through 2033. Driven by fraud prevention needs and digital banking expansion, this report analyzes market trends, key players (IDEMIA, Fujitsu, Thales), and future growth opportunities in biometric authentication for financial services.

                                                    July 2025
                                                    Base Year: 2024
                                                    No Of Pages: 210
                                                    Price: $4750

                                                    Growth Catalysts in Poland Data Center Rack Market Market

                                                    Poland's data center rack market is booming, with a 15.10% CAGR. Discover key drivers, trends, and restraints shaping this growing sector, including insights into major players, segment analysis (rack size & end-user), and regional market forecasts (2025-2033).

                                                    July 2025
                                                    Base Year: 2024
                                                    No Of Pages: 197
                                                    Price: $3800

                                                    Instore Analytics Industry XX CAGR Growth Outlook 2025-2033

                                                    The Instore Analytics market is booming, projected to reach \$4.26 billion by 2025 with a 24.23% CAGR. Discover key trends, drivers, and regional insights shaping this dynamic industry, including leading companies and applications. Explore the potential of cloud-based solutions, AI, and IoT in revolutionizing retail operations.

                                                    July 2025
                                                    Base Year: 2024
                                                    No Of Pages: 234
                                                    Price: $4750

                                                    Strategic Insights for Data Center Cooling Market Market Expansion

                                                    The Data Center Cooling market is booming, projected to hit $16.56 billion by 2025, with a 15.82% CAGR. Learn about key drivers, trends, and leading companies shaping this crucial sector for data center infrastructure. Explore market segments, regional breakdowns, and future projections for air-based and liquid-based cooling technologies.

                                                    July 2025
                                                    Base Year: 2024
                                                    No Of Pages: 234
                                                    Price: $4750

                                                    Consumer Behavior and ASEAN Unified Communication-as-a-Service Market Trends

                                                    The ASEAN Unified Communication-as-a-Service (UCaaS) market is booming, with a projected CAGR of 12.27%. Discover key trends, drivers, and challenges shaping this rapidly expanding sector across Singapore, Malaysia, Indonesia, and the wider region. Explore market size, segmentation, and leading companies.

                                                    July 2025
                                                    Base Year: 2024
                                                    No Of Pages: 197
                                                    Price: $3800

                                                    Global Thermocouple Temperature Sensors Market Soars to XXX Million, witnessing a CAGR of XX during the forecast period 2025-2033

                                                    Discover the latest trends in the booming global thermocouple temperature sensors market. This comprehensive analysis reveals market size, CAGR, key drivers, restraints, and regional insights, featuring leading players like Omega Engineering and AMETEK. Explore growth opportunities in industrial automation, aerospace, and healthcare.

                                                    July 2025
                                                    Base Year: 2024
                                                    No Of Pages: 210
                                                    Price: $4750

                                                    Exploring Growth Avenues in Indonesia VoLTE Market Market

                                                    Indonesia's VoLTE market is booming, projected to reach $19.39 billion by 2033 with a CAGR of 45.53%. Driven by increased smartphone adoption and data consumption, this report analyzes market trends, key players (XL Axiata, Telkomsel, Indosat), and regional growth. Discover the opportunities and challenges in this dynamic sector.

                                                    July 2025
                                                    Base Year: 2024
                                                    No Of Pages: 197
                                                    Price: $3800

                                                    Germany Data Center Physical Security Market Innovations Shaping Market Growth 2025-2033

                                                    The Germany Data Center Physical Security Market is booming, projected to reach €215.16 million by 2033 with a 13.20% CAGR. Driven by cloud computing growth and stringent data privacy regulations, this report analyzes market trends, key players (Honeywell, Siemens, etc.), and regional growth in key German states. Learn about video surveillance, access control, and other security solutions shaping this dynamic market.

                                                    July 2025
                                                    Base Year: 2024
                                                    No Of Pages: 197
                                                    Price: $3800

                                                    Gas Sensor, Detector and Analyzer Market Market Consumption Trends: Growth Analysis 2025-2033

                                                    The Gas Sensor, Detector, & Analyzer Market is booming, projected to reach \$4.67 billion by 2025 with a 5.60% CAGR. Discover key trends, drivers, and top players shaping this rapidly expanding sector driven by industrial automation, environmental regulations, and technological advancements. Explore market segmentation by technology and end-user industry.

                                                    July 2025
                                                    Base Year: 2024
                                                    No Of Pages: 234
                                                    Price: $4750

                                                    Innovation Trends in Italy Direct Mail Automation Software Industry: Market Outlook 2025-2033

                                                    Discover the booming Italy Direct Mail Automation Software market! Learn about its €100 million valuation, 7.10% CAGR, key players (Bowes, CM Group, Quadient Pitney), and growth drivers. Explore regional insights and forecast data (2025-2033) for this dynamic sector.

                                                    July 2025
                                                    Base Year: 2024
                                                    No Of Pages: 197
                                                    Price: $3800

                                                    Vertical Lift Module (VLM) Industry 2025-2033 Trends and Competitor Dynamics: Unlocking Growth Opportunities

                                                    Discover the booming Vertical Lift Module (VLM) market! This in-depth analysis reveals a CAGR of 8% through 2033, driven by e-commerce, automation, and optimized warehouse solutions. Explore key players, market segmentation, and regional trends shaping the future of VLMs.

                                                    July 2025
                                                    Base Year: 2024
                                                    No Of Pages: 234
                                                    Price: $4750

                                                    Electronic Shelf Label Market 2025-2033 Overview: Trends, Dynamics, and Growth Opportunities

                                                    The Electronic Shelf Label (ESL) market is booming, projected to reach $1.73B in 2025 with a 13.9% CAGR. Discover key market drivers, trends, and restraints shaping this dynamic industry, including insights on LCD vs. E-paper ESLs and regional market shares. Learn about top players like Pricer AB and SES-imagotag.

                                                    July 2025
                                                    Base Year: 2024
                                                    No Of Pages: 234
                                                    Price: $4750

                                                    Immersive Virtual Reality Market: Harnessing Emerging Innovations for Growth 2025-2033

                                                    The Immersive Virtual Reality (IVR) market is booming, with a CAGR of 21.50% and projected to reach significant value by 2033. Explore key trends, drivers, restraints, and leading companies shaping this rapidly evolving technology across gaming, healthcare, and more. Discover market insights and future forecasts for VR headsets, gesture tracking, and regional market share.

                                                    July 2025
                                                    Base Year: 2024
                                                    No Of Pages: 234
                                                    Price: $4750

                                                    Signals Intelligence (SIGINT) Industry Market Growth Fueled by CAGR to XXX Million by 2033

                                                    The Signals Intelligence (SIGINT) market is booming, projected to reach $XX million by 2033 with a CAGR of 5.61%. Discover key drivers, trends, and restraining factors influencing this growth, along with regional insights and leading companies shaping the future of SIGINT. Learn more about ELINT, COMINT, cyber intelligence, and more.

                                                    July 2025
                                                    Base Year: 2024
                                                    No Of Pages: 234
                                                    Price: $4750

                                                    Hazardous Waste Handling Automation Market Market’s Evolution: Key Growth Drivers 2025-2033

                                                    The Hazardous Waste Handling Automation market is booming, with a projected CAGR of 8.54% through 2033. Driven by stricter environmental regulations and safety concerns, this market analysis reveals key trends, regional insights, and leading companies in automation solutions for hazardous waste management. Explore the growth potential and competitive landscape now!

                                                    July 2025
                                                    Base Year: 2024
                                                    No Of Pages: 234
                                                    Price: $4750

                                                    Australia Mobile Virtual Network Operator (MVNO) Market Insights: Growth at XX CAGR Through 2033

                                                    Discover the booming Australian Mobile Virtual Network Operator (MVNO) market. This in-depth analysis reveals a $850 million market in 2025 projected to reach over $1.5 billion by 2033, driven by increasing data consumption and competitive pricing. Explore key players, market segments, and growth drivers.

                                                    July 2025
                                                    Base Year: 2024
                                                    No Of Pages: 197
                                                    Price: $3800

                                                    Internet Of Things (IoT) Platform Market Market Strategies: Trends and Outlook 2025-2033

                                                    The IoT Platform Market is booming, projected to reach \$8.23B in 2025 with a 16.41% CAGR. Discover key drivers, trends, restraints, and leading companies shaping this rapidly expanding sector across diverse industries. Explore market segmentation by deployment, platform type, and end-user.

                                                    July 2025
                                                    Base Year: 2024
                                                    No Of Pages: 234
                                                    Price: $4750

                                                    Business Address

                                                    Head Office

                                                    Office no. A 5010, fifth floor, Solitaire Business Hub, Near Phoenix mall, Pune, Maharashtra 411014

                                                    Contact Information

                                                    Craig Francis

                                                    Business Development Head

                                                    +17162654855

                                                    [email protected]

                                                    Connect With Us

                                                    Secure Payment Partners

                                                    payment image
                                                    RetailLogisticsPackagingAutomotiveHealthcareAgricultureEnergy & PowerFood & BeverageAerospace & DefenseChemicals & MaterialsHospitality and TourismAnimal Nutrition & WellnessConsumer Goods and ServicesReal Estate and ConstructionHome and Property ImprovementTechnology, Media and TelecomManufacturing Products and ServicesFinancial Services and Investment Intelligence

                                                    © 2025 All rights reserved


                                                    Privacy Policy
                                                    Terms and Conditions
                                                    FAQ
                                                    • Home
                                                    • About Us
                                                    • Industries
                                                      • Aerospace & Defense
                                                      • Agriculture
                                                      • Animal Nutrition & Wellness
                                                      • Automotive
                                                      • Chemicals & Materials
                                                      • Consumer Goods and Services
                                                      • Energy & Power
                                                      • Financial Services and Investment Intelligence
                                                      • Food & Beverage
                                                      • Home and Property Improvement
                                                      • Hospitality and Tourism
                                                      • Logistics
                                                      • Manufacturing Products and Services
                                                      • Packaging
                                                      • Professional and Commercial Services
                                                      • Real Estate and Construction
                                                      • Retail
                                                      • Technology, Media and Telecom
                                                      • Healthcare
                                                    • Services
                                                    • Contact
                                                    Main Logo
                                                    • Home
                                                    • About Us
                                                    • Industries
                                                      • Aerospace & Defense
                                                      • Agriculture
                                                      • Animal Nutrition & Wellness
                                                      • Automotive
                                                      • Chemicals & Materials
                                                      • Consumer Goods and Services
                                                      • Energy & Power
                                                      • Financial Services and Investment Intelligence
                                                      • Food & Beverage
                                                      • Home and Property Improvement
                                                      • Hospitality and Tourism
                                                      • Logistics
                                                      • Manufacturing Products and Services
                                                      • Packaging
                                                      • Professional and Commercial Services
                                                      • Real Estate and Construction
                                                      • Retail
                                                      • Technology, Media and Telecom
                                                      • Healthcare
                                                    • Services
                                                    • Contact
                                                    +17162654855
                                                    [email protected]

                                                    +17162654855

                                                    [email protected]