
Key Insights
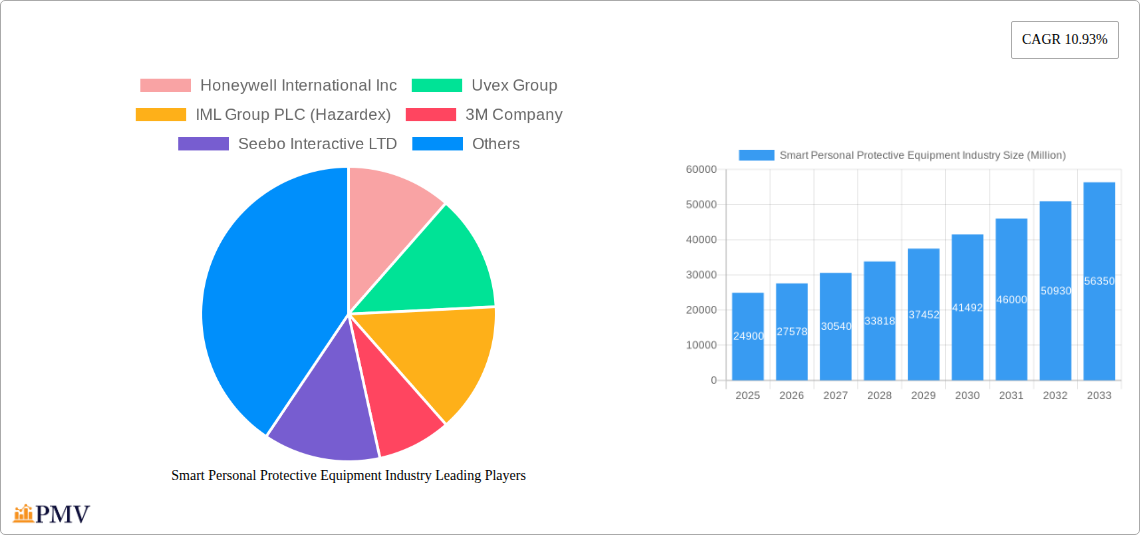
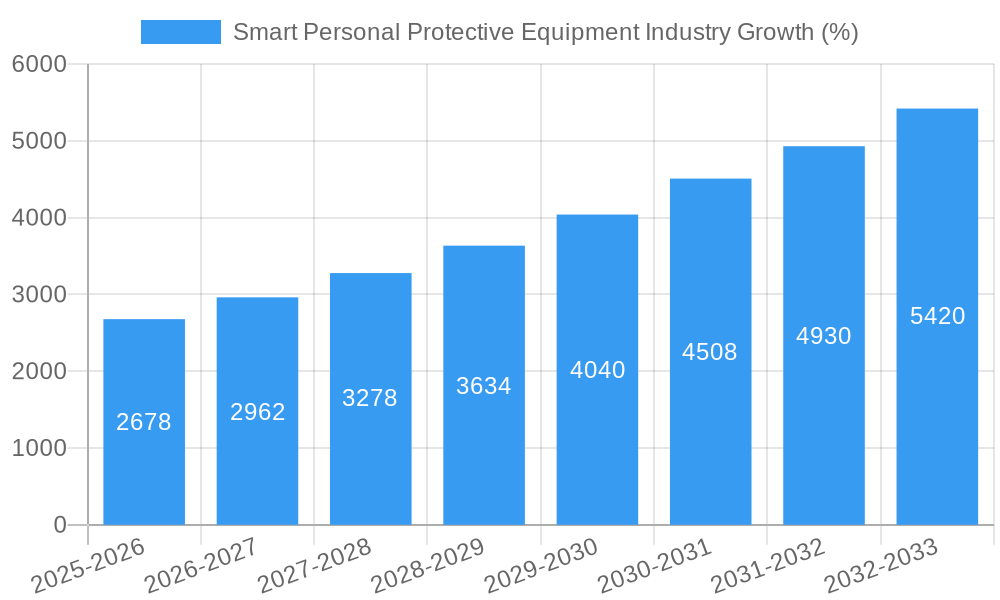
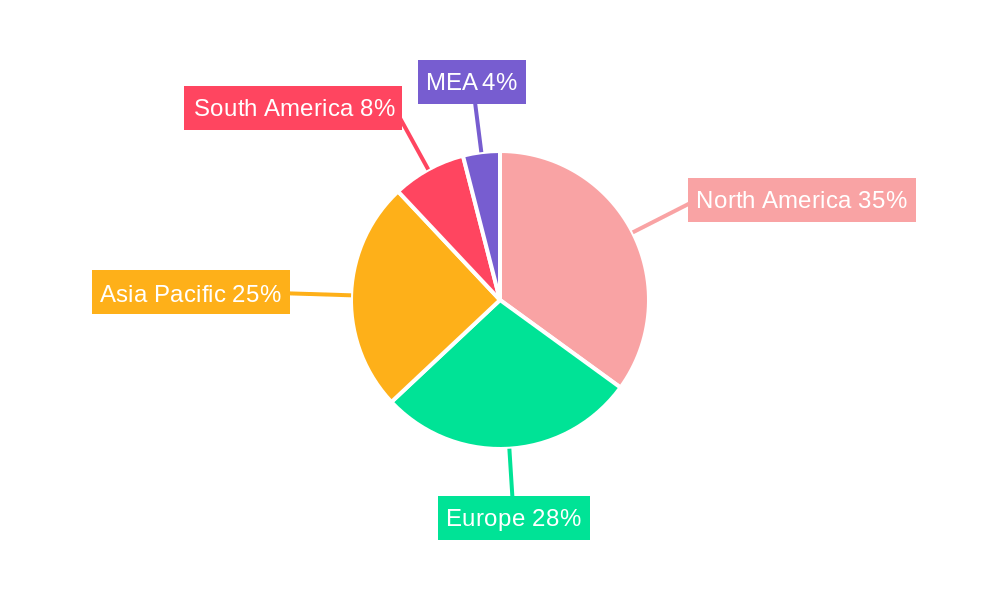
The global Smart Personal Protective Equipment (Smart PPE) market is experiencing robust growth, projected to reach $24.90 billion in 2025 and maintain a Compound Annual Growth Rate (CAGR) of 10.93% from 2025 to 2033. This expansion is driven by several key factors. Increasing workplace safety regulations across various sectors, including construction, manufacturing, and oil & gas, are mandating the adoption of advanced safety solutions. Furthermore, the rising awareness of worker safety and the increasing costs associated with workplace injuries are compelling businesses to invest in preventative measures like Smart PPE. Technological advancements, particularly in areas like sensor technology, connectivity, and data analytics, are continuously improving the functionality and effectiveness of Smart PPE, leading to wider adoption. The integration of features like real-time monitoring, fall detection, and environmental hazard alerts enhances worker safety and productivity. The market is segmented by equipment type (eye and face protection, hearing protection, head protection, fall protection, smart clothing, and others) and end-user industry. North America currently holds a significant market share, driven by early adoption and stringent safety regulations, but the Asia-Pacific region is expected to witness substantial growth due to increasing industrialization and a rising focus on worker safety.
The competitive landscape is dynamic, with major players like Honeywell, 3M, and Uvex Group dominating the market. However, several innovative startups and technology companies are emerging, contributing to increased competition and product diversification. This competition fosters innovation and drives down costs, making Smart PPE more accessible to a wider range of industries and businesses. Despite the positive growth outlook, challenges remain, including high initial investment costs for Smart PPE implementation and concerns regarding data privacy and security. Addressing these challenges through strategic partnerships, technological advancements, and robust data protection measures will be crucial for sustained market growth. Future growth will likely be fueled by the increasing integration of artificial intelligence (AI) and the Internet of Things (IoT) in Smart PPE, paving the way for more sophisticated safety solutions and predictive maintenance capabilities.
Smart Personal Protective Equipment (PPE) Industry Market Report: 2019-2033
This comprehensive report provides a detailed analysis of the Smart Personal Protective Equipment (PPE) industry, offering invaluable insights for businesses, investors, and researchers. Covering the period from 2019 to 2033, with a base year of 2025 and a forecast period of 2025-2033, this report meticulously examines market trends, competitive dynamics, and future growth prospects. The global Smart PPE market is estimated to reach xx Million by 2033, exhibiting a significant CAGR of xx% during the forecast period.
Smart Personal Protective Equipment Industry Market Structure & Competitive Dynamics
The Smart PPE market is characterized by a moderately concentrated structure, with key players such as Honeywell International Inc, Honeywell, Uvex Group, IML Group PLC (Hazardex), 3M Company, Seebo Interactive LTD, Tenacious Holdings Inc (dba Ergodyne), Intellinium, Daqri, Vuzix Corp, and Corvex Connected Worker holding significant market share. However, the emergence of innovative startups and technological advancements are fostering increased competition. The market exhibits a dynamic innovation ecosystem, driven by continuous improvements in sensor technology, connectivity, and data analytics. Regulatory frameworks, varying across different geographies, influence product development and adoption. Product substitutes, such as traditional PPE, pose a competitive challenge, particularly in price-sensitive markets. End-user trends towards enhanced safety and productivity are driving demand for smart PPE solutions. M&A activities have played a role in consolidating the market, with deals valued at an estimated xx Million in the past five years. Key players are strategically acquiring smaller companies to expand their product portfolios and geographic reach.
- Market Concentration: Moderately concentrated, with top 5 players holding xx% market share (estimated).
- Innovation Ecosystem: Strong, driven by advancements in sensor technology and data analytics.
- Regulatory Frameworks: Varied across regions, impacting product development and adoption.
- M&A Activity: Significant, with xx Million in deal value (estimated) over the past five years.
Smart Personal Protective Equipment Industry Industry Trends & Insights
The Smart PPE market is experiencing robust growth driven by factors such as increasing workplace safety regulations, rising awareness of worker safety, and technological advancements enabling enhanced functionality and data collection. The integration of IoT, AI, and big data analytics is transforming the industry, leading to the development of sophisticated smart PPE solutions that provide real-time monitoring, risk assessment, and improved communication. Consumer preferences are shifting towards more comfortable, user-friendly, and technologically advanced PPE. The market is witnessing a surge in demand for smart helmets, smart clothing, and connected safety devices. Competitive dynamics are shaped by factors like product innovation, pricing strategies, and brand reputation. The market penetration of smart PPE is currently estimated at xx%, with expectations of reaching xx% by 2033. The industry is witnessing a steady increase in the adoption of smart PPE across various end-user industries.
Dominant Markets & Segments in Smart Personal Protective Equipment Industry
The North American region currently dominates the Smart PPE market, driven by stringent safety regulations, a high concentration of manufacturing industries, and substantial investments in technological advancements. Within the segment breakdown, the “Eye and face protection” segment holds the largest market share due to widespread adoption and increasing demand for enhanced visibility and safety. The construction, oil & gas, and manufacturing end-user industries are key contributors to market growth.
- Leading Region: North America
- Leading Segment (Type): Eye and face protection
- Leading Segment (End-User): Construction, Oil & Gas, Manufacturing
Key Drivers for Dominant Segments:
- Construction: Stringent safety regulations, high accident rates, and growing infrastructure projects.
- Oil & Gas: Hazardous work environments, demand for enhanced worker safety and efficiency.
- Manufacturing: Focus on improving worker productivity and reducing workplace injuries.
Smart Personal Protective Equipment Industry Product Innovations
Recent years have witnessed significant innovations in smart PPE, integrating advanced sensors, communication technologies, and data analytics. Smart helmets with integrated head impact sensors and communication systems are gaining popularity. Smart clothing with embedded sensors monitors vital signs and worker activity. The integration of augmented reality (AR) and virtual reality (VR) technologies enhances worker training and improves situational awareness. These innovations are improving workplace safety, boosting worker productivity, and increasing operational efficiency, thereby driving wider adoption.
Report Segmentation & Scope
This report segments the Smart PPE market by type (Eye and face protection, Hearing protection, Head Protection, Fall Protection, Smart Clothing, Others) and end-user industry (Construction, Mining, Oil & Gas, Manufacturing, Automotive, Others). Each segment’s growth projection, market size, and competitive dynamics are analyzed. The report also provides a regional breakdown of the market, highlighting key growth drivers and opportunities in each region.
- Type Segmentation: Each type is analyzed based on market size, growth rate, technological advancements, and competitive landscape.
- End-User Industry Segmentation: Market size, growth rate, and key players are analyzed for each industry.
- Regional Segmentation: Regional market dynamics, including regulatory landscapes and growth drivers, are covered.
Key Drivers of Smart Personal Protective Equipment Industry Growth
The Smart PPE industry's growth is fueled by several factors: stringent government regulations promoting worker safety, rising awareness of occupational hazards and their impact, growing adoption of IoT and AI technologies leading to the development of advanced PPE solutions, and increasing demand for enhanced workplace safety and productivity across various industries. Technological advancements such as improved sensor technology, better connectivity and data analytics capabilities continue to push innovation.
Challenges in the Smart Personal Protective Equipment Industry Sector
The industry faces challenges including high initial investment costs for smart PPE, concerns about data privacy and security, the need for robust infrastructure for data transmission and processing, and potential resistance from workers to adopting new technologies. Supply chain disruptions and the complexity of integrating various technologies also pose challenges. These factors could potentially hinder market growth if not addressed effectively.
Leading Players in the Smart Personal Protective Equipment Industry Market
- Honeywell International Inc
- Uvex Group
- IML Group PLC (Hazardex)
- 3M Company
- Seebo Interactive LTD
- Tenacious Holdings Inc (dba Ergodyne)
- Intellinium
- Daqri
- Vuzix Corp
- Corvex Connected Worker
Key Developments in Smart Personal Protective Equipment Industry Sector
- October 2022: Honeywell launches a new smart helmet with enhanced safety features.
- June 2023: 3M acquires a smaller company specializing in smart sensor technology.
- (Further developments can be added here with year/month)
Strategic Smart Personal Protective Equipment Industry Market Outlook
The Smart PPE market exhibits significant growth potential, driven by continuous technological advancements, increasing demand for enhanced worker safety, and supportive government regulations. Strategic opportunities lie in developing innovative and user-friendly smart PPE solutions, focusing on data analytics and integration with existing safety systems, and expanding into new geographic markets. The focus on improving data security and addressing worker concerns about technology adoption will be crucial for long-term success.
Smart Personal Protective Equipment Industry Segmentation
-
1. Type
- 1.1. Eye and Face Protection
- 1.2. Hearing Protection
- 1.3. Head Protection
- 1.4. Fall Protection
- 1.5. Smart Clothing
- 1.6. Other Types
-
2. End-user Industry
- 2.1. Construction
- 2.2. Mining
- 2.3. Oil and Gas
- 2.4. Manufacturing
- 2.5. Automotive
- 2.6. Other End-user Industries
Smart Personal Protective Equipment Industry Segmentation By Geography
- 1. North America
- 2. Europe
- 3. Asia
- 4. Australia and New Zealand
- 5. Latin America
- 6. Middle East and Africa
Smart Personal Protective Equipment Industry REPORT HIGHLIGHTS
| Aspects | Details |
|---|---|
| Study Period | 2019-2033 |
| Base Year | 2024 |
| Estimated Year | 2025 |
| Forecast Period | 2025-2033 |
| Historical Period | 2019-2024 |
| Growth Rate | CAGR of 10.93% from 2019-2033 |
| Segmentation |
|
Table of Contents
- 1. Introduction
- 1.1. Research Scope
- 1.2. Market Segmentation
- 1.3. Research Methodology
- 1.4. Definitions and Assumptions
- 2. Executive Summary
- 2.1. Introduction
- 3. Market Dynamics
- 3.1. Introduction
- 3.2. Market Drivers
- 3.2.1. ; Improvement in worker productivity and decrease in worker injury; Increase in the development in IoT and connectivity technologies
- 3.3. Market Restrains
- 3.3.1. ; Growing concerns related to security of personal information; Stringent work regulations at operating facilities
- 3.4. Market Trends
- 3.4.1. The usage of Smart PPE in construction to witness a significant growth
- 4. Market Factor Analysis
- 4.1. Porters Five Forces
- 4.2. Supply/Value Chain
- 4.3. PESTEL analysis
- 4.4. Market Entropy
- 4.5. Patent/Trademark Analysis
- 5. Global Smart Personal Protective Equipment Industry Analysis, Insights and Forecast, 2019-2031
- 5.1. Market Analysis, Insights and Forecast - by Type
- 5.1.1. Eye and Face Protection
- 5.1.2. Hearing Protection
- 5.1.3. Head Protection
- 5.1.4. Fall Protection
- 5.1.5. Smart Clothing
- 5.1.6. Other Types
- 5.2. Market Analysis, Insights and Forecast - by End-user Industry
- 5.2.1. Construction
- 5.2.2. Mining
- 5.2.3. Oil and Gas
- 5.2.4. Manufacturing
- 5.2.5. Automotive
- 5.2.6. Other End-user Industries
- 5.3. Market Analysis, Insights and Forecast - by Region
- 5.3.1. North America
- 5.3.2. Europe
- 5.3.3. Asia
- 5.3.4. Australia and New Zealand
- 5.3.5. Latin America
- 5.3.6. Middle East and Africa
- 5.1. Market Analysis, Insights and Forecast - by Type
- 6. North America Smart Personal Protective Equipment Industry Analysis, Insights and Forecast, 2019-2031
- 6.1. Market Analysis, Insights and Forecast - by Type
- 6.1.1. Eye and Face Protection
- 6.1.2. Hearing Protection
- 6.1.3. Head Protection
- 6.1.4. Fall Protection
- 6.1.5. Smart Clothing
- 6.1.6. Other Types
- 6.2. Market Analysis, Insights and Forecast - by End-user Industry
- 6.2.1. Construction
- 6.2.2. Mining
- 6.2.3. Oil and Gas
- 6.2.4. Manufacturing
- 6.2.5. Automotive
- 6.2.6. Other End-user Industries
- 6.1. Market Analysis, Insights and Forecast - by Type
- 7. Europe Smart Personal Protective Equipment Industry Analysis, Insights and Forecast, 2019-2031
- 7.1. Market Analysis, Insights and Forecast - by Type
- 7.1.1. Eye and Face Protection
- 7.1.2. Hearing Protection
- 7.1.3. Head Protection
- 7.1.4. Fall Protection
- 7.1.5. Smart Clothing
- 7.1.6. Other Types
- 7.2. Market Analysis, Insights and Forecast - by End-user Industry
- 7.2.1. Construction
- 7.2.2. Mining
- 7.2.3. Oil and Gas
- 7.2.4. Manufacturing
- 7.2.5. Automotive
- 7.2.6. Other End-user Industries
- 7.1. Market Analysis, Insights and Forecast - by Type
- 8. Asia Smart Personal Protective Equipment Industry Analysis, Insights and Forecast, 2019-2031
- 8.1. Market Analysis, Insights and Forecast - by Type
- 8.1.1. Eye and Face Protection
- 8.1.2. Hearing Protection
- 8.1.3. Head Protection
- 8.1.4. Fall Protection
- 8.1.5. Smart Clothing
- 8.1.6. Other Types
- 8.2. Market Analysis, Insights and Forecast - by End-user Industry
- 8.2.1. Construction
- 8.2.2. Mining
- 8.2.3. Oil and Gas
- 8.2.4. Manufacturing
- 8.2.5. Automotive
- 8.2.6. Other End-user Industries
- 8.1. Market Analysis, Insights and Forecast - by Type
- 9. Australia and New Zealand Smart Personal Protective Equipment Industry Analysis, Insights and Forecast, 2019-2031
- 9.1. Market Analysis, Insights and Forecast - by Type
- 9.1.1. Eye and Face Protection
- 9.1.2. Hearing Protection
- 9.1.3. Head Protection
- 9.1.4. Fall Protection
- 9.1.5. Smart Clothing
- 9.1.6. Other Types
- 9.2. Market Analysis, Insights and Forecast - by End-user Industry
- 9.2.1. Construction
- 9.2.2. Mining
- 9.2.3. Oil and Gas
- 9.2.4. Manufacturing
- 9.2.5. Automotive
- 9.2.6. Other End-user Industries
- 9.1. Market Analysis, Insights and Forecast - by Type
- 10. Latin America Smart Personal Protective Equipment Industry Analysis, Insights and Forecast, 2019-2031
- 10.1. Market Analysis, Insights and Forecast - by Type
- 10.1.1. Eye and Face Protection
- 10.1.2. Hearing Protection
- 10.1.3. Head Protection
- 10.1.4. Fall Protection
- 10.1.5. Smart Clothing
- 10.1.6. Other Types
- 10.2. Market Analysis, Insights and Forecast - by End-user Industry
- 10.2.1. Construction
- 10.2.2. Mining
- 10.2.3. Oil and Gas
- 10.2.4. Manufacturing
- 10.2.5. Automotive
- 10.2.6. Other End-user Industries
- 10.1. Market Analysis, Insights and Forecast - by Type
- 11. Middle East and Africa Smart Personal Protective Equipment Industry Analysis, Insights and Forecast, 2019-2031
- 11.1. Market Analysis, Insights and Forecast - by Type
- 11.1.1. Eye and Face Protection
- 11.1.2. Hearing Protection
- 11.1.3. Head Protection
- 11.1.4. Fall Protection
- 11.1.5. Smart Clothing
- 11.1.6. Other Types
- 11.2. Market Analysis, Insights and Forecast - by End-user Industry
- 11.2.1. Construction
- 11.2.2. Mining
- 11.2.3. Oil and Gas
- 11.2.4. Manufacturing
- 11.2.5. Automotive
- 11.2.6. Other End-user Industries
- 11.1. Market Analysis, Insights and Forecast - by Type
- 12. North America Smart Personal Protective Equipment Industry Analysis, Insights and Forecast, 2019-2031
- 12.1. Market Analysis, Insights and Forecast - By Country/Sub-region
- 12.1.1 United States
- 12.1.2 Canada
- 12.1.3 Mexico
- 13. Europe Smart Personal Protective Equipment Industry Analysis, Insights and Forecast, 2019-2031
- 13.1. Market Analysis, Insights and Forecast - By Country/Sub-region
- 13.1.1 Germany
- 13.1.2 United Kingdom
- 13.1.3 France
- 13.1.4 Spain
- 13.1.5 Italy
- 13.1.6 Spain
- 13.1.7 Belgium
- 13.1.8 Netherland
- 13.1.9 Nordics
- 13.1.10 Rest of Europe
- 14. Asia Pacific Smart Personal Protective Equipment Industry Analysis, Insights and Forecast, 2019-2031
- 14.1. Market Analysis, Insights and Forecast - By Country/Sub-region
- 14.1.1 China
- 14.1.2 Japan
- 14.1.3 India
- 14.1.4 South Korea
- 14.1.5 Southeast Asia
- 14.1.6 Australia
- 14.1.7 Indonesia
- 14.1.8 Phillipes
- 14.1.9 Singapore
- 14.1.10 Thailandc
- 14.1.11 Rest of Asia Pacific
- 15. South America Smart Personal Protective Equipment Industry Analysis, Insights and Forecast, 2019-2031
- 15.1. Market Analysis, Insights and Forecast - By Country/Sub-region
- 15.1.1 Brazil
- 15.1.2 Argentina
- 15.1.3 Peru
- 15.1.4 Chile
- 15.1.5 Colombia
- 15.1.6 Ecuador
- 15.1.7 Venezuela
- 15.1.8 Rest of South America
- 16. North America Smart Personal Protective Equipment Industry Analysis, Insights and Forecast, 2019-2031
- 16.1. Market Analysis, Insights and Forecast - By Country/Sub-region
- 16.1.1 United States
- 16.1.2 Canada
- 16.1.3 Mexico
- 17. MEA Smart Personal Protective Equipment Industry Analysis, Insights and Forecast, 2019-2031
- 17.1. Market Analysis, Insights and Forecast - By Country/Sub-region
- 17.1.1 United Arab Emirates
- 17.1.2 Saudi Arabia
- 17.1.3 South Africa
- 17.1.4 Rest of Middle East and Africa
- 18. Competitive Analysis
- 18.1. Global Market Share Analysis 2024
- 18.2. Company Profiles
- 18.2.1 Honeywell International Inc
- 18.2.1.1. Overview
- 18.2.1.2. Products
- 18.2.1.3. SWOT Analysis
- 18.2.1.4. Recent Developments
- 18.2.1.5. Financials (Based on Availability)
- 18.2.2 Uvex Group
- 18.2.2.1. Overview
- 18.2.2.2. Products
- 18.2.2.3. SWOT Analysis
- 18.2.2.4. Recent Developments
- 18.2.2.5. Financials (Based on Availability)
- 18.2.3 IML Group PLC (Hazardex)
- 18.2.3.1. Overview
- 18.2.3.2. Products
- 18.2.3.3. SWOT Analysis
- 18.2.3.4. Recent Developments
- 18.2.3.5. Financials (Based on Availability)
- 18.2.4 3M Company
- 18.2.4.1. Overview
- 18.2.4.2. Products
- 18.2.4.3. SWOT Analysis
- 18.2.4.4. Recent Developments
- 18.2.4.5. Financials (Based on Availability)
- 18.2.5 Seebo Interactive LTD
- 18.2.5.1. Overview
- 18.2.5.2. Products
- 18.2.5.3. SWOT Analysis
- 18.2.5.4. Recent Developments
- 18.2.5.5. Financials (Based on Availability)
- 18.2.6 Tenacious Holdings Inc (dba Ergodyne)
- 18.2.6.1. Overview
- 18.2.6.2. Products
- 18.2.6.3. SWOT Analysis
- 18.2.6.4. Recent Developments
- 18.2.6.5. Financials (Based on Availability)
- 18.2.7 Intellinium
- 18.2.7.1. Overview
- 18.2.7.2. Products
- 18.2.7.3. SWOT Analysis
- 18.2.7.4. Recent Developments
- 18.2.7.5. Financials (Based on Availability)
- 18.2.8 Daqri
- 18.2.8.1. Overview
- 18.2.8.2. Products
- 18.2.8.3. SWOT Analysis
- 18.2.8.4. Recent Developments
- 18.2.8.5. Financials (Based on Availability)
- 18.2.9 Vuzix Corp*List Not Exhaustive
- 18.2.9.1. Overview
- 18.2.9.2. Products
- 18.2.9.3. SWOT Analysis
- 18.2.9.4. Recent Developments
- 18.2.9.5. Financials (Based on Availability)
- 18.2.10 Corvex Connected Worker
- 18.2.10.1. Overview
- 18.2.10.2. Products
- 18.2.10.3. SWOT Analysis
- 18.2.10.4. Recent Developments
- 18.2.10.5. Financials (Based on Availability)
- 18.2.1 Honeywell International Inc
List of Figures
- Figure 1: Global Smart Personal Protective Equipment Industry Revenue Breakdown (Million, %) by Region 2024 & 2032
- Figure 2: North America Smart Personal Protective Equipment Industry Revenue (Million), by Country 2024 & 2032
- Figure 3: North America Smart Personal Protective Equipment Industry Revenue Share (%), by Country 2024 & 2032
- Figure 4: Europe Smart Personal Protective Equipment Industry Revenue (Million), by Country 2024 & 2032
- Figure 5: Europe Smart Personal Protective Equipment Industry Revenue Share (%), by Country 2024 & 2032
- Figure 6: Asia Pacific Smart Personal Protective Equipment Industry Revenue (Million), by Country 2024 & 2032
- Figure 7: Asia Pacific Smart Personal Protective Equipment Industry Revenue Share (%), by Country 2024 & 2032
- Figure 8: South America Smart Personal Protective Equipment Industry Revenue (Million), by Country 2024 & 2032
- Figure 9: South America Smart Personal Protective Equipment Industry Revenue Share (%), by Country 2024 & 2032
- Figure 10: North America Smart Personal Protective Equipment Industry Revenue (Million), by Country 2024 & 2032
- Figure 11: North America Smart Personal Protective Equipment Industry Revenue Share (%), by Country 2024 & 2032
- Figure 12: MEA Smart Personal Protective Equipment Industry Revenue (Million), by Country 2024 & 2032
- Figure 13: MEA Smart Personal Protective Equipment Industry Revenue Share (%), by Country 2024 & 2032
- Figure 14: North America Smart Personal Protective Equipment Industry Revenue (Million), by Type 2024 & 2032
- Figure 15: North America Smart Personal Protective Equipment Industry Revenue Share (%), by Type 2024 & 2032
- Figure 16: North America Smart Personal Protective Equipment Industry Revenue (Million), by End-user Industry 2024 & 2032
- Figure 17: North America Smart Personal Protective Equipment Industry Revenue Share (%), by End-user Industry 2024 & 2032
- Figure 18: North America Smart Personal Protective Equipment Industry Revenue (Million), by Country 2024 & 2032
- Figure 19: North America Smart Personal Protective Equipment Industry Revenue Share (%), by Country 2024 & 2032
- Figure 20: Europe Smart Personal Protective Equipment Industry Revenue (Million), by Type 2024 & 2032
- Figure 21: Europe Smart Personal Protective Equipment Industry Revenue Share (%), by Type 2024 & 2032
- Figure 22: Europe Smart Personal Protective Equipment Industry Revenue (Million), by End-user Industry 2024 & 2032
- Figure 23: Europe Smart Personal Protective Equipment Industry Revenue Share (%), by End-user Industry 2024 & 2032
- Figure 24: Europe Smart Personal Protective Equipment Industry Revenue (Million), by Country 2024 & 2032
- Figure 25: Europe Smart Personal Protective Equipment Industry Revenue Share (%), by Country 2024 & 2032
- Figure 26: Asia Smart Personal Protective Equipment Industry Revenue (Million), by Type 2024 & 2032
- Figure 27: Asia Smart Personal Protective Equipment Industry Revenue Share (%), by Type 2024 & 2032
- Figure 28: Asia Smart Personal Protective Equipment Industry Revenue (Million), by End-user Industry 2024 & 2032
- Figure 29: Asia Smart Personal Protective Equipment Industry Revenue Share (%), by End-user Industry 2024 & 2032
- Figure 30: Asia Smart Personal Protective Equipment Industry Revenue (Million), by Country 2024 & 2032
- Figure 31: Asia Smart Personal Protective Equipment Industry Revenue Share (%), by Country 2024 & 2032
- Figure 32: Australia and New Zealand Smart Personal Protective Equipment Industry Revenue (Million), by Type 2024 & 2032
- Figure 33: Australia and New Zealand Smart Personal Protective Equipment Industry Revenue Share (%), by Type 2024 & 2032
- Figure 34: Australia and New Zealand Smart Personal Protective Equipment Industry Revenue (Million), by End-user Industry 2024 & 2032
- Figure 35: Australia and New Zealand Smart Personal Protective Equipment Industry Revenue Share (%), by End-user Industry 2024 & 2032
- Figure 36: Australia and New Zealand Smart Personal Protective Equipment Industry Revenue (Million), by Country 2024 & 2032
- Figure 37: Australia and New Zealand Smart Personal Protective Equipment Industry Revenue Share (%), by Country 2024 & 2032
- Figure 38: Latin America Smart Personal Protective Equipment Industry Revenue (Million), by Type 2024 & 2032
- Figure 39: Latin America Smart Personal Protective Equipment Industry Revenue Share (%), by Type 2024 & 2032
- Figure 40: Latin America Smart Personal Protective Equipment Industry Revenue (Million), by End-user Industry 2024 & 2032
- Figure 41: Latin America Smart Personal Protective Equipment Industry Revenue Share (%), by End-user Industry 2024 & 2032
- Figure 42: Latin America Smart Personal Protective Equipment Industry Revenue (Million), by Country 2024 & 2032
- Figure 43: Latin America Smart Personal Protective Equipment Industry Revenue Share (%), by Country 2024 & 2032
- Figure 44: Middle East and Africa Smart Personal Protective Equipment Industry Revenue (Million), by Type 2024 & 2032
- Figure 45: Middle East and Africa Smart Personal Protective Equipment Industry Revenue Share (%), by Type 2024 & 2032
- Figure 46: Middle East and Africa Smart Personal Protective Equipment Industry Revenue (Million), by End-user Industry 2024 & 2032
- Figure 47: Middle East and Africa Smart Personal Protective Equipment Industry Revenue Share (%), by End-user Industry 2024 & 2032
- Figure 48: Middle East and Africa Smart Personal Protective Equipment Industry Revenue (Million), by Country 2024 & 2032
- Figure 49: Middle East and Africa Smart Personal Protective Equipment Industry Revenue Share (%), by Country 2024 & 2032
List of Tables
- Table 1: Global Smart Personal Protective Equipment Industry Revenue Million Forecast, by Region 2019 & 2032
- Table 2: Global Smart Personal Protective Equipment Industry Revenue Million Forecast, by Type 2019 & 2032
- Table 3: Global Smart Personal Protective Equipment Industry Revenue Million Forecast, by End-user Industry 2019 & 2032
- Table 4: Global Smart Personal Protective Equipment Industry Revenue Million Forecast, by Region 2019 & 2032
- Table 5: Global Smart Personal Protective Equipment Industry Revenue Million Forecast, by Country 2019 & 2032
- Table 6: United States Smart Personal Protective Equipment Industry Revenue (Million) Forecast, by Application 2019 & 2032
- Table 7: Canada Smart Personal Protective Equipment Industry Revenue (Million) Forecast, by Application 2019 & 2032
- Table 8: Mexico Smart Personal Protective Equipment Industry Revenue (Million) Forecast, by Application 2019 & 2032
- Table 9: Global Smart Personal Protective Equipment Industry Revenue Million Forecast, by Country 2019 & 2032
- Table 10: Germany Smart Personal Protective Equipment Industry Revenue (Million) Forecast, by Application 2019 & 2032
- Table 11: United Kingdom Smart Personal Protective Equipment Industry Revenue (Million) Forecast, by Application 2019 & 2032
- Table 12: France Smart Personal Protective Equipment Industry Revenue (Million) Forecast, by Application 2019 & 2032
- Table 13: Spain Smart Personal Protective Equipment Industry Revenue (Million) Forecast, by Application 2019 & 2032
- Table 14: Italy Smart Personal Protective Equipment Industry Revenue (Million) Forecast, by Application 2019 & 2032
- Table 15: Spain Smart Personal Protective Equipment Industry Revenue (Million) Forecast, by Application 2019 & 2032
- Table 16: Belgium Smart Personal Protective Equipment Industry Revenue (Million) Forecast, by Application 2019 & 2032
- Table 17: Netherland Smart Personal Protective Equipment Industry Revenue (Million) Forecast, by Application 2019 & 2032
- Table 18: Nordics Smart Personal Protective Equipment Industry Revenue (Million) Forecast, by Application 2019 & 2032
- Table 19: Rest of Europe Smart Personal Protective Equipment Industry Revenue (Million) Forecast, by Application 2019 & 2032
- Table 20: Global Smart Personal Protective Equipment Industry Revenue Million Forecast, by Country 2019 & 2032
- Table 21: China Smart Personal Protective Equipment Industry Revenue (Million) Forecast, by Application 2019 & 2032
- Table 22: Japan Smart Personal Protective Equipment Industry Revenue (Million) Forecast, by Application 2019 & 2032
- Table 23: India Smart Personal Protective Equipment Industry Revenue (Million) Forecast, by Application 2019 & 2032
- Table 24: South Korea Smart Personal Protective Equipment Industry Revenue (Million) Forecast, by Application 2019 & 2032
- Table 25: Southeast Asia Smart Personal Protective Equipment Industry Revenue (Million) Forecast, by Application 2019 & 2032
- Table 26: Australia Smart Personal Protective Equipment Industry Revenue (Million) Forecast, by Application 2019 & 2032
- Table 27: Indonesia Smart Personal Protective Equipment Industry Revenue (Million) Forecast, by Application 2019 & 2032
- Table 28: Phillipes Smart Personal Protective Equipment Industry Revenue (Million) Forecast, by Application 2019 & 2032
- Table 29: Singapore Smart Personal Protective Equipment Industry Revenue (Million) Forecast, by Application 2019 & 2032
- Table 30: Thailandc Smart Personal Protective Equipment Industry Revenue (Million) Forecast, by Application 2019 & 2032
- Table 31: Rest of Asia Pacific Smart Personal Protective Equipment Industry Revenue (Million) Forecast, by Application 2019 & 2032
- Table 32: Global Smart Personal Protective Equipment Industry Revenue Million Forecast, by Country 2019 & 2032
- Table 33: Brazil Smart Personal Protective Equipment Industry Revenue (Million) Forecast, by Application 2019 & 2032
- Table 34: Argentina Smart Personal Protective Equipment Industry Revenue (Million) Forecast, by Application 2019 & 2032
- Table 35: Peru Smart Personal Protective Equipment Industry Revenue (Million) Forecast, by Application 2019 & 2032
- Table 36: Chile Smart Personal Protective Equipment Industry Revenue (Million) Forecast, by Application 2019 & 2032
- Table 37: Colombia Smart Personal Protective Equipment Industry Revenue (Million) Forecast, by Application 2019 & 2032
- Table 38: Ecuador Smart Personal Protective Equipment Industry Revenue (Million) Forecast, by Application 2019 & 2032
- Table 39: Venezuela Smart Personal Protective Equipment Industry Revenue (Million) Forecast, by Application 2019 & 2032
- Table 40: Rest of South America Smart Personal Protective Equipment Industry Revenue (Million) Forecast, by Application 2019 & 2032
- Table 41: Global Smart Personal Protective Equipment Industry Revenue Million Forecast, by Country 2019 & 2032
- Table 42: United States Smart Personal Protective Equipment Industry Revenue (Million) Forecast, by Application 2019 & 2032
- Table 43: Canada Smart Personal Protective Equipment Industry Revenue (Million) Forecast, by Application 2019 & 2032
- Table 44: Mexico Smart Personal Protective Equipment Industry Revenue (Million) Forecast, by Application 2019 & 2032
- Table 45: Global Smart Personal Protective Equipment Industry Revenue Million Forecast, by Country 2019 & 2032
- Table 46: United Arab Emirates Smart Personal Protective Equipment Industry Revenue (Million) Forecast, by Application 2019 & 2032
- Table 47: Saudi Arabia Smart Personal Protective Equipment Industry Revenue (Million) Forecast, by Application 2019 & 2032
- Table 48: South Africa Smart Personal Protective Equipment Industry Revenue (Million) Forecast, by Application 2019 & 2032
- Table 49: Rest of Middle East and Africa Smart Personal Protective Equipment Industry Revenue (Million) Forecast, by Application 2019 & 2032
- Table 50: Global Smart Personal Protective Equipment Industry Revenue Million Forecast, by Type 2019 & 2032
- Table 51: Global Smart Personal Protective Equipment Industry Revenue Million Forecast, by End-user Industry 2019 & 2032
- Table 52: Global Smart Personal Protective Equipment Industry Revenue Million Forecast, by Country 2019 & 2032
- Table 53: Global Smart Personal Protective Equipment Industry Revenue Million Forecast, by Type 2019 & 2032
- Table 54: Global Smart Personal Protective Equipment Industry Revenue Million Forecast, by End-user Industry 2019 & 2032
- Table 55: Global Smart Personal Protective Equipment Industry Revenue Million Forecast, by Country 2019 & 2032
- Table 56: Global Smart Personal Protective Equipment Industry Revenue Million Forecast, by Type 2019 & 2032
- Table 57: Global Smart Personal Protective Equipment Industry Revenue Million Forecast, by End-user Industry 2019 & 2032
- Table 58: Global Smart Personal Protective Equipment Industry Revenue Million Forecast, by Country 2019 & 2032
- Table 59: Global Smart Personal Protective Equipment Industry Revenue Million Forecast, by Type 2019 & 2032
- Table 60: Global Smart Personal Protective Equipment Industry Revenue Million Forecast, by End-user Industry 2019 & 2032
- Table 61: Global Smart Personal Protective Equipment Industry Revenue Million Forecast, by Country 2019 & 2032
- Table 62: Global Smart Personal Protective Equipment Industry Revenue Million Forecast, by Type 2019 & 2032
- Table 63: Global Smart Personal Protective Equipment Industry Revenue Million Forecast, by End-user Industry 2019 & 2032
- Table 64: Global Smart Personal Protective Equipment Industry Revenue Million Forecast, by Country 2019 & 2032
- Table 65: Global Smart Personal Protective Equipment Industry Revenue Million Forecast, by Type 2019 & 2032
- Table 66: Global Smart Personal Protective Equipment Industry Revenue Million Forecast, by End-user Industry 2019 & 2032
- Table 67: Global Smart Personal Protective Equipment Industry Revenue Million Forecast, by Country 2019 & 2032
Frequently Asked Questions
1. What is the projected Compound Annual Growth Rate (CAGR) of the Smart Personal Protective Equipment Industry?
The projected CAGR is approximately 10.93%.
2. Which companies are prominent players in the Smart Personal Protective Equipment Industry?
Key companies in the market include Honeywell International Inc, Uvex Group, IML Group PLC (Hazardex), 3M Company, Seebo Interactive LTD, Tenacious Holdings Inc (dba Ergodyne), Intellinium, Daqri, Vuzix Corp*List Not Exhaustive, Corvex Connected Worker.
3. What are the main segments of the Smart Personal Protective Equipment Industry?
The market segments include Type, End-user Industry.
4. Can you provide details about the market size?
The market size is estimated to be USD 24.90 Million as of 2022.
5. What are some drivers contributing to market growth?
; Improvement in worker productivity and decrease in worker injury; Increase in the development in IoT and connectivity technologies.
6. What are the notable trends driving market growth?
The usage of Smart PPE in construction to witness a significant growth.
7. Are there any restraints impacting market growth?
; Growing concerns related to security of personal information; Stringent work regulations at operating facilities.
8. Can you provide examples of recent developments in the market?
N/A
9. What pricing options are available for accessing the report?
Pricing options include single-user, multi-user, and enterprise licenses priced at USD 4750, USD 5250, and USD 8750 respectively.
10. Is the market size provided in terms of value or volume?
The market size is provided in terms of value, measured in Million.
11. Are there any specific market keywords associated with the report?
Yes, the market keyword associated with the report is "Smart Personal Protective Equipment Industry," which aids in identifying and referencing the specific market segment covered.
12. How do I determine which pricing option suits my needs best?
The pricing options vary based on user requirements and access needs. Individual users may opt for single-user licenses, while businesses requiring broader access may choose multi-user or enterprise licenses for cost-effective access to the report.
13. Are there any additional resources or data provided in the Smart Personal Protective Equipment Industry report?
While the report offers comprehensive insights, it's advisable to review the specific contents or supplementary materials provided to ascertain if additional resources or data are available.
14. How can I stay updated on further developments or reports in the Smart Personal Protective Equipment Industry?
To stay informed about further developments, trends, and reports in the Smart Personal Protective Equipment Industry, consider subscribing to industry newsletters, following relevant companies and organizations, or regularly checking reputable industry news sources and publications.
Methodology
Step 1 - Identification of Relevant Samples Size from Population Database


Step 2 - Approaches for Defining Global Market Size (Value, Volume* & Price*)

Note*: In applicable scenarios
Step 3 - Data Sources
Primary Research
- Web Analytics
- Survey Reports
- Research Institute
- Latest Research Reports
- Opinion Leaders
Secondary Research
- Annual Reports
- White Paper
- Latest Press Release
- Industry Association
- Paid Database
- Investor Presentations

Step 4 - Data Triangulation
Involves using different sources of information in order to increase the validity of a study
These sources are likely to be stakeholders in a program - participants, other researchers, program staff, other community members, and so on.
Then we put all data in single framework & apply various statistical tools to find out the dynamic on the market.
During the analysis stage, feedback from the stakeholder groups would be compared to determine areas of agreement as well as areas of divergence


