
Key Insights
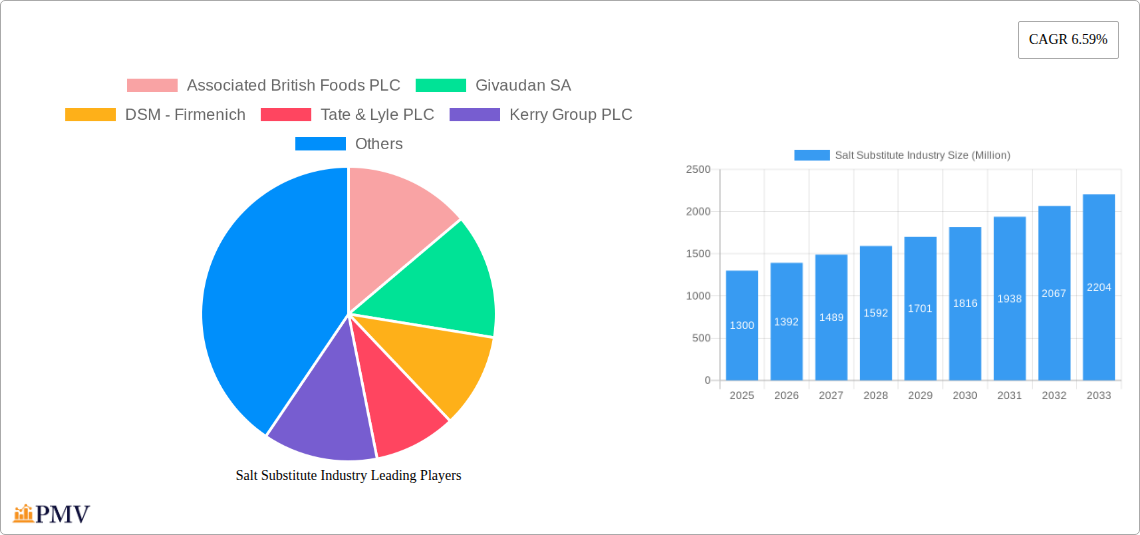
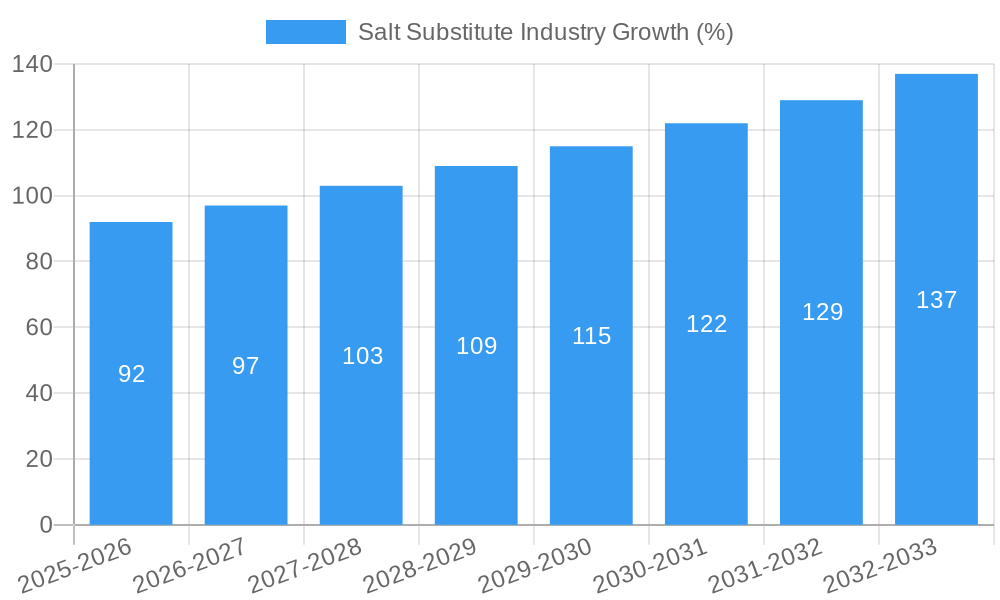
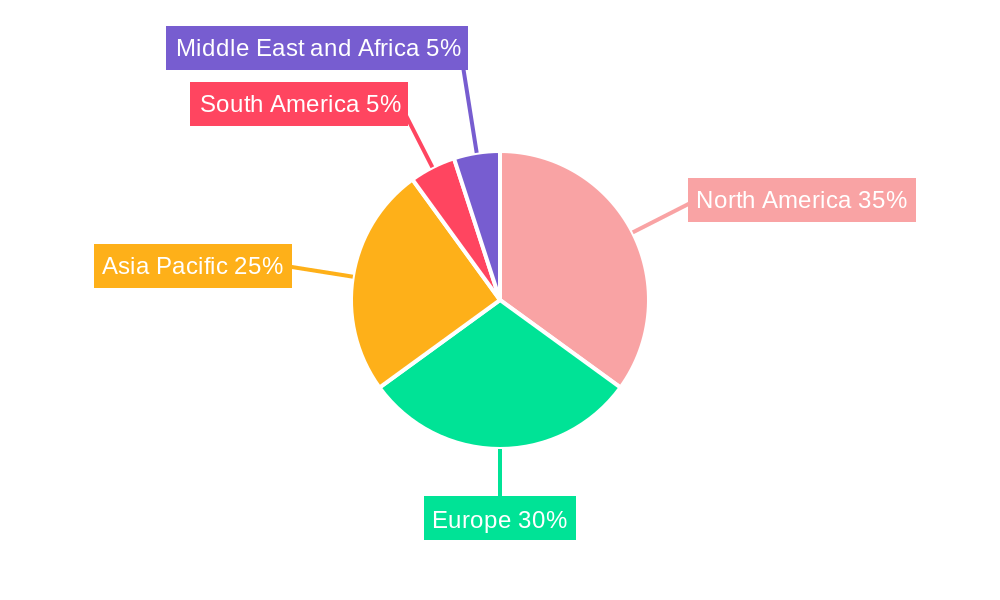
The global salt substitute market, valued at $1.3 billion in 2025, is projected to experience robust growth, driven by increasing health consciousness and the rising prevalence of hypertension globally. A Compound Annual Growth Rate (CAGR) of 6.59% from 2025 to 2033 indicates a significant expansion of this market over the forecast period. Key drivers include growing awareness of the negative health impacts of excessive sodium intake, coupled with the increasing adoption of healthier dietary habits. The rising incidence of cardiovascular diseases, directly linked to high sodium consumption, further fuels market demand. Consumers are increasingly seeking low-sodium alternatives to traditional table salt, leading to heightened demand for various types of salt substitutes, including mineral salts, amino acids, and yeast extracts. The food and beverage industry is a major driver, with significant adoption in bakery and confectionery, meat and poultry processing, and ready-to-eat meals. While regulatory measures promoting sodium reduction play a positive role, potential restraints could include consumer preference for the taste of regular salt and the relatively higher cost of many salt substitutes compared to conventional salt. The market segmentation by application highlights the diverse uses of salt substitutes across food categories, while the type-based segmentation reflects the range of available alternatives catering to different consumer preferences and manufacturing needs. Major players like Associated British Foods, Givaudan, and DSM are actively engaged in product innovation and market expansion to capitalize on the growing demand. Regional variations in consumer health awareness and dietary habits will influence the market share distribution across North America, Europe, Asia-Pacific, South America, and the Middle East & Africa, with developed regions expected to dominate initially but with significant growth potential in emerging economies.
The future success of salt substitute manufacturers hinges on providing innovative products that effectively address the taste and texture challenges often associated with these alternatives. Strategic partnerships with food manufacturers and retailers will be crucial in increasing market penetration. Furthermore, consumer education campaigns emphasizing the health benefits of salt reduction can play a significant role in boosting demand. The market is expected to witness increased competition with both established players and emerging companies seeking to capitalize on this burgeoning segment. Continuous research and development efforts focused on creating flavorful and cost-effective salt substitutes will be vital for maintaining a competitive edge in the market. Product diversification and geographic expansion will also be key strategies for achieving sustained growth in this health-conscious market.
Salt Substitute Industry: A Comprehensive Market Report (2019-2033)
This in-depth report provides a comprehensive analysis of the global salt substitute industry, covering market size, segmentation, competitive landscape, and future growth projections from 2019 to 2033. The study period spans 2019-2024 (historical period), with 2025 as the base and estimated year, and a forecast period of 2025-2033. Valuations are expressed in Millions. The report is essential for industry players, investors, and researchers seeking actionable insights into this dynamic market.
Salt Substitute Industry Market Structure & Competitive Dynamics
The global salt substitute market exhibits a moderately concentrated structure, with key players like Associated British Foods PLC, Givaudan SA, DSM-Firmenich, Tate & Lyle PLC, Kerry Group PLC, Cargill Inc, Corbion NV, Angel Yeast Co Ltd, Ajinomoto Co Inc, and Lallemand Inc. holding significant market share. However, the presence of several smaller, specialized players fosters a dynamic competitive landscape. Innovation ecosystems are crucial, with companies investing heavily in R&D to develop novel salt substitutes with enhanced taste and functionality. Regulatory frameworks, particularly those concerning food safety and labeling, significantly influence market dynamics. The increasing awareness of the health risks associated with excessive sodium intake drives demand for salt substitutes, while the availability of alternative flavor enhancers introduces competitive pressures. Mergers and acquisitions (M&A) activity is moderate but crucial in shaping market consolidation and technological advancements. While precise market share data for individual companies isn't readily available for this report, estimates place the top 5 players controlling approximately xx% of the market. M&A deal values in the past five years have averaged approximately xx Million annually.
Salt Substitute Industry Industry Trends & Insights
The salt substitute market is experiencing robust growth, driven primarily by the rising prevalence of hypertension and cardiovascular diseases globally. Consumers are increasingly adopting healthier lifestyles and seeking low-sodium food options. This growing health consciousness is a key factor driving market expansion. Technological advancements, such as the development of innovative salt substitutes with improved taste and functionality, are further fueling market growth. The Compound Annual Growth Rate (CAGR) is estimated at xx% during the forecast period (2025-2033). Market penetration for salt substitutes is still relatively low in many regions, presenting considerable growth potential. However, competitive dynamics, including the entry of new players and product differentiation strategies, are shaping market evolution. The successful commercialization of Kerry Group's TasteSense Salt, a sodium reduction solution launched in April 2024, exemplifies this technological drive towards enhanced taste profiles in low-sodium products. The increasing prevalence of processed food consumption also presents significant opportunities for market expansion.
Dominant Markets & Segments in Salt Substitute Industry
The North American and European regions currently dominate the salt substitute market due to high consumer awareness of health issues and a strong regulatory focus on reducing sodium intake. Within applications, the Bakery and Confectionery, Snacks, and Meat and Poultry segments represent the most significant market shares, driven by the high sodium content in these product categories. The Mineral Salts segment maintains a dominant position by type due to its cost-effectiveness and wide availability.
Key Drivers in Dominant Regions:
- Stringent regulatory frameworks related to sodium reduction in processed foods.
- Increasing consumer awareness of health risks associated with high sodium intake.
- Well-established food processing industries.
- High disposable income.
Key Drivers in Dominant Segments (Application):
- Growing demand for healthier and low-sodium processed foods.
- Technological advancements enabling effective sodium reduction without compromising taste.
- Increasing preference for convenient and ready-to-eat food products.
Key Drivers in Dominant Segments (Type):
- Cost-effectiveness compared to other salt substitutes.
- Wide availability and easy incorporation into food products.
- Established supply chains and production infrastructure.
The detailed analysis within the full report provides granular insights into specific country-level dynamics and regional variances.
Salt Substitute Industry Product Innovations
Recent product innovations focus on enhancing the taste and functionality of salt substitutes, addressing a key challenge in market adoption. Companies are developing new formulations that minimize the bitter or metallic aftertaste often associated with traditional salt substitutes, using novel techniques like mineral salt blending and the incorporation of amino acids or yeast extracts to create a more natural salty flavor. This technological focus addresses consumer preferences, leading to increased market acceptance and expansion. TasteSense Salt, launched by Kerry Group in April 2024, exemplifies this trend with its innovative approach to sodium reduction without sacrificing the desired taste profile.
Report Segmentation & Scope
This report provides a detailed segmentation of the salt substitute market across various applications (Bakery and Confectionery, Snacks, Meat and Poultry, Beverages, Soups, Salads, Sauces and Dressings, Other Applications) and types (Mineral Salts, Amino Acids, Yeast Extracts, Hydrolyzed Vegetable Protein, Other Types). Each segment's analysis includes growth projections, market size estimates for the forecast period (2025-2033), and an assessment of the competitive landscape. For example, the Bakery and Confectionery segment is projected to witness a CAGR of xx%, driven by the demand for healthier baked goods. Similarly, the Mineral Salts segment is expected to retain its dominant position, accounting for xx% of the total market in 2033. The report also outlines the market share and competitive dynamics within each subsegment.
Key Drivers of Salt Substitute Industry Growth
The primary growth drivers for the salt substitute market include rising health consciousness among consumers, increasing prevalence of hypertension and related diseases, stringent government regulations promoting sodium reduction in processed foods, and the continuous innovation of products with enhanced taste and functionality. For instance, the partnership between DSM-Firmenich and Deloitte (June 2024) highlights the industry’s focus on sustainability and efficiency. This trend aligns with broader societal movements towards healthier and more environmentally conscious consumption.
Challenges in the Salt Substitute Industry Sector
The salt substitute industry faces challenges including the relatively high cost of some substitutes compared to table salt, the development of a consistent and palatable taste profile that rivals traditional salt, and potential supply chain disruptions impacting the availability of raw materials. Furthermore, regulatory hurdles and the need for robust quality control and standardization across different markets can pose significant challenges to market expansion. These factors can lead to price fluctuations and impact market growth. These challenges, while substantial, are being actively addressed by industry innovation and strategic partnerships.
Leading Players in the Salt Substitute Industry Market
- Associated British Foods PLC
- Givaudan SA
- DSM - Firmenich
- Tate & Lyle PLC
- Kerry Group PLC
- Cargill Inc
- Corbion NV
- Angel Yeast Co Ltd
- Ajinomoto Co Inc
- Lallemand Inc
Key Developments in Salt Substitute Industry Sector
June 2024: DSM-Firmenich partnered with Deloitte to enhance sustainable food systems, leveraging DSM-Firmenich’s Sustell platform for assessing the environmental impact of animal protein production. This collaboration positions the company as a leader in sustainable food solutions.
May 2024: Corbion expanded its partnership with IMCD to distribute its food and beverage offerings in Thailand. This move expands Corbion's reach in a significant and growing market.
April 2024: Kerry Group launched TasteSense Salt, a sodium reduction solution that provides a salty taste without the added sodium. This product launch is a significant development, addressing a key challenge in the industry – improving taste in low-sodium products.
Strategic Salt Substitute Industry Market Outlook
The future of the salt substitute market appears bright, driven by sustained growth in health-conscious consumer segments, increased regulatory pressure, and continued innovation in product development. Opportunities exist in expanding into emerging markets, developing innovative product formulations to cater to diverse palates, and building strategic partnerships to enhance supply chain efficiencies. The market is poised for further growth, with a focus on sustainability and healthier food choices shaping future market dynamics. The projected CAGR, coupled with ongoing product innovation and strategic market expansions, positions the salt substitute industry for considerable growth over the next decade.
Salt Substitute Industry Segmentation
-
1. Type
- 1.1. Mineral Salts
- 1.2. Amino Acids
- 1.3. Yeast Extracts
- 1.4. Hydrolyzed Vegetable Protein
- 1.5. Other Types
-
2. Application
- 2.1. Bakery and Confectionery
- 2.2. Snacks
- 2.3. Meat and Poultry
- 2.4. Beverages
- 2.5. Soups, Salads, Sauces, and Dressings
- 2.6. Other Applications
Salt Substitute Industry Segmentation By Geography
-
1. North America
- 1.1. United States
- 1.2. Canada
- 1.3. Mexico
- 1.4. Rest of North America
-
2. Europe
- 2.1. United Kingdom
- 2.2. Germany
- 2.3. France
- 2.4. Russia
- 2.5. Italy
- 2.6. Spain
- 2.7. Rest of Europe
-
3. Asia Pacific
- 3.1. India
- 3.2. China
- 3.3. Japan
- 3.4. Australia
- 3.5. Rest of Asia Pacific
-
4. South America
- 4.1. Brazil
- 4.2. Argentina
- 4.3. Rest of South America
-
5. Middle East and Africa
- 5.1. South Africa
- 5.2. Saudi Arabia
- 5.3. Rest of Middle East and Africa
Salt Substitute Industry REPORT HIGHLIGHTS
| Aspects | Details |
|---|---|
| Study Period | 2019-2033 |
| Base Year | 2024 |
| Estimated Year | 2025 |
| Forecast Period | 2025-2033 |
| Historical Period | 2019-2024 |
| Growth Rate | CAGR of 6.59% from 2019-2033 |
| Segmentation |
|
Table of Contents
- 1. Introduction
- 1.1. Research Scope
- 1.2. Market Segmentation
- 1.3. Research Methodology
- 1.4. Definitions and Assumptions
- 2. Executive Summary
- 2.1. Introduction
- 3. Market Dynamics
- 3.1. Introduction
- 3.2. Market Drivers
- 3.2.1. Surge In Hypertension
- 3.3. Market Restrains
- 3.3.1. Challenges And Opportunities In The Salt Substitute Market Amidst Rising Common Salt Production
- 3.4. Market Trends
- 3.4.1. Rising Hypertension Rates Drive Demand for Salt Substitutes on a Global Scale
- 4. Market Factor Analysis
- 4.1. Porters Five Forces
- 4.2. Supply/Value Chain
- 4.3. PESTEL analysis
- 4.4. Market Entropy
- 4.5. Patent/Trademark Analysis
- 5. Global Salt Substitute Industry Analysis, Insights and Forecast, 2019-2031
- 5.1. Market Analysis, Insights and Forecast - by Type
- 5.1.1. Mineral Salts
- 5.1.2. Amino Acids
- 5.1.3. Yeast Extracts
- 5.1.4. Hydrolyzed Vegetable Protein
- 5.1.5. Other Types
- 5.2. Market Analysis, Insights and Forecast - by Application
- 5.2.1. Bakery and Confectionery
- 5.2.2. Snacks
- 5.2.3. Meat and Poultry
- 5.2.4. Beverages
- 5.2.5. Soups, Salads, Sauces, and Dressings
- 5.2.6. Other Applications
- 5.3. Market Analysis, Insights and Forecast - by Region
- 5.3.1. North America
- 5.3.2. Europe
- 5.3.3. Asia Pacific
- 5.3.4. South America
- 5.3.5. Middle East and Africa
- 5.1. Market Analysis, Insights and Forecast - by Type
- 6. North America Salt Substitute Industry Analysis, Insights and Forecast, 2019-2031
- 6.1. Market Analysis, Insights and Forecast - by Type
- 6.1.1. Mineral Salts
- 6.1.2. Amino Acids
- 6.1.3. Yeast Extracts
- 6.1.4. Hydrolyzed Vegetable Protein
- 6.1.5. Other Types
- 6.2. Market Analysis, Insights and Forecast - by Application
- 6.2.1. Bakery and Confectionery
- 6.2.2. Snacks
- 6.2.3. Meat and Poultry
- 6.2.4. Beverages
- 6.2.5. Soups, Salads, Sauces, and Dressings
- 6.2.6. Other Applications
- 6.1. Market Analysis, Insights and Forecast - by Type
- 7. Europe Salt Substitute Industry Analysis, Insights and Forecast, 2019-2031
- 7.1. Market Analysis, Insights and Forecast - by Type
- 7.1.1. Mineral Salts
- 7.1.2. Amino Acids
- 7.1.3. Yeast Extracts
- 7.1.4. Hydrolyzed Vegetable Protein
- 7.1.5. Other Types
- 7.2. Market Analysis, Insights and Forecast - by Application
- 7.2.1. Bakery and Confectionery
- 7.2.2. Snacks
- 7.2.3. Meat and Poultry
- 7.2.4. Beverages
- 7.2.5. Soups, Salads, Sauces, and Dressings
- 7.2.6. Other Applications
- 7.1. Market Analysis, Insights and Forecast - by Type
- 8. Asia Pacific Salt Substitute Industry Analysis, Insights and Forecast, 2019-2031
- 8.1. Market Analysis, Insights and Forecast - by Type
- 8.1.1. Mineral Salts
- 8.1.2. Amino Acids
- 8.1.3. Yeast Extracts
- 8.1.4. Hydrolyzed Vegetable Protein
- 8.1.5. Other Types
- 8.2. Market Analysis, Insights and Forecast - by Application
- 8.2.1. Bakery and Confectionery
- 8.2.2. Snacks
- 8.2.3. Meat and Poultry
- 8.2.4. Beverages
- 8.2.5. Soups, Salads, Sauces, and Dressings
- 8.2.6. Other Applications
- 8.1. Market Analysis, Insights and Forecast - by Type
- 9. South America Salt Substitute Industry Analysis, Insights and Forecast, 2019-2031
- 9.1. Market Analysis, Insights and Forecast - by Type
- 9.1.1. Mineral Salts
- 9.1.2. Amino Acids
- 9.1.3. Yeast Extracts
- 9.1.4. Hydrolyzed Vegetable Protein
- 9.1.5. Other Types
- 9.2. Market Analysis, Insights and Forecast - by Application
- 9.2.1. Bakery and Confectionery
- 9.2.2. Snacks
- 9.2.3. Meat and Poultry
- 9.2.4. Beverages
- 9.2.5. Soups, Salads, Sauces, and Dressings
- 9.2.6. Other Applications
- 9.1. Market Analysis, Insights and Forecast - by Type
- 10. Middle East and Africa Salt Substitute Industry Analysis, Insights and Forecast, 2019-2031
- 10.1. Market Analysis, Insights and Forecast - by Type
- 10.1.1. Mineral Salts
- 10.1.2. Amino Acids
- 10.1.3. Yeast Extracts
- 10.1.4. Hydrolyzed Vegetable Protein
- 10.1.5. Other Types
- 10.2. Market Analysis, Insights and Forecast - by Application
- 10.2.1. Bakery and Confectionery
- 10.2.2. Snacks
- 10.2.3. Meat and Poultry
- 10.2.4. Beverages
- 10.2.5. Soups, Salads, Sauces, and Dressings
- 10.2.6. Other Applications
- 10.1. Market Analysis, Insights and Forecast - by Type
- 11. North America Salt Substitute Industry Analysis, Insights and Forecast, 2019-2031
- 11.1. Market Analysis, Insights and Forecast - By Country/Sub-region
- 11.1.1 United States
- 11.1.2 Canada
- 11.1.3 Mexico
- 11.1.4 Rest of North America
- 12. Europe Salt Substitute Industry Analysis, Insights and Forecast, 2019-2031
- 12.1. Market Analysis, Insights and Forecast - By Country/Sub-region
- 12.1.1 United Kingdom
- 12.1.2 Germany
- 12.1.3 France
- 12.1.4 Russia
- 12.1.5 Italy
- 12.1.6 Spain
- 12.1.7 Rest of Europe
- 13. Asia Pacific Salt Substitute Industry Analysis, Insights and Forecast, 2019-2031
- 13.1. Market Analysis, Insights and Forecast - By Country/Sub-region
- 13.1.1 India
- 13.1.2 China
- 13.1.3 Japan
- 13.1.4 Australia
- 13.1.5 Rest of Asia Pacific
- 14. South America Salt Substitute Industry Analysis, Insights and Forecast, 2019-2031
- 14.1. Market Analysis, Insights and Forecast - By Country/Sub-region
- 14.1.1 Brazil
- 14.1.2 Argentina
- 14.1.3 Rest of South America
- 15. Middle East and Africa Salt Substitute Industry Analysis, Insights and Forecast, 2019-2031
- 15.1. Market Analysis, Insights and Forecast - By Country/Sub-region
- 15.1.1 South Africa
- 15.1.2 Saudi Arabia
- 15.1.3 Rest of Middle East and Africa
- 16. Competitive Analysis
- 16.1. Global Market Share Analysis 2024
- 16.2. Company Profiles
- 16.2.1 Associated British Foods PLC
- 16.2.1.1. Overview
- 16.2.1.2. Products
- 16.2.1.3. SWOT Analysis
- 16.2.1.4. Recent Developments
- 16.2.1.5. Financials (Based on Availability)
- 16.2.2 Givaudan SA
- 16.2.2.1. Overview
- 16.2.2.2. Products
- 16.2.2.3. SWOT Analysis
- 16.2.2.4. Recent Developments
- 16.2.2.5. Financials (Based on Availability)
- 16.2.3 DSM - Firmenich
- 16.2.3.1. Overview
- 16.2.3.2. Products
- 16.2.3.3. SWOT Analysis
- 16.2.3.4. Recent Developments
- 16.2.3.5. Financials (Based on Availability)
- 16.2.4 Tate & Lyle PLC
- 16.2.4.1. Overview
- 16.2.4.2. Products
- 16.2.4.3. SWOT Analysis
- 16.2.4.4. Recent Developments
- 16.2.4.5. Financials (Based on Availability)
- 16.2.5 Kerry Group PLC
- 16.2.5.1. Overview
- 16.2.5.2. Products
- 16.2.5.3. SWOT Analysis
- 16.2.5.4. Recent Developments
- 16.2.5.5. Financials (Based on Availability)
- 16.2.6 Cargill Inc
- 16.2.6.1. Overview
- 16.2.6.2. Products
- 16.2.6.3. SWOT Analysis
- 16.2.6.4. Recent Developments
- 16.2.6.5. Financials (Based on Availability)
- 16.2.7 Corbion NV
- 16.2.7.1. Overview
- 16.2.7.2. Products
- 16.2.7.3. SWOT Analysis
- 16.2.7.4. Recent Developments
- 16.2.7.5. Financials (Based on Availability)
- 16.2.8 Angel Yeast Co Ltd
- 16.2.8.1. Overview
- 16.2.8.2. Products
- 16.2.8.3. SWOT Analysis
- 16.2.8.4. Recent Developments
- 16.2.8.5. Financials (Based on Availability)
- 16.2.9 Ajinomoto Co Inc *List Not Exhaustive
- 16.2.9.1. Overview
- 16.2.9.2. Products
- 16.2.9.3. SWOT Analysis
- 16.2.9.4. Recent Developments
- 16.2.9.5. Financials (Based on Availability)
- 16.2.10 Lallemand Inc
- 16.2.10.1. Overview
- 16.2.10.2. Products
- 16.2.10.3. SWOT Analysis
- 16.2.10.4. Recent Developments
- 16.2.10.5. Financials (Based on Availability)
- 16.2.1 Associated British Foods PLC
List of Figures
- Figure 1: Global Salt Substitute Industry Revenue Breakdown (Million, %) by Region 2024 & 2032
- Figure 2: North America Salt Substitute Industry Revenue (Million), by Country 2024 & 2032
- Figure 3: North America Salt Substitute Industry Revenue Share (%), by Country 2024 & 2032
- Figure 4: Europe Salt Substitute Industry Revenue (Million), by Country 2024 & 2032
- Figure 5: Europe Salt Substitute Industry Revenue Share (%), by Country 2024 & 2032
- Figure 6: Asia Pacific Salt Substitute Industry Revenue (Million), by Country 2024 & 2032
- Figure 7: Asia Pacific Salt Substitute Industry Revenue Share (%), by Country 2024 & 2032
- Figure 8: South America Salt Substitute Industry Revenue (Million), by Country 2024 & 2032
- Figure 9: South America Salt Substitute Industry Revenue Share (%), by Country 2024 & 2032
- Figure 10: Middle East and Africa Salt Substitute Industry Revenue (Million), by Country 2024 & 2032
- Figure 11: Middle East and Africa Salt Substitute Industry Revenue Share (%), by Country 2024 & 2032
- Figure 12: North America Salt Substitute Industry Revenue (Million), by Type 2024 & 2032
- Figure 13: North America Salt Substitute Industry Revenue Share (%), by Type 2024 & 2032
- Figure 14: North America Salt Substitute Industry Revenue (Million), by Application 2024 & 2032
- Figure 15: North America Salt Substitute Industry Revenue Share (%), by Application 2024 & 2032
- Figure 16: North America Salt Substitute Industry Revenue (Million), by Country 2024 & 2032
- Figure 17: North America Salt Substitute Industry Revenue Share (%), by Country 2024 & 2032
- Figure 18: Europe Salt Substitute Industry Revenue (Million), by Type 2024 & 2032
- Figure 19: Europe Salt Substitute Industry Revenue Share (%), by Type 2024 & 2032
- Figure 20: Europe Salt Substitute Industry Revenue (Million), by Application 2024 & 2032
- Figure 21: Europe Salt Substitute Industry Revenue Share (%), by Application 2024 & 2032
- Figure 22: Europe Salt Substitute Industry Revenue (Million), by Country 2024 & 2032
- Figure 23: Europe Salt Substitute Industry Revenue Share (%), by Country 2024 & 2032
- Figure 24: Asia Pacific Salt Substitute Industry Revenue (Million), by Type 2024 & 2032
- Figure 25: Asia Pacific Salt Substitute Industry Revenue Share (%), by Type 2024 & 2032
- Figure 26: Asia Pacific Salt Substitute Industry Revenue (Million), by Application 2024 & 2032
- Figure 27: Asia Pacific Salt Substitute Industry Revenue Share (%), by Application 2024 & 2032
- Figure 28: Asia Pacific Salt Substitute Industry Revenue (Million), by Country 2024 & 2032
- Figure 29: Asia Pacific Salt Substitute Industry Revenue Share (%), by Country 2024 & 2032
- Figure 30: South America Salt Substitute Industry Revenue (Million), by Type 2024 & 2032
- Figure 31: South America Salt Substitute Industry Revenue Share (%), by Type 2024 & 2032
- Figure 32: South America Salt Substitute Industry Revenue (Million), by Application 2024 & 2032
- Figure 33: South America Salt Substitute Industry Revenue Share (%), by Application 2024 & 2032
- Figure 34: South America Salt Substitute Industry Revenue (Million), by Country 2024 & 2032
- Figure 35: South America Salt Substitute Industry Revenue Share (%), by Country 2024 & 2032
- Figure 36: Middle East and Africa Salt Substitute Industry Revenue (Million), by Type 2024 & 2032
- Figure 37: Middle East and Africa Salt Substitute Industry Revenue Share (%), by Type 2024 & 2032
- Figure 38: Middle East and Africa Salt Substitute Industry Revenue (Million), by Application 2024 & 2032
- Figure 39: Middle East and Africa Salt Substitute Industry Revenue Share (%), by Application 2024 & 2032
- Figure 40: Middle East and Africa Salt Substitute Industry Revenue (Million), by Country 2024 & 2032
- Figure 41: Middle East and Africa Salt Substitute Industry Revenue Share (%), by Country 2024 & 2032
List of Tables
- Table 1: Global Salt Substitute Industry Revenue Million Forecast, by Region 2019 & 2032
- Table 2: Global Salt Substitute Industry Revenue Million Forecast, by Type 2019 & 2032
- Table 3: Global Salt Substitute Industry Revenue Million Forecast, by Application 2019 & 2032
- Table 4: Global Salt Substitute Industry Revenue Million Forecast, by Region 2019 & 2032
- Table 5: Global Salt Substitute Industry Revenue Million Forecast, by Country 2019 & 2032
- Table 6: United States Salt Substitute Industry Revenue (Million) Forecast, by Application 2019 & 2032
- Table 7: Canada Salt Substitute Industry Revenue (Million) Forecast, by Application 2019 & 2032
- Table 8: Mexico Salt Substitute Industry Revenue (Million) Forecast, by Application 2019 & 2032
- Table 9: Rest of North America Salt Substitute Industry Revenue (Million) Forecast, by Application 2019 & 2032
- Table 10: Global Salt Substitute Industry Revenue Million Forecast, by Country 2019 & 2032
- Table 11: United Kingdom Salt Substitute Industry Revenue (Million) Forecast, by Application 2019 & 2032
- Table 12: Germany Salt Substitute Industry Revenue (Million) Forecast, by Application 2019 & 2032
- Table 13: France Salt Substitute Industry Revenue (Million) Forecast, by Application 2019 & 2032
- Table 14: Russia Salt Substitute Industry Revenue (Million) Forecast, by Application 2019 & 2032
- Table 15: Italy Salt Substitute Industry Revenue (Million) Forecast, by Application 2019 & 2032
- Table 16: Spain Salt Substitute Industry Revenue (Million) Forecast, by Application 2019 & 2032
- Table 17: Rest of Europe Salt Substitute Industry Revenue (Million) Forecast, by Application 2019 & 2032
- Table 18: Global Salt Substitute Industry Revenue Million Forecast, by Country 2019 & 2032
- Table 19: India Salt Substitute Industry Revenue (Million) Forecast, by Application 2019 & 2032
- Table 20: China Salt Substitute Industry Revenue (Million) Forecast, by Application 2019 & 2032
- Table 21: Japan Salt Substitute Industry Revenue (Million) Forecast, by Application 2019 & 2032
- Table 22: Australia Salt Substitute Industry Revenue (Million) Forecast, by Application 2019 & 2032
- Table 23: Rest of Asia Pacific Salt Substitute Industry Revenue (Million) Forecast, by Application 2019 & 2032
- Table 24: Global Salt Substitute Industry Revenue Million Forecast, by Country 2019 & 2032
- Table 25: Brazil Salt Substitute Industry Revenue (Million) Forecast, by Application 2019 & 2032
- Table 26: Argentina Salt Substitute Industry Revenue (Million) Forecast, by Application 2019 & 2032
- Table 27: Rest of South America Salt Substitute Industry Revenue (Million) Forecast, by Application 2019 & 2032
- Table 28: Global Salt Substitute Industry Revenue Million Forecast, by Country 2019 & 2032
- Table 29: South Africa Salt Substitute Industry Revenue (Million) Forecast, by Application 2019 & 2032
- Table 30: Saudi Arabia Salt Substitute Industry Revenue (Million) Forecast, by Application 2019 & 2032
- Table 31: Rest of Middle East and Africa Salt Substitute Industry Revenue (Million) Forecast, by Application 2019 & 2032
- Table 32: Global Salt Substitute Industry Revenue Million Forecast, by Type 2019 & 2032
- Table 33: Global Salt Substitute Industry Revenue Million Forecast, by Application 2019 & 2032
- Table 34: Global Salt Substitute Industry Revenue Million Forecast, by Country 2019 & 2032
- Table 35: United States Salt Substitute Industry Revenue (Million) Forecast, by Application 2019 & 2032
- Table 36: Canada Salt Substitute Industry Revenue (Million) Forecast, by Application 2019 & 2032
- Table 37: Mexico Salt Substitute Industry Revenue (Million) Forecast, by Application 2019 & 2032
- Table 38: Rest of North America Salt Substitute Industry Revenue (Million) Forecast, by Application 2019 & 2032
- Table 39: Global Salt Substitute Industry Revenue Million Forecast, by Type 2019 & 2032
- Table 40: Global Salt Substitute Industry Revenue Million Forecast, by Application 2019 & 2032
- Table 41: Global Salt Substitute Industry Revenue Million Forecast, by Country 2019 & 2032
- Table 42: United Kingdom Salt Substitute Industry Revenue (Million) Forecast, by Application 2019 & 2032
- Table 43: Germany Salt Substitute Industry Revenue (Million) Forecast, by Application 2019 & 2032
- Table 44: France Salt Substitute Industry Revenue (Million) Forecast, by Application 2019 & 2032
- Table 45: Russia Salt Substitute Industry Revenue (Million) Forecast, by Application 2019 & 2032
- Table 46: Italy Salt Substitute Industry Revenue (Million) Forecast, by Application 2019 & 2032
- Table 47: Spain Salt Substitute Industry Revenue (Million) Forecast, by Application 2019 & 2032
- Table 48: Rest of Europe Salt Substitute Industry Revenue (Million) Forecast, by Application 2019 & 2032
- Table 49: Global Salt Substitute Industry Revenue Million Forecast, by Type 2019 & 2032
- Table 50: Global Salt Substitute Industry Revenue Million Forecast, by Application 2019 & 2032
- Table 51: Global Salt Substitute Industry Revenue Million Forecast, by Country 2019 & 2032
- Table 52: India Salt Substitute Industry Revenue (Million) Forecast, by Application 2019 & 2032
- Table 53: China Salt Substitute Industry Revenue (Million) Forecast, by Application 2019 & 2032
- Table 54: Japan Salt Substitute Industry Revenue (Million) Forecast, by Application 2019 & 2032
- Table 55: Australia Salt Substitute Industry Revenue (Million) Forecast, by Application 2019 & 2032
- Table 56: Rest of Asia Pacific Salt Substitute Industry Revenue (Million) Forecast, by Application 2019 & 2032
- Table 57: Global Salt Substitute Industry Revenue Million Forecast, by Type 2019 & 2032
- Table 58: Global Salt Substitute Industry Revenue Million Forecast, by Application 2019 & 2032
- Table 59: Global Salt Substitute Industry Revenue Million Forecast, by Country 2019 & 2032
- Table 60: Brazil Salt Substitute Industry Revenue (Million) Forecast, by Application 2019 & 2032
- Table 61: Argentina Salt Substitute Industry Revenue (Million) Forecast, by Application 2019 & 2032
- Table 62: Rest of South America Salt Substitute Industry Revenue (Million) Forecast, by Application 2019 & 2032
- Table 63: Global Salt Substitute Industry Revenue Million Forecast, by Type 2019 & 2032
- Table 64: Global Salt Substitute Industry Revenue Million Forecast, by Application 2019 & 2032
- Table 65: Global Salt Substitute Industry Revenue Million Forecast, by Country 2019 & 2032
- Table 66: South Africa Salt Substitute Industry Revenue (Million) Forecast, by Application 2019 & 2032
- Table 67: Saudi Arabia Salt Substitute Industry Revenue (Million) Forecast, by Application 2019 & 2032
- Table 68: Rest of Middle East and Africa Salt Substitute Industry Revenue (Million) Forecast, by Application 2019 & 2032
Frequently Asked Questions
1. What is the projected Compound Annual Growth Rate (CAGR) of the Salt Substitute Industry?
The projected CAGR is approximately 6.59%.
2. Which companies are prominent players in the Salt Substitute Industry?
Key companies in the market include Associated British Foods PLC, Givaudan SA, DSM - Firmenich, Tate & Lyle PLC, Kerry Group PLC, Cargill Inc, Corbion NV, Angel Yeast Co Ltd, Ajinomoto Co Inc *List Not Exhaustive, Lallemand Inc .
3. What are the main segments of the Salt Substitute Industry?
The market segments include Type, Application.
4. Can you provide details about the market size?
The market size is estimated to be USD 1.30 Million as of 2022.
5. What are some drivers contributing to market growth?
Surge In Hypertension: A Catalyst For The Salt Substitute Market; Salt: A Key Ingredient In Convenience Food.
6. What are the notable trends driving market growth?
Rising Hypertension Rates Drive Demand for Salt Substitutes on a Global Scale.
7. Are there any restraints impacting market growth?
Challenges And Opportunities In The Salt Substitute Market Amidst Rising Common Salt Production.
8. Can you provide examples of recent developments in the market?
June 2024: DSM-Firmenich partnered with Deloitte to bolster sustainable food systems. Integrating with Deloitte's drive for innovative climate and nature-friendly solutions, this collaboration leverages DSM-Firmenich's Sustell platform. This platform is designed to gauge the environmental footprint of large-scale animal protein production accurately.
9. What pricing options are available for accessing the report?
Pricing options include single-user, multi-user, and enterprise licenses priced at USD 4750, USD 5250, and USD 8750 respectively.
10. Is the market size provided in terms of value or volume?
The market size is provided in terms of value, measured in Million.
11. Are there any specific market keywords associated with the report?
Yes, the market keyword associated with the report is "Salt Substitute Industry," which aids in identifying and referencing the specific market segment covered.
12. How do I determine which pricing option suits my needs best?
The pricing options vary based on user requirements and access needs. Individual users may opt for single-user licenses, while businesses requiring broader access may choose multi-user or enterprise licenses for cost-effective access to the report.
13. Are there any additional resources or data provided in the Salt Substitute Industry report?
While the report offers comprehensive insights, it's advisable to review the specific contents or supplementary materials provided to ascertain if additional resources or data are available.
14. How can I stay updated on further developments or reports in the Salt Substitute Industry?
To stay informed about further developments, trends, and reports in the Salt Substitute Industry, consider subscribing to industry newsletters, following relevant companies and organizations, or regularly checking reputable industry news sources and publications.
Methodology
Step 1 - Identification of Relevant Samples Size from Population Database


Step 2 - Approaches for Defining Global Market Size (Value, Volume* & Price*)

Note*: In applicable scenarios
Step 3 - Data Sources
Primary Research
- Web Analytics
- Survey Reports
- Research Institute
- Latest Research Reports
- Opinion Leaders
Secondary Research
- Annual Reports
- White Paper
- Latest Press Release
- Industry Association
- Paid Database
- Investor Presentations

Step 4 - Data Triangulation
Involves using different sources of information in order to increase the validity of a study
These sources are likely to be stakeholders in a program - participants, other researchers, program staff, other community members, and so on.
Then we put all data in single framework & apply various statistical tools to find out the dynamic on the market.
During the analysis stage, feedback from the stakeholder groups would be compared to determine areas of agreement as well as areas of divergence


