
Key Insights
The rugged display market, valued at $10.39 billion in 2025, is projected to experience robust growth, driven by increasing demand across diverse sectors. The Compound Annual Growth Rate (CAGR) of 4.43% from 2025 to 2033 signifies a consistent expansion, fueled by several key factors. The burgeoning oil and gas industry, with its reliance on durable and reliable equipment in harsh environments, is a significant contributor. Government and defense sectors, needing robust displays for military applications and critical infrastructure monitoring, further bolster market growth. Similarly, the automotive and transportation industry's adoption of ruggedized displays in vehicles and fleet management systems contributes significantly. Technological advancements, such as the integration of higher-resolution displays and improved touch sensitivity in both semi-rugged and fully-rugged devices, are driving adoption. Furthermore, the increasing demand for portable, durable computing solutions in healthcare and industrial settings is expanding the market's reach. However, high initial investment costs associated with ruggedized technology and the availability of alternative, less durable display solutions could pose some restraints to market expansion. The market segmentation by product type (smartphones, tablets, laptops, etc.), level of ruggedness (semi-rugged, fully-rugged, ultra-rugged), and operating system (Android, Windows, etc.) indicates diverse applications and technological advancements within the sector. Leading companies like L3 Technologies, Kyocera, and Getac are capitalizing on these trends through innovation and strategic partnerships. Geographical expansion, especially in regions with emerging infrastructure and industrial growth, presents further opportunities.
The forecast period (2025-2033) promises continued market expansion, with the highest growth anticipated in regions like Asia Pacific, mirroring the rapid industrialization and technological advancements within the area. North America and Europe, while maintaining significant market share, will see a comparatively more moderate growth rate, reflecting their already established technological infrastructure. However, the continuous need for enhanced durability and reliability in specialized applications across various sectors will ensure steady demand for rugged displays. The competitive landscape will remain dynamic, with ongoing product innovation, mergers, and acquisitions shaping the market’s trajectory. Companies focused on delivering high-performance displays with advanced features and robust customer support will likely gain a competitive edge. The market is expected to evolve towards increased integration with advanced technologies such as AI and IoT, further enhancing functionality and market penetration across diverse sectors.

Rugged Display Industry Market Report: 2019-2033
This comprehensive report provides a detailed analysis of the global rugged display industry, offering invaluable insights for stakeholders seeking to navigate this dynamic market. The study period spans from 2019 to 2033, with 2025 serving as the base and estimated year. The forecast period covers 2025-2033, while the historical period encompasses 2019-2024. The report analyzes market trends, competitive dynamics, and growth drivers, offering actionable intelligence to inform strategic decision-making. The market is valued at xx Million in 2025 and is projected to reach xx Million by 2033, exhibiting a CAGR of xx%.
Rugged Display Industry Market Structure & Competitive Dynamics
The rugged display market is characterized by a moderately concentrated structure, with key players like L3 Technologies Inc, Kyocera Corp, Sparton Corp, Getac Technology Corp, General Dynamics Corp, Dell Inc, Xplore Technologies Corp, Beijer Electronics AB, Zebra Technologies Corp, Esterline Technologies Corp, Curtiss-Wright Corp, and Panasonic Corporation holding significant market share. Market concentration is influenced by factors such as technological advancements, economies of scale, and intellectual property rights. Innovation ecosystems are vibrant, with ongoing R&D efforts focused on enhancing display durability, resolution, and power efficiency. Regulatory frameworks, particularly those related to safety and environmental standards, play a crucial role in shaping product design and manufacturing processes. The industry also faces competition from substitute products, such as traditional displays with protective casings. However, rugged displays maintain a competitive advantage due to their superior durability and performance in demanding environments. M&A activities have been moderate, with deal values totaling approximately xx Million in the past five years, driven primarily by efforts to expand product portfolios and geographical reach.
- Market Share: L3 Technologies Inc holds approximately xx% market share, followed by Getac Technology Corp with xx%, and others.
- M&A Deal Values (2019-2024): Approximately xx Million.
- Key Competitive Dynamics: Intense competition based on product features, pricing, and after-sales service.
Rugged Display Industry Industry Trends & Insights
The rugged display market is experiencing robust growth, driven by increasing demand from diverse end-user segments. Key growth drivers include the expanding adoption of ruggedized devices in demanding industries like oil and gas, defense, and healthcare. The market is witnessing significant technological disruptions, with advancements in display technologies like AMOLED and microLED leading to enhanced visual quality and durability. Consumer preferences are shifting towards displays with higher resolutions, improved brightness, and enhanced touch sensitivity. The competitive landscape remains intense, with companies vying for market share through innovation, strategic partnerships, and geographical expansion. Market penetration in key sectors like automotive and transportation is on the rise. The forecast period is expected to witness increased adoption of rugged displays in various sectors, further boosting market growth.

Dominant Markets & Segments in Rugged Display Industry
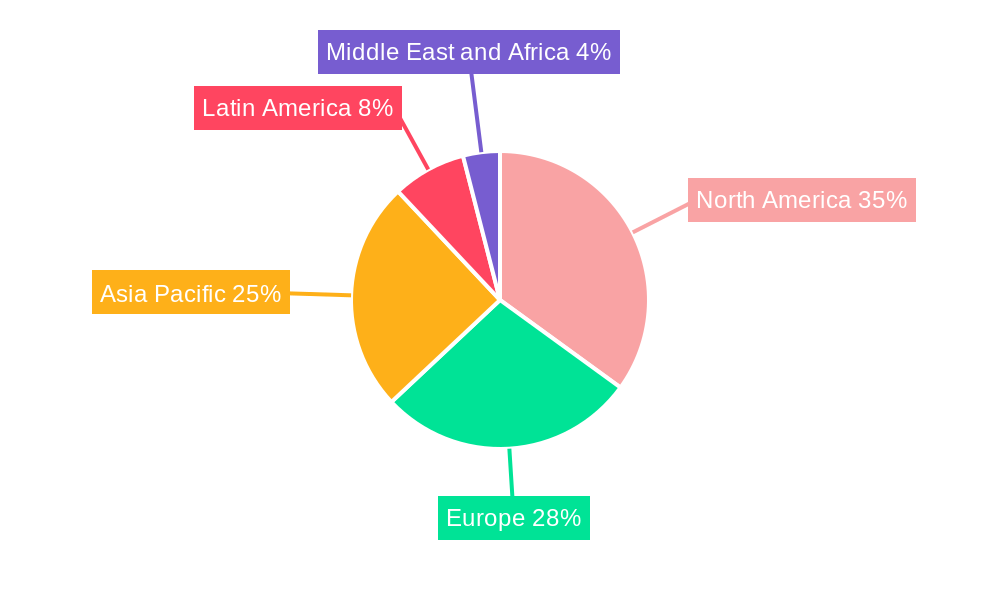
Dominant Region/Country: North America currently holds the largest market share, driven by high demand from defense and aerospace sectors. The strong presence of key players in the region further contributes to its dominance.
Dominant End-User Segment: The Government, Defense, and Aerospace segment represents the largest end-user market, due to high demand for ruggedized displays in military and security applications. This sector is expected to maintain its leading position over the forecast period.
Dominant Product Type: Panel PCs and mission-critical displays are currently leading the product type segment, driven by their suitability for applications demanding high performance and reliability. This dominance is likely to continue over the forecast period.
Dominant Level of Ruggedness: Fully-rugged displays dominate the market, due to their superior ability to withstand harsh environmental conditions. This segment is expected to retain its leadership position.
Dominant Operating System: Windows currently holds the largest market share in terms of operating system, followed by Android.
Key Drivers (by Segment):
- Government, Defense, and Aerospace: High government spending on defense, robust security requirements.
- Industrial: Automation trends, rise of Industry 4.0, increased demand for ruggedized industrial control systems.
- Automotive and Transportation: Autonomous driving technologies, enhanced in-vehicle infotainment systems.
Rugged Display Industry Product Innovations
Recent product developments focus on improving display brightness, resolution, and durability, incorporating features like enhanced touch responsiveness and sunlight readability. Miniaturization and low-power consumption are other key technological trends. These innovations are tailored to meet the specific demands of various end-user sectors, enhancing performance and reliability in challenging environments. The market is seeing the introduction of displays with integrated processing capabilities, improving efficiency and functionality.
Report Segmentation & Scope
This report segments the rugged display market by end-user (Oil and Gas, Government, Defense, and Aerospace, Industrial, Automotive and Transportation, Healthcare, Other End Users), product type (Smartphone and Handheld Computer, Tablet PC, Laptop and Notebook, Avionics Display, Vehicle-mounted Computer, Panel PC and Mission-critical Display), level of ruggedness (Semi-rugged, Fully-rugged, Ultra-rugged), and operating system (Android, Windows, Other Operating Systems). Each segment’s growth projection, market size, and competitive dynamics are analyzed comprehensively.
Key Drivers of Rugged Display Industry Growth
Technological advancements, particularly in display technologies and processing capabilities, are driving market expansion. The increasing demand for rugged devices across various industries, such as oil and gas and defense, is another key growth driver. Favorable government policies and regulations supporting the adoption of advanced technologies are also fueling the market. The growing need for enhanced safety and reliability in critical applications is further promoting market growth.
Challenges in the Rugged Display Industry Sector
The rugged display market faces challenges such as high manufacturing costs and the need for specialized components. Supply chain disruptions, including component shortages, can significantly impact production. Intense competition and the continuous emergence of new technologies require ongoing innovation and adaptation. Meeting stringent regulatory requirements adds complexity and cost to product development and launch.
Leading Players in the Rugged Display Industry Market
- L3 Technologies Inc
- Kyocera Corp
- Sparton Corp
- Getac Technology Corp
- General Dynamics Corp
- Dell Inc
- Xplore Technologies Corp
- Beijer Electronics AB
- Zebra Technologies Corp
- Esterline Technologies Corp
- Curtiss-Wright Corp
- Panasonic Corporation
Key Developments in Rugged Display Industry Sector
- 2023-Q2: Getac Technology Corp launched a new line of ultra-rugged tablets featuring enhanced processing power and display capabilities. This launch expanded their product portfolio and broadened their market reach.
- 2022-Q4: A significant merger between two smaller rugged display manufacturers consolidated market share and increased R&D investment. This led to heightened competition in the market.
- 2021-Q3: New industry standards were introduced for rugged display durability and performance. This led to the development of higher-quality displays but also increased the overall manufacturing costs.
Strategic Rugged Display Industry Market Outlook
The rugged display market is poised for sustained growth, driven by technological advancements and increasing demand across multiple industries. Strategic opportunities lie in developing innovative products that cater to the evolving needs of end-users and expanding into high-growth markets. Focus on sustainability and reducing environmental impact will be crucial for long-term success. Collaboration and strategic alliances will play a key role in shaping the future competitive landscape.
Rugged Display Industry Segmentation
-
1. Product Type
- 1.1. Smartphone and Handheld Computer
- 1.2. Tablet PC
- 1.3. Laptop and Notebook
- 1.4. Avionics Display
- 1.5. Vehicle-mounted Computer
- 1.6. Panel PC and Mission-critical Display
-
2. Level of Ruggedness
- 2.1. Semi-rugged
- 2.2. Fully-rugged
- 2.3. Ultra-rugged
-
3. Operating System
- 3.1. Android
- 3.2. Windows
- 3.3. Other Operating Systems
-
4. End User
- 4.1. Oil and Gas
- 4.2. Government, Defense, and Aerospace
- 4.3. Industrial
- 4.4. Automotive and Transportation
- 4.5. Healthcare
- 4.6. Other End Users
Rugged Display Industry Segmentation By Geography
- 1. North America
- 2. Europe
- 3. Asia Pacific
- 4. Latin America
- 5. Middle East and Africa
Rugged Display Industry REPORT HIGHLIGHTS
| Aspects | Details |
|---|---|
| Study Period | 2019-2033 |
| Base Year | 2024 |
| Estimated Year | 2025 |
| Forecast Period | 2025-2033 |
| Historical Period | 2019-2024 |
| Growth Rate | CAGR of 4.43% from 2019-2033 |
| Segmentation |
|
Table of Contents
- 1. Introduction
- 1.1. Research Scope
- 1.2. Market Segmentation
- 1.3. Research Methodology
- 1.4. Definitions and Assumptions
- 2. Executive Summary
- 2.1. Introduction
- 3. Market Dynamics
- 3.1. Introduction
- 3.2. Market Drivers
- 3.2.1. ; Reduced Total Cost of Ownership (TCO); Rising Demand for HMI and IoT in Various Industries
- 3.3. Market Restrains
- 3.3.1. ; Adoption of Consumer-grade Devices for Industrial Applications
- 3.4. Market Trends
- 3.4.1. Rugged Tablets are Expected to Hold Major Share
- 4. Market Factor Analysis
- 4.1. Porters Five Forces
- 4.2. Supply/Value Chain
- 4.3. PESTEL analysis
- 4.4. Market Entropy
- 4.5. Patent/Trademark Analysis
- 5. Global Rugged Display Industry Analysis, Insights and Forecast, 2019-2031
- 5.1. Market Analysis, Insights and Forecast - by Product Type
- 5.1.1. Smartphone and Handheld Computer
- 5.1.2. Tablet PC
- 5.1.3. Laptop and Notebook
- 5.1.4. Avionics Display
- 5.1.5. Vehicle-mounted Computer
- 5.1.6. Panel PC and Mission-critical Display
- 5.2. Market Analysis, Insights and Forecast - by Level of Ruggedness
- 5.2.1. Semi-rugged
- 5.2.2. Fully-rugged
- 5.2.3. Ultra-rugged
- 5.3. Market Analysis, Insights and Forecast - by Operating System
- 5.3.1. Android
- 5.3.2. Windows
- 5.3.3. Other Operating Systems
- 5.4. Market Analysis, Insights and Forecast - by End User
- 5.4.1. Oil and Gas
- 5.4.2. Government, Defense, and Aerospace
- 5.4.3. Industrial
- 5.4.4. Automotive and Transportation
- 5.4.5. Healthcare
- 5.4.6. Other End Users
- 5.5. Market Analysis, Insights and Forecast - by Region
- 5.5.1. North America
- 5.5.2. Europe
- 5.5.3. Asia Pacific
- 5.5.4. Latin America
- 5.5.5. Middle East and Africa
- 5.1. Market Analysis, Insights and Forecast - by Product Type
- 6. North America Rugged Display Industry Analysis, Insights and Forecast, 2019-2031
- 6.1. Market Analysis, Insights and Forecast - by Product Type
- 6.1.1. Smartphone and Handheld Computer
- 6.1.2. Tablet PC
- 6.1.3. Laptop and Notebook
- 6.1.4. Avionics Display
- 6.1.5. Vehicle-mounted Computer
- 6.1.6. Panel PC and Mission-critical Display
- 6.2. Market Analysis, Insights and Forecast - by Level of Ruggedness
- 6.2.1. Semi-rugged
- 6.2.2. Fully-rugged
- 6.2.3. Ultra-rugged
- 6.3. Market Analysis, Insights and Forecast - by Operating System
- 6.3.1. Android
- 6.3.2. Windows
- 6.3.3. Other Operating Systems
- 6.4. Market Analysis, Insights and Forecast - by End User
- 6.4.1. Oil and Gas
- 6.4.2. Government, Defense, and Aerospace
- 6.4.3. Industrial
- 6.4.4. Automotive and Transportation
- 6.4.5. Healthcare
- 6.4.6. Other End Users
- 6.1. Market Analysis, Insights and Forecast - by Product Type
- 7. Europe Rugged Display Industry Analysis, Insights and Forecast, 2019-2031
- 7.1. Market Analysis, Insights and Forecast - by Product Type
- 7.1.1. Smartphone and Handheld Computer
- 7.1.2. Tablet PC
- 7.1.3. Laptop and Notebook
- 7.1.4. Avionics Display
- 7.1.5. Vehicle-mounted Computer
- 7.1.6. Panel PC and Mission-critical Display
- 7.2. Market Analysis, Insights and Forecast - by Level of Ruggedness
- 7.2.1. Semi-rugged
- 7.2.2. Fully-rugged
- 7.2.3. Ultra-rugged
- 7.3. Market Analysis, Insights and Forecast - by Operating System
- 7.3.1. Android
- 7.3.2. Windows
- 7.3.3. Other Operating Systems
- 7.4. Market Analysis, Insights and Forecast - by End User
- 7.4.1. Oil and Gas
- 7.4.2. Government, Defense, and Aerospace
- 7.4.3. Industrial
- 7.4.4. Automotive and Transportation
- 7.4.5. Healthcare
- 7.4.6. Other End Users
- 7.1. Market Analysis, Insights and Forecast - by Product Type
- 8. Asia Pacific Rugged Display Industry Analysis, Insights and Forecast, 2019-2031
- 8.1. Market Analysis, Insights and Forecast - by Product Type
- 8.1.1. Smartphone and Handheld Computer
- 8.1.2. Tablet PC
- 8.1.3. Laptop and Notebook
- 8.1.4. Avionics Display
- 8.1.5. Vehicle-mounted Computer
- 8.1.6. Panel PC and Mission-critical Display
- 8.2. Market Analysis, Insights and Forecast - by Level of Ruggedness
- 8.2.1. Semi-rugged
- 8.2.2. Fully-rugged
- 8.2.3. Ultra-rugged
- 8.3. Market Analysis, Insights and Forecast - by Operating System
- 8.3.1. Android
- 8.3.2. Windows
- 8.3.3. Other Operating Systems
- 8.4. Market Analysis, Insights and Forecast - by End User
- 8.4.1. Oil and Gas
- 8.4.2. Government, Defense, and Aerospace
- 8.4.3. Industrial
- 8.4.4. Automotive and Transportation
- 8.4.5. Healthcare
- 8.4.6. Other End Users
- 8.1. Market Analysis, Insights and Forecast - by Product Type
- 9. Latin America Rugged Display Industry Analysis, Insights and Forecast, 2019-2031
- 9.1. Market Analysis, Insights and Forecast - by Product Type
- 9.1.1. Smartphone and Handheld Computer
- 9.1.2. Tablet PC
- 9.1.3. Laptop and Notebook
- 9.1.4. Avionics Display
- 9.1.5. Vehicle-mounted Computer
- 9.1.6. Panel PC and Mission-critical Display
- 9.2. Market Analysis, Insights and Forecast - by Level of Ruggedness
- 9.2.1. Semi-rugged
- 9.2.2. Fully-rugged
- 9.2.3. Ultra-rugged
- 9.3. Market Analysis, Insights and Forecast - by Operating System
- 9.3.1. Android
- 9.3.2. Windows
- 9.3.3. Other Operating Systems
- 9.4. Market Analysis, Insights and Forecast - by End User
- 9.4.1. Oil and Gas
- 9.4.2. Government, Defense, and Aerospace
- 9.4.3. Industrial
- 9.4.4. Automotive and Transportation
- 9.4.5. Healthcare
- 9.4.6. Other End Users
- 9.1. Market Analysis, Insights and Forecast - by Product Type
- 10. Middle East and Africa Rugged Display Industry Analysis, Insights and Forecast, 2019-2031
- 10.1. Market Analysis, Insights and Forecast - by Product Type
- 10.1.1. Smartphone and Handheld Computer
- 10.1.2. Tablet PC
- 10.1.3. Laptop and Notebook
- 10.1.4. Avionics Display
- 10.1.5. Vehicle-mounted Computer
- 10.1.6. Panel PC and Mission-critical Display
- 10.2. Market Analysis, Insights and Forecast - by Level of Ruggedness
- 10.2.1. Semi-rugged
- 10.2.2. Fully-rugged
- 10.2.3. Ultra-rugged
- 10.3. Market Analysis, Insights and Forecast - by Operating System
- 10.3.1. Android
- 10.3.2. Windows
- 10.3.3. Other Operating Systems
- 10.4. Market Analysis, Insights and Forecast - by End User
- 10.4.1. Oil and Gas
- 10.4.2. Government, Defense, and Aerospace
- 10.4.3. Industrial
- 10.4.4. Automotive and Transportation
- 10.4.5. Healthcare
- 10.4.6. Other End Users
- 10.1. Market Analysis, Insights and Forecast - by Product Type
- 11. North America Rugged Display Industry Analysis, Insights and Forecast, 2019-2031
- 11.1. Market Analysis, Insights and Forecast - By Country/Sub-region
- 11.1.1.
- 12. Europe Rugged Display Industry Analysis, Insights and Forecast, 2019-2031
- 12.1. Market Analysis, Insights and Forecast - By Country/Sub-region
- 12.1.1.
- 13. Asia Pacific Rugged Display Industry Analysis, Insights and Forecast, 2019-2031
- 13.1. Market Analysis, Insights and Forecast - By Country/Sub-region
- 13.1.1.
- 14. Latin America Rugged Display Industry Analysis, Insights and Forecast, 2019-2031
- 14.1. Market Analysis, Insights and Forecast - By Country/Sub-region
- 14.1.1.
- 15. Middle East and Africa Rugged Display Industry Analysis, Insights and Forecast, 2019-2031
- 15.1. Market Analysis, Insights and Forecast - By Country/Sub-region
- 15.1.1.
- 16. Competitive Analysis
- 16.1. Global Market Share Analysis 2024
- 16.2. Company Profiles
- 16.2.1 L3 Technologies Inc
- 16.2.1.1. Overview
- 16.2.1.2. Products
- 16.2.1.3. SWOT Analysis
- 16.2.1.4. Recent Developments
- 16.2.1.5. Financials (Based on Availability)
- 16.2.2 Kyocera Corp
- 16.2.2.1. Overview
- 16.2.2.2. Products
- 16.2.2.3. SWOT Analysis
- 16.2.2.4. Recent Developments
- 16.2.2.5. Financials (Based on Availability)
- 16.2.3 Sparton Corp
- 16.2.3.1. Overview
- 16.2.3.2. Products
- 16.2.3.3. SWOT Analysis
- 16.2.3.4. Recent Developments
- 16.2.3.5. Financials (Based on Availability)
- 16.2.4 Getac Technology Corp
- 16.2.4.1. Overview
- 16.2.4.2. Products
- 16.2.4.3. SWOT Analysis
- 16.2.4.4. Recent Developments
- 16.2.4.5. Financials (Based on Availability)
- 16.2.5 General Dynamics Corp
- 16.2.5.1. Overview
- 16.2.5.2. Products
- 16.2.5.3. SWOT Analysis
- 16.2.5.4. Recent Developments
- 16.2.5.5. Financials (Based on Availability)
- 16.2.6 Dell Inc
- 16.2.6.1. Overview
- 16.2.6.2. Products
- 16.2.6.3. SWOT Analysis
- 16.2.6.4. Recent Developments
- 16.2.6.5. Financials (Based on Availability)
- 16.2.7 Xplore Technologies Corp
- 16.2.7.1. Overview
- 16.2.7.2. Products
- 16.2.7.3. SWOT Analysis
- 16.2.7.4. Recent Developments
- 16.2.7.5. Financials (Based on Availability)
- 16.2.8 Beijer Electronics AB
- 16.2.8.1. Overview
- 16.2.8.2. Products
- 16.2.8.3. SWOT Analysis
- 16.2.8.4. Recent Developments
- 16.2.8.5. Financials (Based on Availability)
- 16.2.9 Zebra Technologies Corp
- 16.2.9.1. Overview
- 16.2.9.2. Products
- 16.2.9.3. SWOT Analysis
- 16.2.9.4. Recent Developments
- 16.2.9.5. Financials (Based on Availability)
- 16.2.10 Esterline Technologies Corp
- 16.2.10.1. Overview
- 16.2.10.2. Products
- 16.2.10.3. SWOT Analysis
- 16.2.10.4. Recent Developments
- 16.2.10.5. Financials (Based on Availability)
- 16.2.11 Curtiss-Wright Corp
- 16.2.11.1. Overview
- 16.2.11.2. Products
- 16.2.11.3. SWOT Analysis
- 16.2.11.4. Recent Developments
- 16.2.11.5. Financials (Based on Availability)
- 16.2.12 Panasonic Corporation
- 16.2.12.1. Overview
- 16.2.12.2. Products
- 16.2.12.3. SWOT Analysis
- 16.2.12.4. Recent Developments
- 16.2.12.5. Financials (Based on Availability)
- 16.2.1 L3 Technologies Inc
List of Figures
- Figure 1: Global Rugged Display Industry Revenue Breakdown (Million, %) by Region 2024 & 2032
- Figure 2: North America Rugged Display Industry Revenue (Million), by Country 2024 & 2032
- Figure 3: North America Rugged Display Industry Revenue Share (%), by Country 2024 & 2032
- Figure 4: Europe Rugged Display Industry Revenue (Million), by Country 2024 & 2032
- Figure 5: Europe Rugged Display Industry Revenue Share (%), by Country 2024 & 2032
- Figure 6: Asia Pacific Rugged Display Industry Revenue (Million), by Country 2024 & 2032
- Figure 7: Asia Pacific Rugged Display Industry Revenue Share (%), by Country 2024 & 2032
- Figure 8: Latin America Rugged Display Industry Revenue (Million), by Country 2024 & 2032
- Figure 9: Latin America Rugged Display Industry Revenue Share (%), by Country 2024 & 2032
- Figure 10: Middle East and Africa Rugged Display Industry Revenue (Million), by Country 2024 & 2032
- Figure 11: Middle East and Africa Rugged Display Industry Revenue Share (%), by Country 2024 & 2032
- Figure 12: North America Rugged Display Industry Revenue (Million), by Product Type 2024 & 2032
- Figure 13: North America Rugged Display Industry Revenue Share (%), by Product Type 2024 & 2032
- Figure 14: North America Rugged Display Industry Revenue (Million), by Level of Ruggedness 2024 & 2032
- Figure 15: North America Rugged Display Industry Revenue Share (%), by Level of Ruggedness 2024 & 2032
- Figure 16: North America Rugged Display Industry Revenue (Million), by Operating System 2024 & 2032
- Figure 17: North America Rugged Display Industry Revenue Share (%), by Operating System 2024 & 2032
- Figure 18: North America Rugged Display Industry Revenue (Million), by End User 2024 & 2032
- Figure 19: North America Rugged Display Industry Revenue Share (%), by End User 2024 & 2032
- Figure 20: North America Rugged Display Industry Revenue (Million), by Country 2024 & 2032
- Figure 21: North America Rugged Display Industry Revenue Share (%), by Country 2024 & 2032
- Figure 22: Europe Rugged Display Industry Revenue (Million), by Product Type 2024 & 2032
- Figure 23: Europe Rugged Display Industry Revenue Share (%), by Product Type 2024 & 2032
- Figure 24: Europe Rugged Display Industry Revenue (Million), by Level of Ruggedness 2024 & 2032
- Figure 25: Europe Rugged Display Industry Revenue Share (%), by Level of Ruggedness 2024 & 2032
- Figure 26: Europe Rugged Display Industry Revenue (Million), by Operating System 2024 & 2032
- Figure 27: Europe Rugged Display Industry Revenue Share (%), by Operating System 2024 & 2032
- Figure 28: Europe Rugged Display Industry Revenue (Million), by End User 2024 & 2032
- Figure 29: Europe Rugged Display Industry Revenue Share (%), by End User 2024 & 2032
- Figure 30: Europe Rugged Display Industry Revenue (Million), by Country 2024 & 2032
- Figure 31: Europe Rugged Display Industry Revenue Share (%), by Country 2024 & 2032
- Figure 32: Asia Pacific Rugged Display Industry Revenue (Million), by Product Type 2024 & 2032
- Figure 33: Asia Pacific Rugged Display Industry Revenue Share (%), by Product Type 2024 & 2032
- Figure 34: Asia Pacific Rugged Display Industry Revenue (Million), by Level of Ruggedness 2024 & 2032
- Figure 35: Asia Pacific Rugged Display Industry Revenue Share (%), by Level of Ruggedness 2024 & 2032
- Figure 36: Asia Pacific Rugged Display Industry Revenue (Million), by Operating System 2024 & 2032
- Figure 37: Asia Pacific Rugged Display Industry Revenue Share (%), by Operating System 2024 & 2032
- Figure 38: Asia Pacific Rugged Display Industry Revenue (Million), by End User 2024 & 2032
- Figure 39: Asia Pacific Rugged Display Industry Revenue Share (%), by End User 2024 & 2032
- Figure 40: Asia Pacific Rugged Display Industry Revenue (Million), by Country 2024 & 2032
- Figure 41: Asia Pacific Rugged Display Industry Revenue Share (%), by Country 2024 & 2032
- Figure 42: Latin America Rugged Display Industry Revenue (Million), by Product Type 2024 & 2032
- Figure 43: Latin America Rugged Display Industry Revenue Share (%), by Product Type 2024 & 2032
- Figure 44: Latin America Rugged Display Industry Revenue (Million), by Level of Ruggedness 2024 & 2032
- Figure 45: Latin America Rugged Display Industry Revenue Share (%), by Level of Ruggedness 2024 & 2032
- Figure 46: Latin America Rugged Display Industry Revenue (Million), by Operating System 2024 & 2032
- Figure 47: Latin America Rugged Display Industry Revenue Share (%), by Operating System 2024 & 2032
- Figure 48: Latin America Rugged Display Industry Revenue (Million), by End User 2024 & 2032
- Figure 49: Latin America Rugged Display Industry Revenue Share (%), by End User 2024 & 2032
- Figure 50: Latin America Rugged Display Industry Revenue (Million), by Country 2024 & 2032
- Figure 51: Latin America Rugged Display Industry Revenue Share (%), by Country 2024 & 2032
- Figure 52: Middle East and Africa Rugged Display Industry Revenue (Million), by Product Type 2024 & 2032
- Figure 53: Middle East and Africa Rugged Display Industry Revenue Share (%), by Product Type 2024 & 2032
- Figure 54: Middle East and Africa Rugged Display Industry Revenue (Million), by Level of Ruggedness 2024 & 2032
- Figure 55: Middle East and Africa Rugged Display Industry Revenue Share (%), by Level of Ruggedness 2024 & 2032
- Figure 56: Middle East and Africa Rugged Display Industry Revenue (Million), by Operating System 2024 & 2032
- Figure 57: Middle East and Africa Rugged Display Industry Revenue Share (%), by Operating System 2024 & 2032
- Figure 58: Middle East and Africa Rugged Display Industry Revenue (Million), by End User 2024 & 2032
- Figure 59: Middle East and Africa Rugged Display Industry Revenue Share (%), by End User 2024 & 2032
- Figure 60: Middle East and Africa Rugged Display Industry Revenue (Million), by Country 2024 & 2032
- Figure 61: Middle East and Africa Rugged Display Industry Revenue Share (%), by Country 2024 & 2032
List of Tables
- Table 1: Global Rugged Display Industry Revenue Million Forecast, by Region 2019 & 2032
- Table 2: Global Rugged Display Industry Revenue Million Forecast, by Product Type 2019 & 2032
- Table 3: Global Rugged Display Industry Revenue Million Forecast, by Level of Ruggedness 2019 & 2032
- Table 4: Global Rugged Display Industry Revenue Million Forecast, by Operating System 2019 & 2032
- Table 5: Global Rugged Display Industry Revenue Million Forecast, by End User 2019 & 2032
- Table 6: Global Rugged Display Industry Revenue Million Forecast, by Region 2019 & 2032
- Table 7: Global Rugged Display Industry Revenue Million Forecast, by Country 2019 & 2032
- Table 8: Rugged Display Industry Revenue (Million) Forecast, by Application 2019 & 2032
- Table 9: Global Rugged Display Industry Revenue Million Forecast, by Country 2019 & 2032
- Table 10: Rugged Display Industry Revenue (Million) Forecast, by Application 2019 & 2032
- Table 11: Global Rugged Display Industry Revenue Million Forecast, by Country 2019 & 2032
- Table 12: Rugged Display Industry Revenue (Million) Forecast, by Application 2019 & 2032
- Table 13: Global Rugged Display Industry Revenue Million Forecast, by Country 2019 & 2032
- Table 14: Rugged Display Industry Revenue (Million) Forecast, by Application 2019 & 2032
- Table 15: Global Rugged Display Industry Revenue Million Forecast, by Country 2019 & 2032
- Table 16: Rugged Display Industry Revenue (Million) Forecast, by Application 2019 & 2032
- Table 17: Global Rugged Display Industry Revenue Million Forecast, by Product Type 2019 & 2032
- Table 18: Global Rugged Display Industry Revenue Million Forecast, by Level of Ruggedness 2019 & 2032
- Table 19: Global Rugged Display Industry Revenue Million Forecast, by Operating System 2019 & 2032
- Table 20: Global Rugged Display Industry Revenue Million Forecast, by End User 2019 & 2032
- Table 21: Global Rugged Display Industry Revenue Million Forecast, by Country 2019 & 2032
- Table 22: Global Rugged Display Industry Revenue Million Forecast, by Product Type 2019 & 2032
- Table 23: Global Rugged Display Industry Revenue Million Forecast, by Level of Ruggedness 2019 & 2032
- Table 24: Global Rugged Display Industry Revenue Million Forecast, by Operating System 2019 & 2032
- Table 25: Global Rugged Display Industry Revenue Million Forecast, by End User 2019 & 2032
- Table 26: Global Rugged Display Industry Revenue Million Forecast, by Country 2019 & 2032
- Table 27: Global Rugged Display Industry Revenue Million Forecast, by Product Type 2019 & 2032
- Table 28: Global Rugged Display Industry Revenue Million Forecast, by Level of Ruggedness 2019 & 2032
- Table 29: Global Rugged Display Industry Revenue Million Forecast, by Operating System 2019 & 2032
- Table 30: Global Rugged Display Industry Revenue Million Forecast, by End User 2019 & 2032
- Table 31: Global Rugged Display Industry Revenue Million Forecast, by Country 2019 & 2032
- Table 32: Global Rugged Display Industry Revenue Million Forecast, by Product Type 2019 & 2032
- Table 33: Global Rugged Display Industry Revenue Million Forecast, by Level of Ruggedness 2019 & 2032
- Table 34: Global Rugged Display Industry Revenue Million Forecast, by Operating System 2019 & 2032
- Table 35: Global Rugged Display Industry Revenue Million Forecast, by End User 2019 & 2032
- Table 36: Global Rugged Display Industry Revenue Million Forecast, by Country 2019 & 2032
- Table 37: Global Rugged Display Industry Revenue Million Forecast, by Product Type 2019 & 2032
- Table 38: Global Rugged Display Industry Revenue Million Forecast, by Level of Ruggedness 2019 & 2032
- Table 39: Global Rugged Display Industry Revenue Million Forecast, by Operating System 2019 & 2032
- Table 40: Global Rugged Display Industry Revenue Million Forecast, by End User 2019 & 2032
- Table 41: Global Rugged Display Industry Revenue Million Forecast, by Country 2019 & 2032
Frequently Asked Questions
1. What is the projected Compound Annual Growth Rate (CAGR) of the Rugged Display Industry?
The projected CAGR is approximately 4.43%.
2. Which companies are prominent players in the Rugged Display Industry?
Key companies in the market include L3 Technologies Inc, Kyocera Corp, Sparton Corp, Getac Technology Corp, General Dynamics Corp, Dell Inc, Xplore Technologies Corp, Beijer Electronics AB, Zebra Technologies Corp, Esterline Technologies Corp, Curtiss-Wright Corp, Panasonic Corporation.
3. What are the main segments of the Rugged Display Industry?
The market segments include Product Type, Level of Ruggedness, Operating System, End User.
4. Can you provide details about the market size?
The market size is estimated to be USD 10.39 Million as of 2022.
5. What are some drivers contributing to market growth?
; Reduced Total Cost of Ownership (TCO); Rising Demand for HMI and IoT in Various Industries.
6. What are the notable trends driving market growth?
Rugged Tablets are Expected to Hold Major Share.
7. Are there any restraints impacting market growth?
; Adoption of Consumer-grade Devices for Industrial Applications.
8. Can you provide examples of recent developments in the market?
N/A
9. What pricing options are available for accessing the report?
Pricing options include single-user, multi-user, and enterprise licenses priced at USD 4750, USD 5250, and USD 8750 respectively.
10. Is the market size provided in terms of value or volume?
The market size is provided in terms of value, measured in Million.
11. Are there any specific market keywords associated with the report?
Yes, the market keyword associated with the report is "Rugged Display Industry," which aids in identifying and referencing the specific market segment covered.
12. How do I determine which pricing option suits my needs best?
The pricing options vary based on user requirements and access needs. Individual users may opt for single-user licenses, while businesses requiring broader access may choose multi-user or enterprise licenses for cost-effective access to the report.
13. Are there any additional resources or data provided in the Rugged Display Industry report?
While the report offers comprehensive insights, it's advisable to review the specific contents or supplementary materials provided to ascertain if additional resources or data are available.
14. How can I stay updated on further developments or reports in the Rugged Display Industry?
To stay informed about further developments, trends, and reports in the Rugged Display Industry, consider subscribing to industry newsletters, following relevant companies and organizations, or regularly checking reputable industry news sources and publications.
Methodology
Step 1 - Identification of Relevant Samples Size from Population Database


Step 2 - Approaches for Defining Global Market Size (Value, Volume* & Price*)

Note*: In applicable scenarios
Step 3 - Data Sources
Primary Research
- Web Analytics
- Survey Reports
- Research Institute
- Latest Research Reports
- Opinion Leaders
Secondary Research
- Annual Reports
- White Paper
- Latest Press Release
- Industry Association
- Paid Database
- Investor Presentations

Step 4 - Data Triangulation
Involves using different sources of information in order to increase the validity of a study
These sources are likely to be stakeholders in a program - participants, other researchers, program staff, other community members, and so on.
Then we put all data in single framework & apply various statistical tools to find out the dynamic on the market.
During the analysis stage, feedback from the stakeholder groups would be compared to determine areas of agreement as well as areas of divergence


