
Key Insights
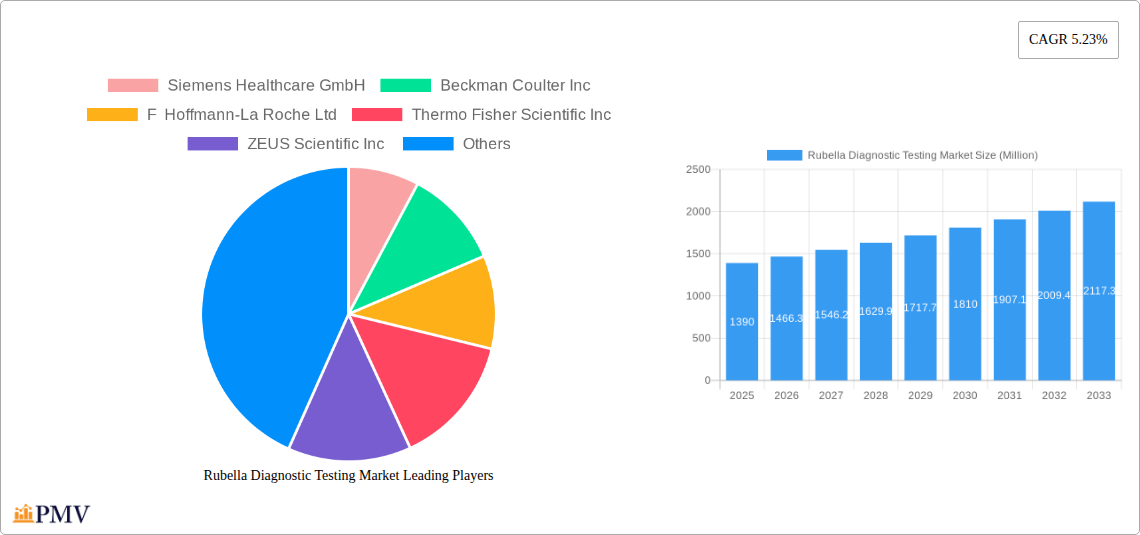
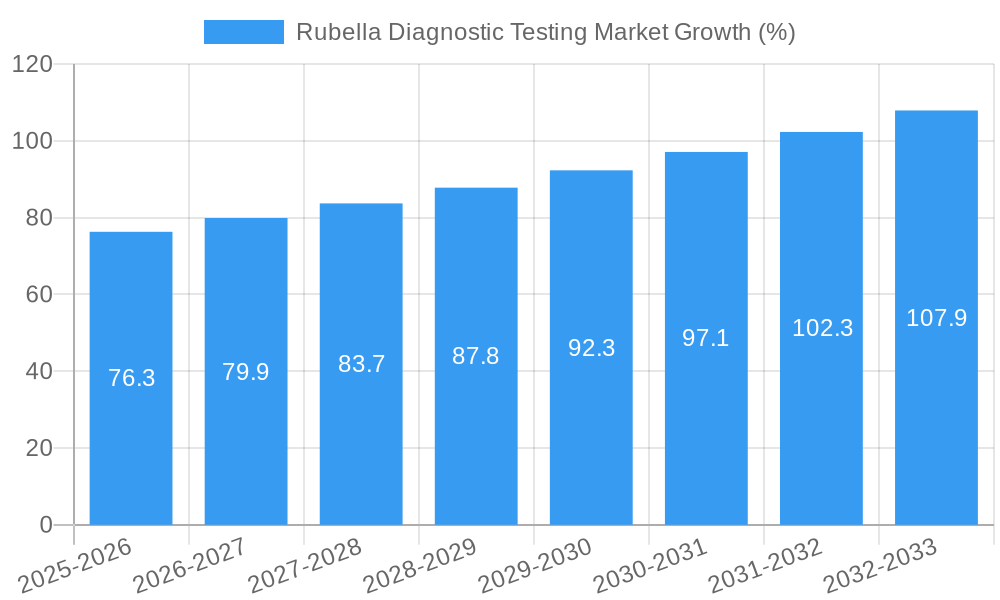
The global Rubella Diagnostic Testing market, valued at $1.39 billion in 2025, is projected to experience robust growth, driven by rising rubella infection rates globally, increasing awareness of congenital rubella syndrome (CRS), and expanding vaccination programs. The market's Compound Annual Growth Rate (CAGR) of 5.23% from 2019-2024 suggests continued expansion through 2033. Key growth drivers include the increasing prevalence of rubella in developing nations with limited healthcare infrastructure and the rising demand for accurate and rapid diagnostic tools. Technological advancements in testing techniques, such as the shift towards more sensitive and automated Enzyme Immunoassays (EIA) and Fluorescent Immunoassays (FIA), are also contributing to market growth. While the market benefits from increased government initiatives promoting vaccination and disease surveillance, challenges such as high testing costs, the availability of less expensive alternative diagnostic methods, and the potential for false-positive/negative results continue to restrain market expansion. The market is segmented by testing technique (Latex Agglutination, EIA, RIA, FIA, and others) and application (hospitals, laboratories, and other applications), with EIA and FIA expected to dominate due to their superior sensitivity and specificity. Geographically, North America and Europe currently hold significant market shares, but the Asia-Pacific region is projected to witness the highest growth rate due to rising populations, increased healthcare spending, and a greater prevalence of rubella infections. Major players like Siemens Healthcare, Beckman Coulter, Roche, Thermo Fisher Scientific, and Abbott Laboratories are actively involved in research and development to improve diagnostic accuracy and accessibility.
The market's projected expansion reflects a growing need for effective rubella diagnosis and management. While challenges persist, ongoing innovations in testing technologies and increasing public health awareness are anticipated to fuel market growth. The market's segmentation provides opportunities for specialized players to focus on niche applications and regions, fostering competition and innovation. The strategic partnerships and collaborations between diagnostic companies and healthcare providers are expected to further enhance the accessibility and affordability of rubella diagnostic testing. This will ultimately contribute towards improved global rubella control and a reduction in the incidence of congenital rubella syndrome.
Rubella Diagnostic Testing Market: A Comprehensive Report (2019-2033)
This in-depth report provides a comprehensive analysis of the global Rubella Diagnostic Testing market, offering invaluable insights for stakeholders across the healthcare industry. Covering the period from 2019 to 2033, with a focus on 2025 as the base and estimated year, this report meticulously examines market dynamics, competitive landscapes, and future growth prospects. The report leverages extensive market research and data analysis to provide actionable intelligence for informed decision-making.
Rubella Diagnostic Testing Market Market Structure & Competitive Dynamics
The global rubella diagnostic testing market exhibits a moderately consolidated structure, with key players like Siemens Healthcare GmbH, Beckman Coulter Inc, F Hoffmann-La Roche Ltd, Thermo Fisher Scientific Inc, ZEUS Scientific Inc, Ortho Clinical Diagnostics, BioMérieux SA, Biokit SA, Abbott Laboratories Inc, and Bio Rad Laboratories Inc vying for market share. Market concentration is influenced by factors such as technological advancements, regulatory approvals, and strategic mergers and acquisitions (M&A) activities. The market's innovation ecosystem is driven by continuous improvements in testing techniques, such as Enzyme Immunoassay (EIA) and Fluorescent Immunoassay (FIA), leading to improved accuracy and efficiency. Strict regulatory frameworks, particularly concerning diagnostic accuracy and safety, significantly impact market entry and product approvals. The market also faces competition from substitute testing methods and evolving end-user preferences.
Recent M&A activities have shaped the competitive landscape, although precise deal values are not publicly available for all transactions. The market share distribution among leading players is dynamic, influenced by the success of new product launches and strategic partnerships. The report provides a detailed analysis of market share dynamics, including a breakdown of market share by company and region. Furthermore, the analysis highlights the role of technological advancements and regulatory changes in shaping the competitive landscape.
Rubella Diagnostic Testing Market Industry Trends & Insights
The global rubella diagnostic testing market is projected to experience a Compound Annual Growth Rate (CAGR) of xx% during the forecast period (2025-2033). This growth is fueled by several factors, including rising prevalence of rubella infections globally, increasing awareness about the importance of early diagnosis and prevention, and ongoing technological advancements in diagnostic techniques. The market penetration of advanced testing methods like EIA and FIA is also on the rise, driven by their superior accuracy and efficiency compared to older techniques. However, market growth faces challenges from factors such as the high cost of advanced testing technologies and the availability of alternative diagnostic approaches. The report delves into the influence of consumer preferences, particularly the demand for rapid and point-of-care testing solutions. Moreover, the analysis explores the impact of changing healthcare policies and reimbursement models on market dynamics.
Dominant Markets & Segments in Rubella Diagnostic Testing Market
The report identifies [Leading Region - e.g., North America] as the dominant market for rubella diagnostic testing, driven by factors such as well-established healthcare infrastructure, high healthcare expenditure, and increased awareness of infectious diseases. Within this region, [Leading Country - e.g., USA] holds a significant share. However, emerging markets in Asia-Pacific are showing significant growth potential due to increasing healthcare investments and rising prevalence of rubella.
Key Drivers:
- Developed Healthcare Infrastructure: Facilitates widespread access to advanced diagnostic techniques.
- High Healthcare Expenditure: Supports adoption of premium testing solutions.
- Stringent Regulatory Frameworks: Ensuring high diagnostic quality and accuracy.
- Government Initiatives: Funding programs for disease surveillance and control.
Segment Dominance Analysis:
The Enzyme Immunoassay (EIA) segment currently holds the largest share of the testing technique market due to its high sensitivity, specificity, and cost-effectiveness. However, the Fluorescent Immunoassay (FIA) segment is expected to witness significant growth during the forecast period due to its enhanced speed and automation capabilities. Within application segments, hospitals dominate the market due to their large patient volume and sophisticated testing capabilities.
Rubella Diagnostic Testing Market Product Innovations
The rubella diagnostic testing market is witnessing continuous product innovations, particularly focusing on improving the speed, accuracy, and ease of use of diagnostic assays. Recent advancements include the development of rapid diagnostic tests (RDTs) that provide results within minutes, allowing for prompt treatment and disease management. These innovations are driving market growth by increasing accessibility and efficiency of rubella testing. The market is also seeing a push towards point-of-care testing solutions to improve access in resource-limited settings. The competitive advantage lies in offering faster, more accurate, and cost-effective solutions. Technological trends highlight a shift towards automation and integration with laboratory information systems (LIS).
Report Segmentation & Scope
The report segments the market based on testing technique and application.
Testing Technique: Latex Agglutination, Enzyme Immunoassay (EIA), Radioimmunoassay (RIA), Fluorescent Immunoassay (FIA), Other Testing Techniques. Each segment's growth projection is determined through analysis of technology adoption rates and market penetration. The competitive dynamics within each segment are analyzed considering the market share held by key players and the intensity of competition.
Application: Hospitals, Laboratories, Other Applications. The report evaluates the market size and growth potential within each application segment, highlighting the influence of factors such as patient volume, healthcare infrastructure, and testing needs. The competitive landscape is explored within each application segment, recognizing variations in market share and competitive dynamics.
Key Drivers of Rubella Diagnostic Testing Market Growth
The rubella diagnostic testing market is primarily driven by factors such as the increasing prevalence of rubella infections, particularly in developing countries; the growing need for early and accurate diagnosis to prevent complications such as congenital rubella syndrome; and the rising demand for rapid and point-of-care testing solutions. Government initiatives aimed at improving disease surveillance and control also contribute to market growth. Technological advancements resulting in enhanced testing accuracy and efficiency are key growth catalysts.
Challenges in the Rubella Diagnostic Testing Market Sector
Challenges within the rubella diagnostic testing market include the high cost of advanced diagnostic technologies, especially in resource-limited settings. Regulatory hurdles and stringent approval processes for new testing methods also pose challenges for market entry and expansion. Competition among established players and the emergence of new players can put downward pressure on pricing. Furthermore, ensuring consistent supply chain reliability is crucial in maintaining adequate access to testing materials and reagents.
Leading Players in the Rubella Diagnostic Testing Market Market
- Siemens Healthcare GmbH
- Beckman Coulter Inc
- F Hoffmann-La Roche Ltd
- Thermo Fisher Scientific Inc
- ZEUS Scientific Inc
- Ortho Clinical Diagnostics
- BioMérieux SA
- Biokit SA
- Abbott Laboratories Inc
- Bio Rad Laboratories Inc
Key Developments in Rubella Diagnostic Testing Market Sector
November 2021: The United Kingdom Health Security Agency launched a new rash-fever surveillance scheme, increasing rubella testing samples and distributing rapid rubella diagnostic kits. This initiative significantly boosted the demand for rubella diagnostic tests in the UK.
August 2022: Roche's Ventana MMR RxDx Panel received USFDA label expansion, providing clinicians with access to a fully automated MMR biomarker panel. While not directly related to rubella, this highlights the industry trend towards automation and comprehensive diagnostic panels, influencing the development of similar technologies within rubella diagnostics.
Strategic Rubella Diagnostic Testing Market Market Outlook
The future of the rubella diagnostic testing market looks promising, driven by continued technological advancements, particularly in areas like point-of-care diagnostics and improved assay sensitivity and specificity. Emerging economies will present significant growth opportunities, although addressing challenges related to healthcare infrastructure and affordability remains crucial. Strategic opportunities exist for companies investing in research and development of innovative testing methods, particularly those tailored to resource-limited settings. Partnerships and collaborations with public health organizations will play a vital role in expanding access to testing and improving disease surveillance.
Rubella Diagnostic Testing Market Segmentation
-
1. Testing Technique
- 1.1. Latex Agglutination
- 1.2. Enzyme Immunoassay (EIA)
- 1.3. Radioimmunoassay (RIA)
- 1.4. Fluorescent Immunoassay (FIA)
- 1.5. Other Testing Techniques
-
2. Application
- 2.1. Hospitals
- 2.2. Laboratories
- 2.3. Other Applications
Rubella Diagnostic Testing Market Segmentation By Geography
-
1. North America
- 1.1. United States
- 1.2. Canada
- 1.3. Mexico
-
2. Europe
- 2.1. Germany
- 2.2. United Kingdom
- 2.3. France
- 2.4. Italy
- 2.5. Spain
- 2.6. Rest of Europe
-
3. Asia Pacific
- 3.1. China
- 3.2. Japan
- 3.3. India
- 3.4. Australia
- 3.5. South Korea
- 3.6. Rest of Asia Pacific
- 4. Middle East
-
5. GCC
- 5.1. South Africa
- 5.2. Rest of Middle East
-
6. South America
- 6.1. Brazil
- 6.2. Argentina
- 6.3. Rest of South America

Rubella Diagnostic Testing Market REPORT HIGHLIGHTS
| Aspects | Details |
|---|---|
| Study Period | 2019-2033 |
| Base Year | 2024 |
| Estimated Year | 2025 |
| Forecast Period | 2025-2033 |
| Historical Period | 2019-2024 |
| Growth Rate | CAGR of 5.23% from 2019-2033 |
| Segmentation |
|
Table of Contents
- 1. Introduction
- 1.1. Research Scope
- 1.2. Market Segmentation
- 1.3. Research Methodology
- 1.4. Definitions and Assumptions
- 2. Executive Summary
- 2.1. Introduction
- 3. Market Dynamics
- 3.1. Introduction
- 3.2. Market Drivers
- 3.2.1. Government Initiatives to Curb Rubella Virus; Increasing Incidences of Rubella; Introduction of Advance Point-of-care Diagnostic Technologies
- 3.3. Market Restrains
- 3.3.1. Lack of Awareness among Developing Regions
- 3.4. Market Trends
- 3.4.1. Enzyme Immunoassay Segment is Expected to Witness a Significant Growth Over the Forecast Period.
- 4. Market Factor Analysis
- 4.1. Porters Five Forces
- 4.2. Supply/Value Chain
- 4.3. PESTEL analysis
- 4.4. Market Entropy
- 4.5. Patent/Trademark Analysis
- 5. Global Rubella Diagnostic Testing Market Analysis, Insights and Forecast, 2019-2031
- 5.1. Market Analysis, Insights and Forecast - by Testing Technique
- 5.1.1. Latex Agglutination
- 5.1.2. Enzyme Immunoassay (EIA)
- 5.1.3. Radioimmunoassay (RIA)
- 5.1.4. Fluorescent Immunoassay (FIA)
- 5.1.5. Other Testing Techniques
- 5.2. Market Analysis, Insights and Forecast - by Application
- 5.2.1. Hospitals
- 5.2.2. Laboratories
- 5.2.3. Other Applications
- 5.3. Market Analysis, Insights and Forecast - by Region
- 5.3.1. North America
- 5.3.2. Europe
- 5.3.3. Asia Pacific
- 5.3.4. Middle East
- 5.3.5. GCC
- 5.3.6. South America
- 5.1. Market Analysis, Insights and Forecast - by Testing Technique
- 6. North America Rubella Diagnostic Testing Market Analysis, Insights and Forecast, 2019-2031
- 6.1. Market Analysis, Insights and Forecast - by Testing Technique
- 6.1.1. Latex Agglutination
- 6.1.2. Enzyme Immunoassay (EIA)
- 6.1.3. Radioimmunoassay (RIA)
- 6.1.4. Fluorescent Immunoassay (FIA)
- 6.1.5. Other Testing Techniques
- 6.2. Market Analysis, Insights and Forecast - by Application
- 6.2.1. Hospitals
- 6.2.2. Laboratories
- 6.2.3. Other Applications
- 6.1. Market Analysis, Insights and Forecast - by Testing Technique
- 7. Europe Rubella Diagnostic Testing Market Analysis, Insights and Forecast, 2019-2031
- 7.1. Market Analysis, Insights and Forecast - by Testing Technique
- 7.1.1. Latex Agglutination
- 7.1.2. Enzyme Immunoassay (EIA)
- 7.1.3. Radioimmunoassay (RIA)
- 7.1.4. Fluorescent Immunoassay (FIA)
- 7.1.5. Other Testing Techniques
- 7.2. Market Analysis, Insights and Forecast - by Application
- 7.2.1. Hospitals
- 7.2.2. Laboratories
- 7.2.3. Other Applications
- 7.1. Market Analysis, Insights and Forecast - by Testing Technique
- 8. Asia Pacific Rubella Diagnostic Testing Market Analysis, Insights and Forecast, 2019-2031
- 8.1. Market Analysis, Insights and Forecast - by Testing Technique
- 8.1.1. Latex Agglutination
- 8.1.2. Enzyme Immunoassay (EIA)
- 8.1.3. Radioimmunoassay (RIA)
- 8.1.4. Fluorescent Immunoassay (FIA)
- 8.1.5. Other Testing Techniques
- 8.2. Market Analysis, Insights and Forecast - by Application
- 8.2.1. Hospitals
- 8.2.2. Laboratories
- 8.2.3. Other Applications
- 8.1. Market Analysis, Insights and Forecast - by Testing Technique
- 9. Middle East Rubella Diagnostic Testing Market Analysis, Insights and Forecast, 2019-2031
- 9.1. Market Analysis, Insights and Forecast - by Testing Technique
- 9.1.1. Latex Agglutination
- 9.1.2. Enzyme Immunoassay (EIA)
- 9.1.3. Radioimmunoassay (RIA)
- 9.1.4. Fluorescent Immunoassay (FIA)
- 9.1.5. Other Testing Techniques
- 9.2. Market Analysis, Insights and Forecast - by Application
- 9.2.1. Hospitals
- 9.2.2. Laboratories
- 9.2.3. Other Applications
- 9.1. Market Analysis, Insights and Forecast - by Testing Technique
- 10. GCC Rubella Diagnostic Testing Market Analysis, Insights and Forecast, 2019-2031
- 10.1. Market Analysis, Insights and Forecast - by Testing Technique
- 10.1.1. Latex Agglutination
- 10.1.2. Enzyme Immunoassay (EIA)
- 10.1.3. Radioimmunoassay (RIA)
- 10.1.4. Fluorescent Immunoassay (FIA)
- 10.1.5. Other Testing Techniques
- 10.2. Market Analysis, Insights and Forecast - by Application
- 10.2.1. Hospitals
- 10.2.2. Laboratories
- 10.2.3. Other Applications
- 10.1. Market Analysis, Insights and Forecast - by Testing Technique
- 11. South America Rubella Diagnostic Testing Market Analysis, Insights and Forecast, 2019-2031
- 11.1. Market Analysis, Insights and Forecast - by Testing Technique
- 11.1.1. Latex Agglutination
- 11.1.2. Enzyme Immunoassay (EIA)
- 11.1.3. Radioimmunoassay (RIA)
- 11.1.4. Fluorescent Immunoassay (FIA)
- 11.1.5. Other Testing Techniques
- 11.2. Market Analysis, Insights and Forecast - by Application
- 11.2.1. Hospitals
- 11.2.2. Laboratories
- 11.2.3. Other Applications
- 11.1. Market Analysis, Insights and Forecast - by Testing Technique
- 12. North America Rubella Diagnostic Testing Market Analysis, Insights and Forecast, 2019-2031
- 12.1. Market Analysis, Insights and Forecast - By Country/Sub-region
- 12.1.1 United States
- 12.1.2 Canada
- 12.1.3 Mexico
- 13. South America Rubella Diagnostic Testing Market Analysis, Insights and Forecast, 2019-2031
- 13.1. Market Analysis, Insights and Forecast - By Country/Sub-region
- 13.1.1 Brazil
- 13.1.2 Mexico
- 13.1.3 Rest of South America
- 14. Europe Rubella Diagnostic Testing Market Analysis, Insights and Forecast, 2019-2031
- 14.1. Market Analysis, Insights and Forecast - By Country/Sub-region
- 14.1.1 United Kingdom
- 14.1.2 Germany
- 14.1.3 France
- 14.1.4 Italy
- 14.1.5 Spain
- 14.1.6 Russia
- 14.1.7 Rest of Europe
- 15. Asia Pacific Rubella Diagnostic Testing Market Analysis, Insights and Forecast, 2019-2031
- 15.1. Market Analysis, Insights and Forecast - By Country/Sub-region
- 15.1.1 China
- 15.1.2 Japan
- 15.1.3 India
- 15.1.4 South Korea
- 15.1.5 Taiwan
- 15.1.6 Australia
- 15.1.7 Rest of Asia-Pacific
- 16. MEA Rubella Diagnostic Testing Market Analysis, Insights and Forecast, 2019-2031
- 16.1. Market Analysis, Insights and Forecast - By Country/Sub-region
- 16.1.1 Middle East
- 16.1.2 Africa
- 17. Competitive Analysis
- 17.1. Global Market Share Analysis 2024
- 17.2. Company Profiles
- 17.2.1 Siemens Healthcare GmbH
- 17.2.1.1. Overview
- 17.2.1.2. Products
- 17.2.1.3. SWOT Analysis
- 17.2.1.4. Recent Developments
- 17.2.1.5. Financials (Based on Availability)
- 17.2.2 Beckman Coulter Inc
- 17.2.2.1. Overview
- 17.2.2.2. Products
- 17.2.2.3. SWOT Analysis
- 17.2.2.4. Recent Developments
- 17.2.2.5. Financials (Based on Availability)
- 17.2.3 F Hoffmann-La Roche Ltd
- 17.2.3.1. Overview
- 17.2.3.2. Products
- 17.2.3.3. SWOT Analysis
- 17.2.3.4. Recent Developments
- 17.2.3.5. Financials (Based on Availability)
- 17.2.4 Thermo Fisher Scientific Inc
- 17.2.4.1. Overview
- 17.2.4.2. Products
- 17.2.4.3. SWOT Analysis
- 17.2.4.4. Recent Developments
- 17.2.4.5. Financials (Based on Availability)
- 17.2.5 ZEUS Scientific Inc
- 17.2.5.1. Overview
- 17.2.5.2. Products
- 17.2.5.3. SWOT Analysis
- 17.2.5.4. Recent Developments
- 17.2.5.5. Financials (Based on Availability)
- 17.2.6 Ortho Clinical Diagnostics
- 17.2.6.1. Overview
- 17.2.6.2. Products
- 17.2.6.3. SWOT Analysis
- 17.2.6.4. Recent Developments
- 17.2.6.5. Financials (Based on Availability)
- 17.2.7 BioMérieux SA
- 17.2.7.1. Overview
- 17.2.7.2. Products
- 17.2.7.3. SWOT Analysis
- 17.2.7.4. Recent Developments
- 17.2.7.5. Financials (Based on Availability)
- 17.2.8 Biokit SA
- 17.2.8.1. Overview
- 17.2.8.2. Products
- 17.2.8.3. SWOT Analysis
- 17.2.8.4. Recent Developments
- 17.2.8.5. Financials (Based on Availability)
- 17.2.9 Abbott Laboratories Inc
- 17.2.9.1. Overview
- 17.2.9.2. Products
- 17.2.9.3. SWOT Analysis
- 17.2.9.4. Recent Developments
- 17.2.9.5. Financials (Based on Availability)
- 17.2.10 Bio Rad Laboratories Inc
- 17.2.10.1. Overview
- 17.2.10.2. Products
- 17.2.10.3. SWOT Analysis
- 17.2.10.4. Recent Developments
- 17.2.10.5. Financials (Based on Availability)
- 17.2.1 Siemens Healthcare GmbH
List of Figures
- Figure 1: Global Rubella Diagnostic Testing Market Revenue Breakdown (Million, %) by Region 2024 & 2032
- Figure 2: Global Rubella Diagnostic Testing Market Volume Breakdown (K Unit, %) by Region 2024 & 2032
- Figure 3: North America Rubella Diagnostic Testing Market Revenue (Million), by Country 2024 & 2032
- Figure 4: North America Rubella Diagnostic Testing Market Volume (K Unit), by Country 2024 & 2032
- Figure 5: North America Rubella Diagnostic Testing Market Revenue Share (%), by Country 2024 & 2032
- Figure 6: North America Rubella Diagnostic Testing Market Volume Share (%), by Country 2024 & 2032
- Figure 7: South America Rubella Diagnostic Testing Market Revenue (Million), by Country 2024 & 2032
- Figure 8: South America Rubella Diagnostic Testing Market Volume (K Unit), by Country 2024 & 2032
- Figure 9: South America Rubella Diagnostic Testing Market Revenue Share (%), by Country 2024 & 2032
- Figure 10: South America Rubella Diagnostic Testing Market Volume Share (%), by Country 2024 & 2032
- Figure 11: Europe Rubella Diagnostic Testing Market Revenue (Million), by Country 2024 & 2032
- Figure 12: Europe Rubella Diagnostic Testing Market Volume (K Unit), by Country 2024 & 2032
- Figure 13: Europe Rubella Diagnostic Testing Market Revenue Share (%), by Country 2024 & 2032
- Figure 14: Europe Rubella Diagnostic Testing Market Volume Share (%), by Country 2024 & 2032
- Figure 15: Asia Pacific Rubella Diagnostic Testing Market Revenue (Million), by Country 2024 & 2032
- Figure 16: Asia Pacific Rubella Diagnostic Testing Market Volume (K Unit), by Country 2024 & 2032
- Figure 17: Asia Pacific Rubella Diagnostic Testing Market Revenue Share (%), by Country 2024 & 2032
- Figure 18: Asia Pacific Rubella Diagnostic Testing Market Volume Share (%), by Country 2024 & 2032
- Figure 19: MEA Rubella Diagnostic Testing Market Revenue (Million), by Country 2024 & 2032
- Figure 20: MEA Rubella Diagnostic Testing Market Volume (K Unit), by Country 2024 & 2032
- Figure 21: MEA Rubella Diagnostic Testing Market Revenue Share (%), by Country 2024 & 2032
- Figure 22: MEA Rubella Diagnostic Testing Market Volume Share (%), by Country 2024 & 2032
- Figure 23: North America Rubella Diagnostic Testing Market Revenue (Million), by Testing Technique 2024 & 2032
- Figure 24: North America Rubella Diagnostic Testing Market Volume (K Unit), by Testing Technique 2024 & 2032
- Figure 25: North America Rubella Diagnostic Testing Market Revenue Share (%), by Testing Technique 2024 & 2032
- Figure 26: North America Rubella Diagnostic Testing Market Volume Share (%), by Testing Technique 2024 & 2032
- Figure 27: North America Rubella Diagnostic Testing Market Revenue (Million), by Application 2024 & 2032
- Figure 28: North America Rubella Diagnostic Testing Market Volume (K Unit), by Application 2024 & 2032
- Figure 29: North America Rubella Diagnostic Testing Market Revenue Share (%), by Application 2024 & 2032
- Figure 30: North America Rubella Diagnostic Testing Market Volume Share (%), by Application 2024 & 2032
- Figure 31: North America Rubella Diagnostic Testing Market Revenue (Million), by Country 2024 & 2032
- Figure 32: North America Rubella Diagnostic Testing Market Volume (K Unit), by Country 2024 & 2032
- Figure 33: North America Rubella Diagnostic Testing Market Revenue Share (%), by Country 2024 & 2032
- Figure 34: North America Rubella Diagnostic Testing Market Volume Share (%), by Country 2024 & 2032
- Figure 35: Europe Rubella Diagnostic Testing Market Revenue (Million), by Testing Technique 2024 & 2032
- Figure 36: Europe Rubella Diagnostic Testing Market Volume (K Unit), by Testing Technique 2024 & 2032
- Figure 37: Europe Rubella Diagnostic Testing Market Revenue Share (%), by Testing Technique 2024 & 2032
- Figure 38: Europe Rubella Diagnostic Testing Market Volume Share (%), by Testing Technique 2024 & 2032
- Figure 39: Europe Rubella Diagnostic Testing Market Revenue (Million), by Application 2024 & 2032
- Figure 40: Europe Rubella Diagnostic Testing Market Volume (K Unit), by Application 2024 & 2032
- Figure 41: Europe Rubella Diagnostic Testing Market Revenue Share (%), by Application 2024 & 2032
- Figure 42: Europe Rubella Diagnostic Testing Market Volume Share (%), by Application 2024 & 2032
- Figure 43: Europe Rubella Diagnostic Testing Market Revenue (Million), by Country 2024 & 2032
- Figure 44: Europe Rubella Diagnostic Testing Market Volume (K Unit), by Country 2024 & 2032
- Figure 45: Europe Rubella Diagnostic Testing Market Revenue Share (%), by Country 2024 & 2032
- Figure 46: Europe Rubella Diagnostic Testing Market Volume Share (%), by Country 2024 & 2032
- Figure 47: Asia Pacific Rubella Diagnostic Testing Market Revenue (Million), by Testing Technique 2024 & 2032
- Figure 48: Asia Pacific Rubella Diagnostic Testing Market Volume (K Unit), by Testing Technique 2024 & 2032
- Figure 49: Asia Pacific Rubella Diagnostic Testing Market Revenue Share (%), by Testing Technique 2024 & 2032
- Figure 50: Asia Pacific Rubella Diagnostic Testing Market Volume Share (%), by Testing Technique 2024 & 2032
- Figure 51: Asia Pacific Rubella Diagnostic Testing Market Revenue (Million), by Application 2024 & 2032
- Figure 52: Asia Pacific Rubella Diagnostic Testing Market Volume (K Unit), by Application 2024 & 2032
- Figure 53: Asia Pacific Rubella Diagnostic Testing Market Revenue Share (%), by Application 2024 & 2032
- Figure 54: Asia Pacific Rubella Diagnostic Testing Market Volume Share (%), by Application 2024 & 2032
- Figure 55: Asia Pacific Rubella Diagnostic Testing Market Revenue (Million), by Country 2024 & 2032
- Figure 56: Asia Pacific Rubella Diagnostic Testing Market Volume (K Unit), by Country 2024 & 2032
- Figure 57: Asia Pacific Rubella Diagnostic Testing Market Revenue Share (%), by Country 2024 & 2032
- Figure 58: Asia Pacific Rubella Diagnostic Testing Market Volume Share (%), by Country 2024 & 2032
- Figure 59: Middle East Rubella Diagnostic Testing Market Revenue (Million), by Testing Technique 2024 & 2032
- Figure 60: Middle East Rubella Diagnostic Testing Market Volume (K Unit), by Testing Technique 2024 & 2032
- Figure 61: Middle East Rubella Diagnostic Testing Market Revenue Share (%), by Testing Technique 2024 & 2032
- Figure 62: Middle East Rubella Diagnostic Testing Market Volume Share (%), by Testing Technique 2024 & 2032
- Figure 63: Middle East Rubella Diagnostic Testing Market Revenue (Million), by Application 2024 & 2032
- Figure 64: Middle East Rubella Diagnostic Testing Market Volume (K Unit), by Application 2024 & 2032
- Figure 65: Middle East Rubella Diagnostic Testing Market Revenue Share (%), by Application 2024 & 2032
- Figure 66: Middle East Rubella Diagnostic Testing Market Volume Share (%), by Application 2024 & 2032
- Figure 67: Middle East Rubella Diagnostic Testing Market Revenue (Million), by Country 2024 & 2032
- Figure 68: Middle East Rubella Diagnostic Testing Market Volume (K Unit), by Country 2024 & 2032
- Figure 69: Middle East Rubella Diagnostic Testing Market Revenue Share (%), by Country 2024 & 2032
- Figure 70: Middle East Rubella Diagnostic Testing Market Volume Share (%), by Country 2024 & 2032
- Figure 71: GCC Rubella Diagnostic Testing Market Revenue (Million), by Testing Technique 2024 & 2032
- Figure 72: GCC Rubella Diagnostic Testing Market Volume (K Unit), by Testing Technique 2024 & 2032
- Figure 73: GCC Rubella Diagnostic Testing Market Revenue Share (%), by Testing Technique 2024 & 2032
- Figure 74: GCC Rubella Diagnostic Testing Market Volume Share (%), by Testing Technique 2024 & 2032
- Figure 75: GCC Rubella Diagnostic Testing Market Revenue (Million), by Application 2024 & 2032
- Figure 76: GCC Rubella Diagnostic Testing Market Volume (K Unit), by Application 2024 & 2032
- Figure 77: GCC Rubella Diagnostic Testing Market Revenue Share (%), by Application 2024 & 2032
- Figure 78: GCC Rubella Diagnostic Testing Market Volume Share (%), by Application 2024 & 2032
- Figure 79: GCC Rubella Diagnostic Testing Market Revenue (Million), by Country 2024 & 2032
- Figure 80: GCC Rubella Diagnostic Testing Market Volume (K Unit), by Country 2024 & 2032
- Figure 81: GCC Rubella Diagnostic Testing Market Revenue Share (%), by Country 2024 & 2032
- Figure 82: GCC Rubella Diagnostic Testing Market Volume Share (%), by Country 2024 & 2032
- Figure 83: South America Rubella Diagnostic Testing Market Revenue (Million), by Testing Technique 2024 & 2032
- Figure 84: South America Rubella Diagnostic Testing Market Volume (K Unit), by Testing Technique 2024 & 2032
- Figure 85: South America Rubella Diagnostic Testing Market Revenue Share (%), by Testing Technique 2024 & 2032
- Figure 86: South America Rubella Diagnostic Testing Market Volume Share (%), by Testing Technique 2024 & 2032
- Figure 87: South America Rubella Diagnostic Testing Market Revenue (Million), by Application 2024 & 2032
- Figure 88: South America Rubella Diagnostic Testing Market Volume (K Unit), by Application 2024 & 2032
- Figure 89: South America Rubella Diagnostic Testing Market Revenue Share (%), by Application 2024 & 2032
- Figure 90: South America Rubella Diagnostic Testing Market Volume Share (%), by Application 2024 & 2032
- Figure 91: South America Rubella Diagnostic Testing Market Revenue (Million), by Country 2024 & 2032
- Figure 92: South America Rubella Diagnostic Testing Market Volume (K Unit), by Country 2024 & 2032
- Figure 93: South America Rubella Diagnostic Testing Market Revenue Share (%), by Country 2024 & 2032
- Figure 94: South America Rubella Diagnostic Testing Market Volume Share (%), by Country 2024 & 2032
List of Tables
- Table 1: Global Rubella Diagnostic Testing Market Revenue Million Forecast, by Region 2019 & 2032
- Table 2: Global Rubella Diagnostic Testing Market Volume K Unit Forecast, by Region 2019 & 2032
- Table 3: Global Rubella Diagnostic Testing Market Revenue Million Forecast, by Testing Technique 2019 & 2032
- Table 4: Global Rubella Diagnostic Testing Market Volume K Unit Forecast, by Testing Technique 2019 & 2032
- Table 5: Global Rubella Diagnostic Testing Market Revenue Million Forecast, by Application 2019 & 2032
- Table 6: Global Rubella Diagnostic Testing Market Volume K Unit Forecast, by Application 2019 & 2032
- Table 7: Global Rubella Diagnostic Testing Market Revenue Million Forecast, by Region 2019 & 2032
- Table 8: Global Rubella Diagnostic Testing Market Volume K Unit Forecast, by Region 2019 & 2032
- Table 9: Global Rubella Diagnostic Testing Market Revenue Million Forecast, by Country 2019 & 2032
- Table 10: Global Rubella Diagnostic Testing Market Volume K Unit Forecast, by Country 2019 & 2032
- Table 11: United States Rubella Diagnostic Testing Market Revenue (Million) Forecast, by Application 2019 & 2032
- Table 12: United States Rubella Diagnostic Testing Market Volume (K Unit) Forecast, by Application 2019 & 2032
- Table 13: Canada Rubella Diagnostic Testing Market Revenue (Million) Forecast, by Application 2019 & 2032
- Table 14: Canada Rubella Diagnostic Testing Market Volume (K Unit) Forecast, by Application 2019 & 2032
- Table 15: Mexico Rubella Diagnostic Testing Market Revenue (Million) Forecast, by Application 2019 & 2032
- Table 16: Mexico Rubella Diagnostic Testing Market Volume (K Unit) Forecast, by Application 2019 & 2032
- Table 17: Global Rubella Diagnostic Testing Market Revenue Million Forecast, by Country 2019 & 2032
- Table 18: Global Rubella Diagnostic Testing Market Volume K Unit Forecast, by Country 2019 & 2032
- Table 19: Brazil Rubella Diagnostic Testing Market Revenue (Million) Forecast, by Application 2019 & 2032
- Table 20: Brazil Rubella Diagnostic Testing Market Volume (K Unit) Forecast, by Application 2019 & 2032
- Table 21: Mexico Rubella Diagnostic Testing Market Revenue (Million) Forecast, by Application 2019 & 2032
- Table 22: Mexico Rubella Diagnostic Testing Market Volume (K Unit) Forecast, by Application 2019 & 2032
- Table 23: Rest of South America Rubella Diagnostic Testing Market Revenue (Million) Forecast, by Application 2019 & 2032
- Table 24: Rest of South America Rubella Diagnostic Testing Market Volume (K Unit) Forecast, by Application 2019 & 2032
- Table 25: Global Rubella Diagnostic Testing Market Revenue Million Forecast, by Country 2019 & 2032
- Table 26: Global Rubella Diagnostic Testing Market Volume K Unit Forecast, by Country 2019 & 2032
- Table 27: United Kingdom Rubella Diagnostic Testing Market Revenue (Million) Forecast, by Application 2019 & 2032
- Table 28: United Kingdom Rubella Diagnostic Testing Market Volume (K Unit) Forecast, by Application 2019 & 2032
- Table 29: Germany Rubella Diagnostic Testing Market Revenue (Million) Forecast, by Application 2019 & 2032
- Table 30: Germany Rubella Diagnostic Testing Market Volume (K Unit) Forecast, by Application 2019 & 2032
- Table 31: France Rubella Diagnostic Testing Market Revenue (Million) Forecast, by Application 2019 & 2032
- Table 32: France Rubella Diagnostic Testing Market Volume (K Unit) Forecast, by Application 2019 & 2032
- Table 33: Italy Rubella Diagnostic Testing Market Revenue (Million) Forecast, by Application 2019 & 2032
- Table 34: Italy Rubella Diagnostic Testing Market Volume (K Unit) Forecast, by Application 2019 & 2032
- Table 35: Spain Rubella Diagnostic Testing Market Revenue (Million) Forecast, by Application 2019 & 2032
- Table 36: Spain Rubella Diagnostic Testing Market Volume (K Unit) Forecast, by Application 2019 & 2032
- Table 37: Russia Rubella Diagnostic Testing Market Revenue (Million) Forecast, by Application 2019 & 2032
- Table 38: Russia Rubella Diagnostic Testing Market Volume (K Unit) Forecast, by Application 2019 & 2032
- Table 39: Rest of Europe Rubella Diagnostic Testing Market Revenue (Million) Forecast, by Application 2019 & 2032
- Table 40: Rest of Europe Rubella Diagnostic Testing Market Volume (K Unit) Forecast, by Application 2019 & 2032
- Table 41: Global Rubella Diagnostic Testing Market Revenue Million Forecast, by Country 2019 & 2032
- Table 42: Global Rubella Diagnostic Testing Market Volume K Unit Forecast, by Country 2019 & 2032
- Table 43: China Rubella Diagnostic Testing Market Revenue (Million) Forecast, by Application 2019 & 2032
- Table 44: China Rubella Diagnostic Testing Market Volume (K Unit) Forecast, by Application 2019 & 2032
- Table 45: Japan Rubella Diagnostic Testing Market Revenue (Million) Forecast, by Application 2019 & 2032
- Table 46: Japan Rubella Diagnostic Testing Market Volume (K Unit) Forecast, by Application 2019 & 2032
- Table 47: India Rubella Diagnostic Testing Market Revenue (Million) Forecast, by Application 2019 & 2032
- Table 48: India Rubella Diagnostic Testing Market Volume (K Unit) Forecast, by Application 2019 & 2032
- Table 49: South Korea Rubella Diagnostic Testing Market Revenue (Million) Forecast, by Application 2019 & 2032
- Table 50: South Korea Rubella Diagnostic Testing Market Volume (K Unit) Forecast, by Application 2019 & 2032
- Table 51: Taiwan Rubella Diagnostic Testing Market Revenue (Million) Forecast, by Application 2019 & 2032
- Table 52: Taiwan Rubella Diagnostic Testing Market Volume (K Unit) Forecast, by Application 2019 & 2032
- Table 53: Australia Rubella Diagnostic Testing Market Revenue (Million) Forecast, by Application 2019 & 2032
- Table 54: Australia Rubella Diagnostic Testing Market Volume (K Unit) Forecast, by Application 2019 & 2032
- Table 55: Rest of Asia-Pacific Rubella Diagnostic Testing Market Revenue (Million) Forecast, by Application 2019 & 2032
- Table 56: Rest of Asia-Pacific Rubella Diagnostic Testing Market Volume (K Unit) Forecast, by Application 2019 & 2032
- Table 57: Global Rubella Diagnostic Testing Market Revenue Million Forecast, by Country 2019 & 2032
- Table 58: Global Rubella Diagnostic Testing Market Volume K Unit Forecast, by Country 2019 & 2032
- Table 59: Middle East Rubella Diagnostic Testing Market Revenue (Million) Forecast, by Application 2019 & 2032
- Table 60: Middle East Rubella Diagnostic Testing Market Volume (K Unit) Forecast, by Application 2019 & 2032
- Table 61: Africa Rubella Diagnostic Testing Market Revenue (Million) Forecast, by Application 2019 & 2032
- Table 62: Africa Rubella Diagnostic Testing Market Volume (K Unit) Forecast, by Application 2019 & 2032
- Table 63: Global Rubella Diagnostic Testing Market Revenue Million Forecast, by Testing Technique 2019 & 2032
- Table 64: Global Rubella Diagnostic Testing Market Volume K Unit Forecast, by Testing Technique 2019 & 2032
- Table 65: Global Rubella Diagnostic Testing Market Revenue Million Forecast, by Application 2019 & 2032
- Table 66: Global Rubella Diagnostic Testing Market Volume K Unit Forecast, by Application 2019 & 2032
- Table 67: Global Rubella Diagnostic Testing Market Revenue Million Forecast, by Country 2019 & 2032
- Table 68: Global Rubella Diagnostic Testing Market Volume K Unit Forecast, by Country 2019 & 2032
- Table 69: United States Rubella Diagnostic Testing Market Revenue (Million) Forecast, by Application 2019 & 2032
- Table 70: United States Rubella Diagnostic Testing Market Volume (K Unit) Forecast, by Application 2019 & 2032
- Table 71: Canada Rubella Diagnostic Testing Market Revenue (Million) Forecast, by Application 2019 & 2032
- Table 72: Canada Rubella Diagnostic Testing Market Volume (K Unit) Forecast, by Application 2019 & 2032
- Table 73: Mexico Rubella Diagnostic Testing Market Revenue (Million) Forecast, by Application 2019 & 2032
- Table 74: Mexico Rubella Diagnostic Testing Market Volume (K Unit) Forecast, by Application 2019 & 2032
- Table 75: Global Rubella Diagnostic Testing Market Revenue Million Forecast, by Testing Technique 2019 & 2032
- Table 76: Global Rubella Diagnostic Testing Market Volume K Unit Forecast, by Testing Technique 2019 & 2032
- Table 77: Global Rubella Diagnostic Testing Market Revenue Million Forecast, by Application 2019 & 2032
- Table 78: Global Rubella Diagnostic Testing Market Volume K Unit Forecast, by Application 2019 & 2032
- Table 79: Global Rubella Diagnostic Testing Market Revenue Million Forecast, by Country 2019 & 2032
- Table 80: Global Rubella Diagnostic Testing Market Volume K Unit Forecast, by Country 2019 & 2032
- Table 81: Germany Rubella Diagnostic Testing Market Revenue (Million) Forecast, by Application 2019 & 2032
- Table 82: Germany Rubella Diagnostic Testing Market Volume (K Unit) Forecast, by Application 2019 & 2032
- Table 83: United Kingdom Rubella Diagnostic Testing Market Revenue (Million) Forecast, by Application 2019 & 2032
- Table 84: United Kingdom Rubella Diagnostic Testing Market Volume (K Unit) Forecast, by Application 2019 & 2032
- Table 85: France Rubella Diagnostic Testing Market Revenue (Million) Forecast, by Application 2019 & 2032
- Table 86: France Rubella Diagnostic Testing Market Volume (K Unit) Forecast, by Application 2019 & 2032
- Table 87: Italy Rubella Diagnostic Testing Market Revenue (Million) Forecast, by Application 2019 & 2032
- Table 88: Italy Rubella Diagnostic Testing Market Volume (K Unit) Forecast, by Application 2019 & 2032
- Table 89: Spain Rubella Diagnostic Testing Market Revenue (Million) Forecast, by Application 2019 & 2032
- Table 90: Spain Rubella Diagnostic Testing Market Volume (K Unit) Forecast, by Application 2019 & 2032
- Table 91: Rest of Europe Rubella Diagnostic Testing Market Revenue (Million) Forecast, by Application 2019 & 2032
- Table 92: Rest of Europe Rubella Diagnostic Testing Market Volume (K Unit) Forecast, by Application 2019 & 2032
- Table 93: Global Rubella Diagnostic Testing Market Revenue Million Forecast, by Testing Technique 2019 & 2032
- Table 94: Global Rubella Diagnostic Testing Market Volume K Unit Forecast, by Testing Technique 2019 & 2032
- Table 95: Global Rubella Diagnostic Testing Market Revenue Million Forecast, by Application 2019 & 2032
- Table 96: Global Rubella Diagnostic Testing Market Volume K Unit Forecast, by Application 2019 & 2032
- Table 97: Global Rubella Diagnostic Testing Market Revenue Million Forecast, by Country 2019 & 2032
- Table 98: Global Rubella Diagnostic Testing Market Volume K Unit Forecast, by Country 2019 & 2032
- Table 99: China Rubella Diagnostic Testing Market Revenue (Million) Forecast, by Application 2019 & 2032
- Table 100: China Rubella Diagnostic Testing Market Volume (K Unit) Forecast, by Application 2019 & 2032
- Table 101: Japan Rubella Diagnostic Testing Market Revenue (Million) Forecast, by Application 2019 & 2032
- Table 102: Japan Rubella Diagnostic Testing Market Volume (K Unit) Forecast, by Application 2019 & 2032
- Table 103: India Rubella Diagnostic Testing Market Revenue (Million) Forecast, by Application 2019 & 2032
- Table 104: India Rubella Diagnostic Testing Market Volume (K Unit) Forecast, by Application 2019 & 2032
- Table 105: Australia Rubella Diagnostic Testing Market Revenue (Million) Forecast, by Application 2019 & 2032
- Table 106: Australia Rubella Diagnostic Testing Market Volume (K Unit) Forecast, by Application 2019 & 2032
- Table 107: South Korea Rubella Diagnostic Testing Market Revenue (Million) Forecast, by Application 2019 & 2032
- Table 108: South Korea Rubella Diagnostic Testing Market Volume (K Unit) Forecast, by Application 2019 & 2032
- Table 109: Rest of Asia Pacific Rubella Diagnostic Testing Market Revenue (Million) Forecast, by Application 2019 & 2032
- Table 110: Rest of Asia Pacific Rubella Diagnostic Testing Market Volume (K Unit) Forecast, by Application 2019 & 2032
- Table 111: Global Rubella Diagnostic Testing Market Revenue Million Forecast, by Testing Technique 2019 & 2032
- Table 112: Global Rubella Diagnostic Testing Market Volume K Unit Forecast, by Testing Technique 2019 & 2032
- Table 113: Global Rubella Diagnostic Testing Market Revenue Million Forecast, by Application 2019 & 2032
- Table 114: Global Rubella Diagnostic Testing Market Volume K Unit Forecast, by Application 2019 & 2032
- Table 115: Global Rubella Diagnostic Testing Market Revenue Million Forecast, by Country 2019 & 2032
- Table 116: Global Rubella Diagnostic Testing Market Volume K Unit Forecast, by Country 2019 & 2032
- Table 117: Global Rubella Diagnostic Testing Market Revenue Million Forecast, by Testing Technique 2019 & 2032
- Table 118: Global Rubella Diagnostic Testing Market Volume K Unit Forecast, by Testing Technique 2019 & 2032
- Table 119: Global Rubella Diagnostic Testing Market Revenue Million Forecast, by Application 2019 & 2032
- Table 120: Global Rubella Diagnostic Testing Market Volume K Unit Forecast, by Application 2019 & 2032
- Table 121: Global Rubella Diagnostic Testing Market Revenue Million Forecast, by Country 2019 & 2032
- Table 122: Global Rubella Diagnostic Testing Market Volume K Unit Forecast, by Country 2019 & 2032
- Table 123: South Africa Rubella Diagnostic Testing Market Revenue (Million) Forecast, by Application 2019 & 2032
- Table 124: South Africa Rubella Diagnostic Testing Market Volume (K Unit) Forecast, by Application 2019 & 2032
- Table 125: Rest of Middle East Rubella Diagnostic Testing Market Revenue (Million) Forecast, by Application 2019 & 2032
- Table 126: Rest of Middle East Rubella Diagnostic Testing Market Volume (K Unit) Forecast, by Application 2019 & 2032
- Table 127: Global Rubella Diagnostic Testing Market Revenue Million Forecast, by Testing Technique 2019 & 2032
- Table 128: Global Rubella Diagnostic Testing Market Volume K Unit Forecast, by Testing Technique 2019 & 2032
- Table 129: Global Rubella Diagnostic Testing Market Revenue Million Forecast, by Application 2019 & 2032
- Table 130: Global Rubella Diagnostic Testing Market Volume K Unit Forecast, by Application 2019 & 2032
- Table 131: Global Rubella Diagnostic Testing Market Revenue Million Forecast, by Country 2019 & 2032
- Table 132: Global Rubella Diagnostic Testing Market Volume K Unit Forecast, by Country 2019 & 2032
- Table 133: Brazil Rubella Diagnostic Testing Market Revenue (Million) Forecast, by Application 2019 & 2032
- Table 134: Brazil Rubella Diagnostic Testing Market Volume (K Unit) Forecast, by Application 2019 & 2032
- Table 135: Argentina Rubella Diagnostic Testing Market Revenue (Million) Forecast, by Application 2019 & 2032
- Table 136: Argentina Rubella Diagnostic Testing Market Volume (K Unit) Forecast, by Application 2019 & 2032
- Table 137: Rest of South America Rubella Diagnostic Testing Market Revenue (Million) Forecast, by Application 2019 & 2032
- Table 138: Rest of South America Rubella Diagnostic Testing Market Volume (K Unit) Forecast, by Application 2019 & 2032
Frequently Asked Questions
1. What is the projected Compound Annual Growth Rate (CAGR) of the Rubella Diagnostic Testing Market?
The projected CAGR is approximately 5.23%.
2. Which companies are prominent players in the Rubella Diagnostic Testing Market?
Key companies in the market include Siemens Healthcare GmbH, Beckman Coulter Inc, F Hoffmann-La Roche Ltd, Thermo Fisher Scientific Inc, ZEUS Scientific Inc , Ortho Clinical Diagnostics, BioMérieux SA, Biokit SA, Abbott Laboratories Inc, Bio Rad Laboratories Inc.
3. What are the main segments of the Rubella Diagnostic Testing Market?
The market segments include Testing Technique, Application.
4. Can you provide details about the market size?
The market size is estimated to be USD 1.39 Million as of 2022.
5. What are some drivers contributing to market growth?
Government Initiatives to Curb Rubella Virus; Increasing Incidences of Rubella; Introduction of Advance Point-of-care Diagnostic Technologies.
6. What are the notable trends driving market growth?
Enzyme Immunoassay Segment is Expected to Witness a Significant Growth Over the Forecast Period..
7. Are there any restraints impacting market growth?
Lack of Awareness among Developing Regions.
8. Can you provide examples of recent developments in the market?
August 2022: Roche reported that the United States Food and Drug Administration (USFDA) has approved a label expansion for its Ventana MMR RxDx Panel that provides clinicians with access to a fully automated panel of mismatch repair (MMR) biomarkers tested by immunohistochemistry (IHC).
9. What pricing options are available for accessing the report?
Pricing options include single-user, multi-user, and enterprise licenses priced at USD 4750, USD 5250, and USD 8750 respectively.
10. Is the market size provided in terms of value or volume?
The market size is provided in terms of value, measured in Million and volume, measured in K Unit.
11. Are there any specific market keywords associated with the report?
Yes, the market keyword associated with the report is "Rubella Diagnostic Testing Market," which aids in identifying and referencing the specific market segment covered.
12. How do I determine which pricing option suits my needs best?
The pricing options vary based on user requirements and access needs. Individual users may opt for single-user licenses, while businesses requiring broader access may choose multi-user or enterprise licenses for cost-effective access to the report.
13. Are there any additional resources or data provided in the Rubella Diagnostic Testing Market report?
While the report offers comprehensive insights, it's advisable to review the specific contents or supplementary materials provided to ascertain if additional resources or data are available.
14. How can I stay updated on further developments or reports in the Rubella Diagnostic Testing Market?
To stay informed about further developments, trends, and reports in the Rubella Diagnostic Testing Market, consider subscribing to industry newsletters, following relevant companies and organizations, or regularly checking reputable industry news sources and publications.
Methodology
Step 1 - Identification of Relevant Samples Size from Population Database


Step 2 - Approaches for Defining Global Market Size (Value, Volume* & Price*)

Note*: In applicable scenarios
Step 3 - Data Sources
Primary Research
- Web Analytics
- Survey Reports
- Research Institute
- Latest Research Reports
- Opinion Leaders
Secondary Research
- Annual Reports
- White Paper
- Latest Press Release
- Industry Association
- Paid Database
- Investor Presentations

Step 4 - Data Triangulation
Involves using different sources of information in order to increase the validity of a study
These sources are likely to be stakeholders in a program - participants, other researchers, program staff, other community members, and so on.
Then we put all data in single framework & apply various statistical tools to find out the dynamic on the market.
During the analysis stage, feedback from the stakeholder groups would be compared to determine areas of agreement as well as areas of divergence


