
Key Insights
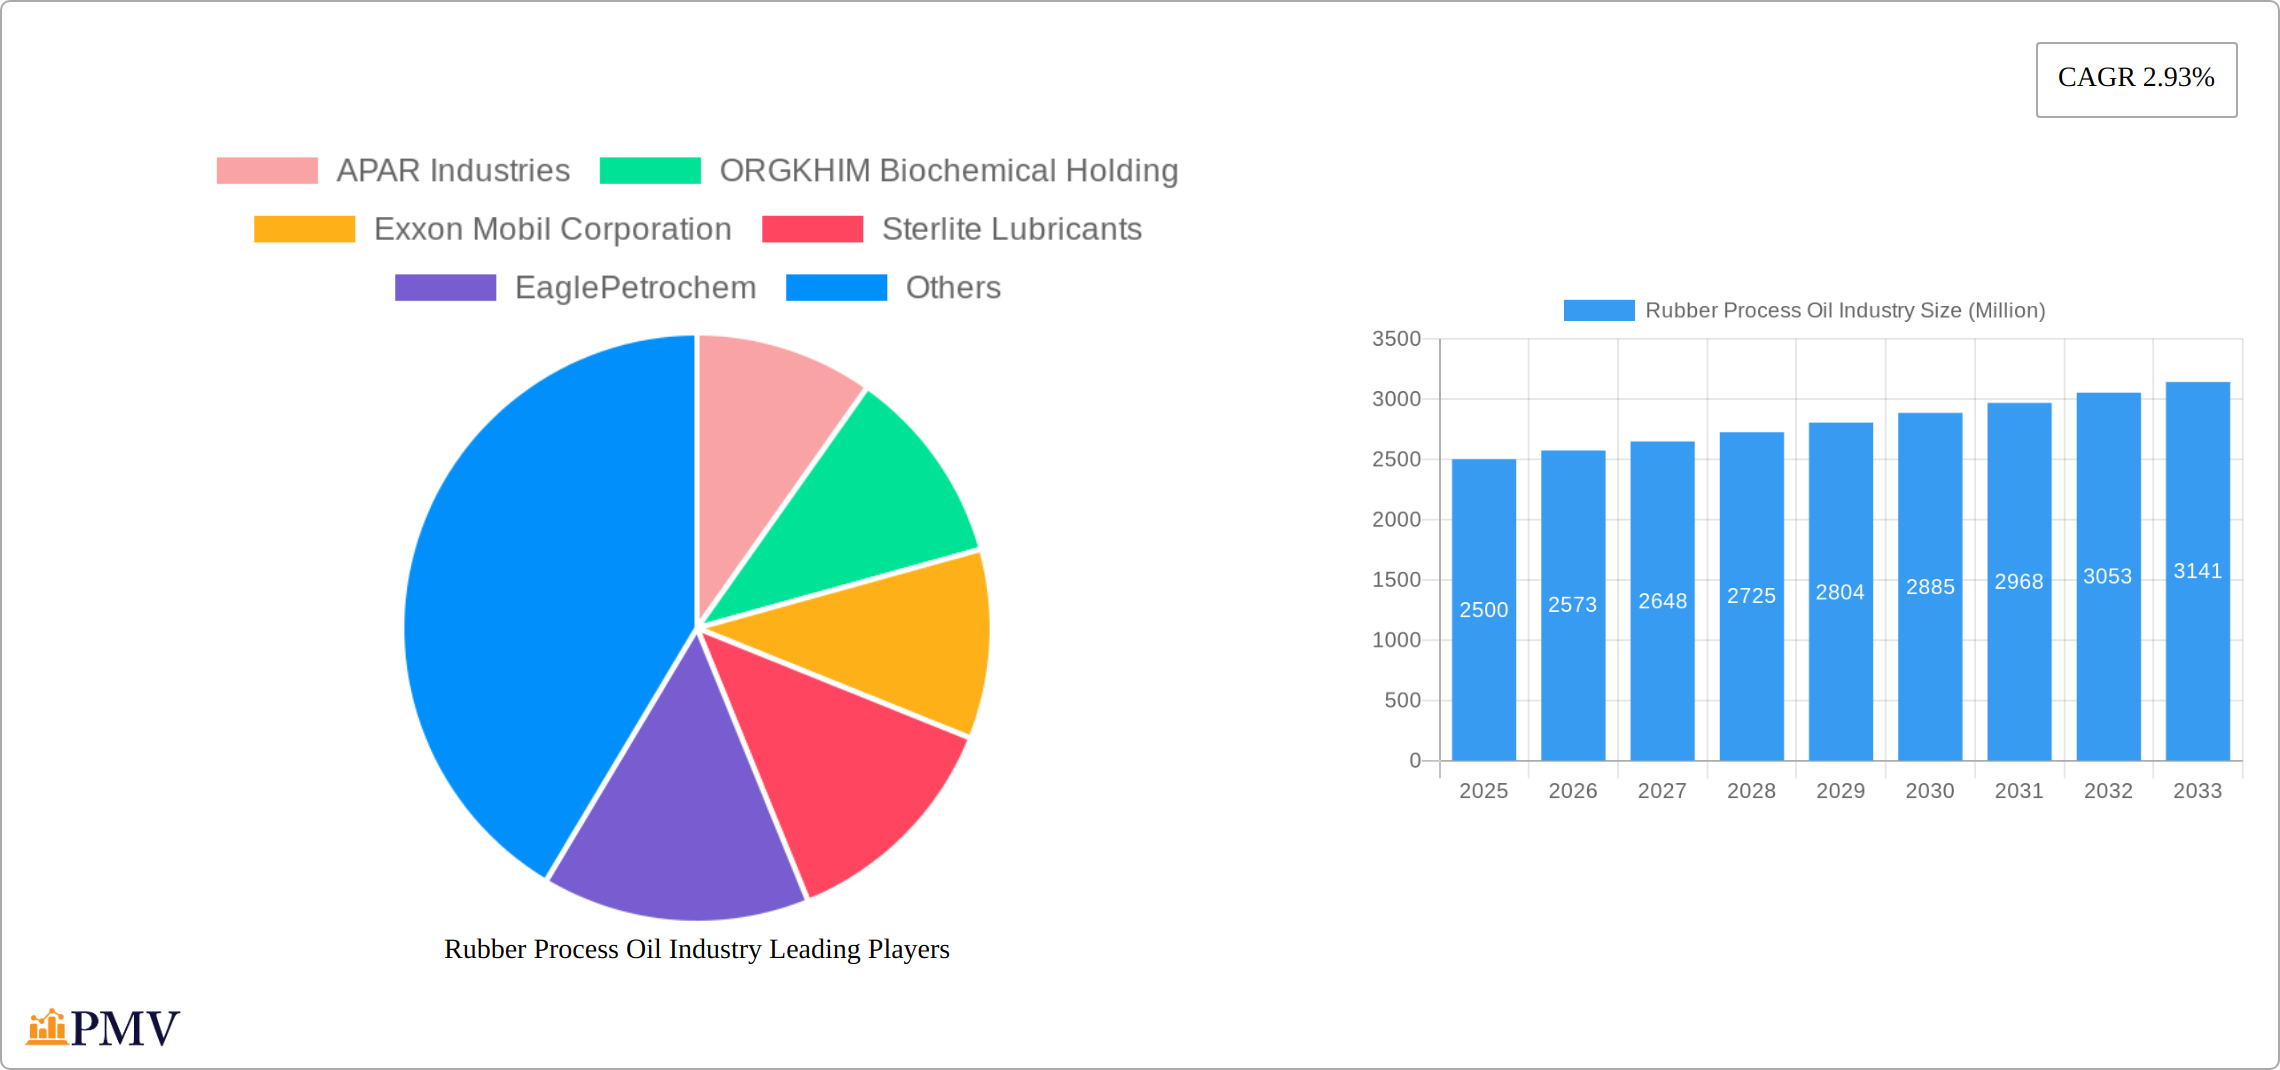
The Rubber Process Oil Industry is projected to reach a market size of $2.5 billion by 2025, growing at a compound annual growth rate (CAGR) of 2.93% from 2025 to 2033. This growth is primarily driven by the increasing demand for high-performance tires and automotive components, which require rubber process oils for enhanced durability and performance. Key drivers include the expansion of the automotive sector, particularly in emerging economies such as China and India, and the growing trend towards sustainable and eco-friendly rubber process oils. The market is segmented by product type into Aromatic, Paraffinic, and Naphthenic oils, with Aromatic oils dominating due to their superior solvency and compatibility with a wide range of elastomers. Application segments include Tire and Automobile Components, Footwear, Consumer Goods, and other applications, with the tire and automotive sector being the largest consumer.
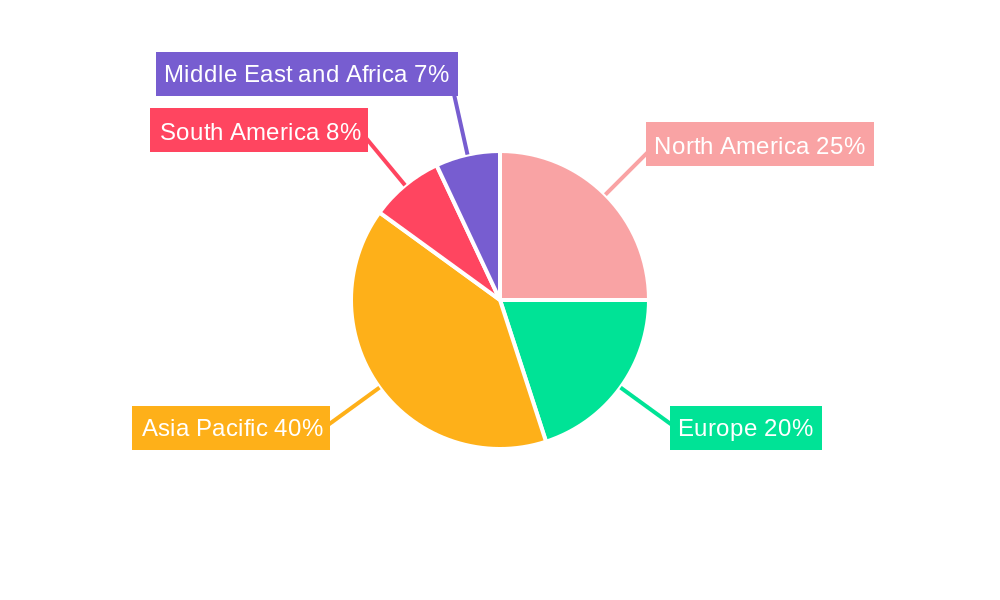
Significant trends shaping the market include the shift towards low Polycyclic Aromatic Hydrocarbons (PAH) content oils in response to stringent environmental regulations, and the increasing adoption of bio-based and synthetic rubber process oils. However, the market faces restraints such as fluctuating crude oil prices and the volatility of raw material costs. Leading companies in the industry, such as APAR Industries, Exxon Mobil Corporation, and Chevron Corporation, are investing in research and development to innovate and meet evolving market demands. Regionally, Asia Pacific holds the largest market share, driven by robust industrial growth and high demand from the automotive sector, followed by North America and Europe. The market outlook remains positive, with opportunities for growth in developing regions and through technological advancements.
Rubber Process Oil Industry Market Structure & Competitive Dynamics
The Rubber Process Oil industry presents a dynamic competitive landscape, blending multinational corporations with regional players. Market concentration is moderate, with leading companies like APAR Industries, ORGKHIM Biochemical Holding, and ExxonMobil Corporation collectively holding a substantial market share, estimated at approximately 30%. This sector is characterized by a vibrant innovation ecosystem fueled by the demand for sustainable and high-performance oils. Stringent regulatory frameworks, such as REACH in Europe and TSCA in the US, significantly influence product development and market access strategies, driving manufacturers to prioritize compliance and eco-conscious solutions.
- Market Share Consolidation: Key players, including Chevron Corporation and Repsol, command a combined market share of roughly 25%, highlighting the industry's concentrated nature.
- Strategic Innovation Partnerships: Collaboration between oil producers and key end-users, particularly within the tire manufacturing sector, is accelerating the development and adoption of environmentally friendly oils, reflecting a growing industry-wide commitment to sustainability.
- Regulatory Compliance as a Competitive Advantage: Adherence to increasingly stringent environmental regulations is a crucial factor shaping market dynamics, rewarding companies that proactively invest in compliant and sustainable production methods.
- Emergence of Bio-based Alternatives: Bio-based oils are emerging as compelling substitutes, presenting both opportunities and challenges for traditional petroleum-based rubber process oil manufacturers. This shift necessitates adaptability and innovation within the industry.
- End-User Demand Driving Performance Improvements: The automotive industry's push for longer-lasting, more efficient tires is driving a significant demand for high-performance rubber process oils, creating opportunities for specialized product development.
- Strategic M&A Activity Reflects Industry Consolidation: Significant mergers and acquisitions, such as the acquisition of Sterlite Lubricants (for an undisclosed sum), demonstrate the ongoing consolidation within the industry as larger players seek to expand their market reach and enhance their competitive positions.
Rubber Process Oil Industry Industry Trends & Insights
The Rubber Process Oil industry is experiencing robust growth, projected to reach xx Million by 2033, exhibiting a CAGR of 4.5% from 2025-2033. This growth trajectory is propelled by several key factors. Technological advancements, such as the development of low-viscosity oils, are leading to enhanced performance characteristics in rubber products. Concurrently, a global shift towards environmentally responsible products is driving innovation and creating a demand for sustainable alternatives. The automotive sector's expansion, particularly within emerging markets like China and India, significantly fuels the demand for tires, consequently boosting the market for rubber process oils.
The intensified competitive landscape sees companies like TotalEnergies and HF Sinclair Corporation investing heavily in R&D to maintain a competitive edge. Furthermore, the increasing penetration of rubber process oils in the footwear industry reflects the growing need for enhanced product quality and durability. Challenges remain, however, including volatile crude oil prices impacting production costs and stringent VOC regulations demanding product reformulation. Despite these hurdles, the industry is poised for sustained growth, driven by technological progress and the broadening applications of rubber process oils.
Dominant Markets & Segments in Rubber Process Oil Industry
The Asia-Pacific region, particularly China, is the dominant market for rubber process oils, driven by its thriving automotive and manufacturing sectors. The region is expected to maintain its leadership position throughout the forecast period, with a projected market size of xx Million by 2033.
- Economic Policies: Favorable government policies in China and India are boosting the demand for rubber process oils in tire manufacturing.
- Infrastructure: The development of industrial zones and manufacturing hubs in Asia-Pacific is supporting the growth of the rubber process oil market.
The Paraffinic segment is the largest by product type, accounting for approximately 40% of the market share. This segment's dominance is attributed to its excellent thermal stability and low volatility, making it ideal for high-performance applications. The Naphthenic segment is also significant, particularly in the production of tires and rubber components, due to its superior solvency and low-temperature properties.
- Aromatic: The Aromatic segment, although smaller, is growing due to its cost-effectiveness and suitability for certain rubber compounds.
- Tire and Automobile Components: This application segment holds the largest market share, driven by the global automotive industry's expansion.
- Footwear: The footwear industry is increasingly using rubber process oils to enhance product durability and flexibility.
- Consumer Goods: The demand for rubber process oils in consumer goods is rising, as manufacturers seek to improve product quality.
- Other Applications: Emerging applications in industrial rubber products are contributing to market growth.
Rubber Process Oil Industry Product Innovations
Recent advancements in rubber process oils encompass the development of bio-based alternatives, presenting a sustainable alternative to traditional petroleum-based products. This wave of innovation is spurred by technological trends such as green chemistry and aligns with the market's escalating demand for environmentally friendly solutions. Companies like Panama Petrochem Ltd are at the forefront of this transition, utilizing their expertise to develop high-performance, eco-conscious oils that satisfy the evolving needs of the end-user market.
Report Segmentation & Scope
The Rubber Process Oil Industry is segmented by product type and application, providing a comprehensive view of market dynamics.
- Aromatic: Expected to grow at a CAGR of 3.8%, reaching a market size of xx Million by 2033, driven by its affordability and versatility in rubber compounding.
- Paraffinic: The largest segment, projected to reach xx Million by 2033, with a CAGR of 4.7%, due to its superior performance characteristics.
- Naphthenic: Anticipated to grow at a CAGR of 4.2%, reaching xx Million by 2033, fueled by its use in high-performance rubber products.
- Tire and Automobile Components: The dominant application segment, expected to reach xx Million by 2033, with a CAGR of 5.1%, driven by the automotive industry's growth.
- Footwear: Projected to grow at a CAGR of 4.3%, reaching xx Million by 2033, as manufacturers prioritize product quality and durability.
- Consumer Goods: Expected to grow at a CAGR of 3.9%, reaching xx Million by 2033, driven by the demand for high-quality rubber products.
- Other Applications: Anticipated to grow at a CAGR of 4.0%, reaching xx Million by 2033, as new uses for rubber process oils emerge.
Key Drivers of Rubber Process Oil Industry Growth
The expansion of the Rubber Process Oil industry is fueled by several key factors:
- Technological Advancements: Continuous improvements in oil refining and formulation processes are resulting in higher-performing and more sustainable rubber process oils.
- Robust Global Economic Growth: Expansion within the automotive and manufacturing sectors, particularly in developing economies, is a major driver of increased demand.
- Supportive Regulatory Environments: Government policies that incentivize industrial growth and sustainable practices further enhance market expansion.
Challenges in the Rubber Process Oil Industry Sector
The Rubber Process Oil industry faces several challenges that could potentially impact its growth trajectory:
- Navigating Stringent Environmental Regulations: Strict environmental regulations, including limitations on VOC emissions, are increasing compliance costs and requiring manufacturers to adapt their processes and product formulations.
- Supply Chain Vulnerabilities: Fluctuations in crude oil prices and geopolitical instability can disrupt the supply chain, impacting both production costs and product availability.
- Intense Competitive Pressure: Fierce competition among major industry players is leading to price pressures and reduced profit margins, especially for smaller companies.
Leading Players in the Rubber Process Oil Industry Market
- APAR Industries
- ORGKHIM Biochemical Holding
- Exxon Mobil Corporation
- Sterlite Lubricants
- EaglePetrochem
- Repsol
- LODHA Petro
- Chevron Corporation
- Witmans Industries Pvt Ltd
- TotalEnergies
- HF Sinclair Corporation
- Panama Petrochem Ltd
- CPC Corporation
Key Developments in Rubber Process Oil Industry Sector
- 2023/05: Exxon Mobil Corporation launched a new range of low-viscosity rubber process oils, enhancing product performance and sustainability.
- 2022/10: TotalEnergies acquired a leading rubber process oil manufacturer, strengthening its position in the market.
- 2021/07: Panama Petrochem Ltd introduced bio-based rubber process oils, catering to the growing demand for eco-friendly solutions.
Strategic Rubber Process Oil Industry Market Outlook
The Rubber Process Oil Industry is poised for significant growth in the coming years, driven by technological advancements and the expanding application scope of rubber process oils. Strategic opportunities include the development of sustainable products, expansion into emerging markets, and partnerships with end-users to tailor solutions to specific needs. The industry's future potential lies in its ability to innovate and adapt to changing market demands, ensuring continued growth and competitiveness.
Rubber Process Oil Industry Segmentation
-
1. Product Type
- 1.1. Aromatic
- 1.2. Paraffinic
- 1.3. Naphthenic
-
2. Application
- 2.1. Tire and Automobile Components
- 2.2. Footwear
- 2.3. Consumer Goods
- 2.4. Other Applications
Rubber Process Oil Industry Segmentation By Geography
-
1. Asia Pacific
- 1.1. China
- 1.2. India
- 1.3. Japan
- 1.4. South Korea
- 1.5. Rest of Asia Pacific
-
2. North America
- 2.1. United States
- 2.2. Canada
- 2.3. Mexico
-
3. Europe
- 3.1. Germany
- 3.2. United Kingdom
- 3.3. France
- 3.4. Italy
- 3.5. Rest of Europe
-
4. South America
- 4.1. Brazil
- 4.2. Argentina
- 4.3. Rest of South America
-
5. Middle East and Africa
- 5.1. Saudi Arabia
- 5.2. South Africa
- 5.3. Rest of Middle East and Africa
Rubber Process Oil Industry REPORT HIGHLIGHTS
| Aspects | Details |
|---|---|
| Study Period | 2019-2033 |
| Base Year | 2024 |
| Estimated Year | 2025 |
| Forecast Period | 2025-2033 |
| Historical Period | 2019-2024 |
| Growth Rate | CAGR of 2.93% from 2019-2033 |
| Segmentation |
|
Table of Contents
- 1. Introduction
- 1.1. Research Scope
- 1.2. Market Segmentation
- 1.3. Research Methodology
- 1.4. Definitions and Assumptions
- 2. Executive Summary
- 2.1. Introduction
- 3. Market Dynamics
- 3.1. Introduction
- 3.2. Market Drivers
- 3.2.1. Increasing Demand for Tire and Automotive Components; Growing Demand for Footwear; Others
- 3.3. Market Restrains
- 3.3.1. Volatility in Raw Material Price; Other Restraints
- 3.4. Market Trends
- 3.4.1. Growing Demand of Rubber Process Oil from Tire and Automobile Components
- 4. Market Factor Analysis
- 4.1. Porters Five Forces
- 4.2. Supply/Value Chain
- 4.3. PESTEL analysis
- 4.4. Market Entropy
- 4.5. Patent/Trademark Analysis
- 5. Global Rubber Process Oil Industry Analysis, Insights and Forecast, 2019-2031
- 5.1. Market Analysis, Insights and Forecast - by Product Type
- 5.1.1. Aromatic
- 5.1.2. Paraffinic
- 5.1.3. Naphthenic
- 5.2. Market Analysis, Insights and Forecast - by Application
- 5.2.1. Tire and Automobile Components
- 5.2.2. Footwear
- 5.2.3. Consumer Goods
- 5.2.4. Other Applications
- 5.3. Market Analysis, Insights and Forecast - by Region
- 5.3.1. Asia Pacific
- 5.3.2. North America
- 5.3.3. Europe
- 5.3.4. South America
- 5.3.5. Middle East and Africa
- 5.1. Market Analysis, Insights and Forecast - by Product Type
- 6. Asia Pacific Rubber Process Oil Industry Analysis, Insights and Forecast, 2019-2031
- 6.1. Market Analysis, Insights and Forecast - by Product Type
- 6.1.1. Aromatic
- 6.1.2. Paraffinic
- 6.1.3. Naphthenic
- 6.2. Market Analysis, Insights and Forecast - by Application
- 6.2.1. Tire and Automobile Components
- 6.2.2. Footwear
- 6.2.3. Consumer Goods
- 6.2.4. Other Applications
- 6.1. Market Analysis, Insights and Forecast - by Product Type
- 7. North America Rubber Process Oil Industry Analysis, Insights and Forecast, 2019-2031
- 7.1. Market Analysis, Insights and Forecast - by Product Type
- 7.1.1. Aromatic
- 7.1.2. Paraffinic
- 7.1.3. Naphthenic
- 7.2. Market Analysis, Insights and Forecast - by Application
- 7.2.1. Tire and Automobile Components
- 7.2.2. Footwear
- 7.2.3. Consumer Goods
- 7.2.4. Other Applications
- 7.1. Market Analysis, Insights and Forecast - by Product Type
- 8. Europe Rubber Process Oil Industry Analysis, Insights and Forecast, 2019-2031
- 8.1. Market Analysis, Insights and Forecast - by Product Type
- 8.1.1. Aromatic
- 8.1.2. Paraffinic
- 8.1.3. Naphthenic
- 8.2. Market Analysis, Insights and Forecast - by Application
- 8.2.1. Tire and Automobile Components
- 8.2.2. Footwear
- 8.2.3. Consumer Goods
- 8.2.4. Other Applications
- 8.1. Market Analysis, Insights and Forecast - by Product Type
- 9. South America Rubber Process Oil Industry Analysis, Insights and Forecast, 2019-2031
- 9.1. Market Analysis, Insights and Forecast - by Product Type
- 9.1.1. Aromatic
- 9.1.2. Paraffinic
- 9.1.3. Naphthenic
- 9.2. Market Analysis, Insights and Forecast - by Application
- 9.2.1. Tire and Automobile Components
- 9.2.2. Footwear
- 9.2.3. Consumer Goods
- 9.2.4. Other Applications
- 9.1. Market Analysis, Insights and Forecast - by Product Type
- 10. Middle East and Africa Rubber Process Oil Industry Analysis, Insights and Forecast, 2019-2031
- 10.1. Market Analysis, Insights and Forecast - by Product Type
- 10.1.1. Aromatic
- 10.1.2. Paraffinic
- 10.1.3. Naphthenic
- 10.2. Market Analysis, Insights and Forecast - by Application
- 10.2.1. Tire and Automobile Components
- 10.2.2. Footwear
- 10.2.3. Consumer Goods
- 10.2.4. Other Applications
- 10.1. Market Analysis, Insights and Forecast - by Product Type
- 11. Asia Pacific Rubber Process Oil Industry Analysis, Insights and Forecast, 2019-2031
- 11.1. Market Analysis, Insights and Forecast - By Country/Sub-region
- 11.1.1 China
- 11.1.2 India
- 11.1.3 Japan
- 11.1.4 South Korea
- 11.1.5 Rest of Asia Pacific
- 12. North America Rubber Process Oil Industry Analysis, Insights and Forecast, 2019-2031
- 12.1. Market Analysis, Insights and Forecast - By Country/Sub-region
- 12.1.1 United States
- 12.1.2 Canada
- 12.1.3 Mexico
- 13. Europe Rubber Process Oil Industry Analysis, Insights and Forecast, 2019-2031
- 13.1. Market Analysis, Insights and Forecast - By Country/Sub-region
- 13.1.1 Germany
- 13.1.2 United Kingdom
- 13.1.3 France
- 13.1.4 Italy
- 13.1.5 Rest of Europe
- 14. South America Rubber Process Oil Industry Analysis, Insights and Forecast, 2019-2031
- 14.1. Market Analysis, Insights and Forecast - By Country/Sub-region
- 14.1.1 Brazil
- 14.1.2 Argentina
- 14.1.3 Rest of South America
- 15. Middle East and Africa Rubber Process Oil Industry Analysis, Insights and Forecast, 2019-2031
- 15.1. Market Analysis, Insights and Forecast - By Country/Sub-region
- 15.1.1 Saudi Arabia
- 15.1.2 South Africa
- 15.1.3 Rest of Middle East and Africa
- 16. Competitive Analysis
- 16.1. Global Market Share Analysis 2024
- 16.2. Company Profiles
- 16.2.1 APAR Industries
- 16.2.1.1. Overview
- 16.2.1.2. Products
- 16.2.1.3. SWOT Analysis
- 16.2.1.4. Recent Developments
- 16.2.1.5. Financials (Based on Availability)
- 16.2.2 ORGKHIM Biochemical Holding
- 16.2.2.1. Overview
- 16.2.2.2. Products
- 16.2.2.3. SWOT Analysis
- 16.2.2.4. Recent Developments
- 16.2.2.5. Financials (Based on Availability)
- 16.2.3 Exxon Mobil Corporation
- 16.2.3.1. Overview
- 16.2.3.2. Products
- 16.2.3.3. SWOT Analysis
- 16.2.3.4. Recent Developments
- 16.2.3.5. Financials (Based on Availability)
- 16.2.4 Sterlite Lubricants
- 16.2.4.1. Overview
- 16.2.4.2. Products
- 16.2.4.3. SWOT Analysis
- 16.2.4.4. Recent Developments
- 16.2.4.5. Financials (Based on Availability)
- 16.2.5 EaglePetrochem
- 16.2.5.1. Overview
- 16.2.5.2. Products
- 16.2.5.3. SWOT Analysis
- 16.2.5.4. Recent Developments
- 16.2.5.5. Financials (Based on Availability)
- 16.2.6 Repsol
- 16.2.6.1. Overview
- 16.2.6.2. Products
- 16.2.6.3. SWOT Analysis
- 16.2.6.4. Recent Developments
- 16.2.6.5. Financials (Based on Availability)
- 16.2.7 LODHA Petro
- 16.2.7.1. Overview
- 16.2.7.2. Products
- 16.2.7.3. SWOT Analysis
- 16.2.7.4. Recent Developments
- 16.2.7.5. Financials (Based on Availability)
- 16.2.8 Chevron Corporation
- 16.2.8.1. Overview
- 16.2.8.2. Products
- 16.2.8.3. SWOT Analysis
- 16.2.8.4. Recent Developments
- 16.2.8.5. Financials (Based on Availability)
- 16.2.9 Witmans Industries Pvt Ltd*List Not Exhaustive
- 16.2.9.1. Overview
- 16.2.9.2. Products
- 16.2.9.3. SWOT Analysis
- 16.2.9.4. Recent Developments
- 16.2.9.5. Financials (Based on Availability)
- 16.2.10 TotalEnergies
- 16.2.10.1. Overview
- 16.2.10.2. Products
- 16.2.10.3. SWOT Analysis
- 16.2.10.4. Recent Developments
- 16.2.10.5. Financials (Based on Availability)
- 16.2.11 HF Sinclair Corporation
- 16.2.11.1. Overview
- 16.2.11.2. Products
- 16.2.11.3. SWOT Analysis
- 16.2.11.4. Recent Developments
- 16.2.11.5. Financials (Based on Availability)
- 16.2.12 Panama Petrochem Ltd
- 16.2.12.1. Overview
- 16.2.12.2. Products
- 16.2.12.3. SWOT Analysis
- 16.2.12.4. Recent Developments
- 16.2.12.5. Financials (Based on Availability)
- 16.2.13 CPC Corporation
- 16.2.13.1. Overview
- 16.2.13.2. Products
- 16.2.13.3. SWOT Analysis
- 16.2.13.4. Recent Developments
- 16.2.13.5. Financials (Based on Availability)
- 16.2.1 APAR Industries
List of Figures
- Figure 1: Global Rubber Process Oil Industry Revenue Breakdown (Million, %) by Region 2024 & 2032
- Figure 2: Global Rubber Process Oil Industry Volume Breakdown (Million, %) by Region 2024 & 2032
- Figure 3: Asia Pacific Rubber Process Oil Industry Revenue (Million), by Country 2024 & 2032
- Figure 4: Asia Pacific Rubber Process Oil Industry Volume (Million), by Country 2024 & 2032
- Figure 5: Asia Pacific Rubber Process Oil Industry Revenue Share (%), by Country 2024 & 2032
- Figure 6: Asia Pacific Rubber Process Oil Industry Volume Share (%), by Country 2024 & 2032
- Figure 7: North America Rubber Process Oil Industry Revenue (Million), by Country 2024 & 2032
- Figure 8: North America Rubber Process Oil Industry Volume (Million), by Country 2024 & 2032
- Figure 9: North America Rubber Process Oil Industry Revenue Share (%), by Country 2024 & 2032
- Figure 10: North America Rubber Process Oil Industry Volume Share (%), by Country 2024 & 2032
- Figure 11: Europe Rubber Process Oil Industry Revenue (Million), by Country 2024 & 2032
- Figure 12: Europe Rubber Process Oil Industry Volume (Million), by Country 2024 & 2032
- Figure 13: Europe Rubber Process Oil Industry Revenue Share (%), by Country 2024 & 2032
- Figure 14: Europe Rubber Process Oil Industry Volume Share (%), by Country 2024 & 2032
- Figure 15: South America Rubber Process Oil Industry Revenue (Million), by Country 2024 & 2032
- Figure 16: South America Rubber Process Oil Industry Volume (Million), by Country 2024 & 2032
- Figure 17: South America Rubber Process Oil Industry Revenue Share (%), by Country 2024 & 2032
- Figure 18: South America Rubber Process Oil Industry Volume Share (%), by Country 2024 & 2032
- Figure 19: Middle East and Africa Rubber Process Oil Industry Revenue (Million), by Country 2024 & 2032
- Figure 20: Middle East and Africa Rubber Process Oil Industry Volume (Million), by Country 2024 & 2032
- Figure 21: Middle East and Africa Rubber Process Oil Industry Revenue Share (%), by Country 2024 & 2032
- Figure 22: Middle East and Africa Rubber Process Oil Industry Volume Share (%), by Country 2024 & 2032
- Figure 23: Asia Pacific Rubber Process Oil Industry Revenue (Million), by Product Type 2024 & 2032
- Figure 24: Asia Pacific Rubber Process Oil Industry Volume (Million), by Product Type 2024 & 2032
- Figure 25: Asia Pacific Rubber Process Oil Industry Revenue Share (%), by Product Type 2024 & 2032
- Figure 26: Asia Pacific Rubber Process Oil Industry Volume Share (%), by Product Type 2024 & 2032
- Figure 27: Asia Pacific Rubber Process Oil Industry Revenue (Million), by Application 2024 & 2032
- Figure 28: Asia Pacific Rubber Process Oil Industry Volume (Million), by Application 2024 & 2032
- Figure 29: Asia Pacific Rubber Process Oil Industry Revenue Share (%), by Application 2024 & 2032
- Figure 30: Asia Pacific Rubber Process Oil Industry Volume Share (%), by Application 2024 & 2032
- Figure 31: Asia Pacific Rubber Process Oil Industry Revenue (Million), by Country 2024 & 2032
- Figure 32: Asia Pacific Rubber Process Oil Industry Volume (Million), by Country 2024 & 2032
- Figure 33: Asia Pacific Rubber Process Oil Industry Revenue Share (%), by Country 2024 & 2032
- Figure 34: Asia Pacific Rubber Process Oil Industry Volume Share (%), by Country 2024 & 2032
- Figure 35: North America Rubber Process Oil Industry Revenue (Million), by Product Type 2024 & 2032
- Figure 36: North America Rubber Process Oil Industry Volume (Million), by Product Type 2024 & 2032
- Figure 37: North America Rubber Process Oil Industry Revenue Share (%), by Product Type 2024 & 2032
- Figure 38: North America Rubber Process Oil Industry Volume Share (%), by Product Type 2024 & 2032
- Figure 39: North America Rubber Process Oil Industry Revenue (Million), by Application 2024 & 2032
- Figure 40: North America Rubber Process Oil Industry Volume (Million), by Application 2024 & 2032
- Figure 41: North America Rubber Process Oil Industry Revenue Share (%), by Application 2024 & 2032
- Figure 42: North America Rubber Process Oil Industry Volume Share (%), by Application 2024 & 2032
- Figure 43: North America Rubber Process Oil Industry Revenue (Million), by Country 2024 & 2032
- Figure 44: North America Rubber Process Oil Industry Volume (Million), by Country 2024 & 2032
- Figure 45: North America Rubber Process Oil Industry Revenue Share (%), by Country 2024 & 2032
- Figure 46: North America Rubber Process Oil Industry Volume Share (%), by Country 2024 & 2032
- Figure 47: Europe Rubber Process Oil Industry Revenue (Million), by Product Type 2024 & 2032
- Figure 48: Europe Rubber Process Oil Industry Volume (Million), by Product Type 2024 & 2032
- Figure 49: Europe Rubber Process Oil Industry Revenue Share (%), by Product Type 2024 & 2032
- Figure 50: Europe Rubber Process Oil Industry Volume Share (%), by Product Type 2024 & 2032
- Figure 51: Europe Rubber Process Oil Industry Revenue (Million), by Application 2024 & 2032
- Figure 52: Europe Rubber Process Oil Industry Volume (Million), by Application 2024 & 2032
- Figure 53: Europe Rubber Process Oil Industry Revenue Share (%), by Application 2024 & 2032
- Figure 54: Europe Rubber Process Oil Industry Volume Share (%), by Application 2024 & 2032
- Figure 55: Europe Rubber Process Oil Industry Revenue (Million), by Country 2024 & 2032
- Figure 56: Europe Rubber Process Oil Industry Volume (Million), by Country 2024 & 2032
- Figure 57: Europe Rubber Process Oil Industry Revenue Share (%), by Country 2024 & 2032
- Figure 58: Europe Rubber Process Oil Industry Volume Share (%), by Country 2024 & 2032
- Figure 59: South America Rubber Process Oil Industry Revenue (Million), by Product Type 2024 & 2032
- Figure 60: South America Rubber Process Oil Industry Volume (Million), by Product Type 2024 & 2032
- Figure 61: South America Rubber Process Oil Industry Revenue Share (%), by Product Type 2024 & 2032
- Figure 62: South America Rubber Process Oil Industry Volume Share (%), by Product Type 2024 & 2032
- Figure 63: South America Rubber Process Oil Industry Revenue (Million), by Application 2024 & 2032
- Figure 64: South America Rubber Process Oil Industry Volume (Million), by Application 2024 & 2032
- Figure 65: South America Rubber Process Oil Industry Revenue Share (%), by Application 2024 & 2032
- Figure 66: South America Rubber Process Oil Industry Volume Share (%), by Application 2024 & 2032
- Figure 67: South America Rubber Process Oil Industry Revenue (Million), by Country 2024 & 2032
- Figure 68: South America Rubber Process Oil Industry Volume (Million), by Country 2024 & 2032
- Figure 69: South America Rubber Process Oil Industry Revenue Share (%), by Country 2024 & 2032
- Figure 70: South America Rubber Process Oil Industry Volume Share (%), by Country 2024 & 2032
- Figure 71: Middle East and Africa Rubber Process Oil Industry Revenue (Million), by Product Type 2024 & 2032
- Figure 72: Middle East and Africa Rubber Process Oil Industry Volume (Million), by Product Type 2024 & 2032
- Figure 73: Middle East and Africa Rubber Process Oil Industry Revenue Share (%), by Product Type 2024 & 2032
- Figure 74: Middle East and Africa Rubber Process Oil Industry Volume Share (%), by Product Type 2024 & 2032
- Figure 75: Middle East and Africa Rubber Process Oil Industry Revenue (Million), by Application 2024 & 2032
- Figure 76: Middle East and Africa Rubber Process Oil Industry Volume (Million), by Application 2024 & 2032
- Figure 77: Middle East and Africa Rubber Process Oil Industry Revenue Share (%), by Application 2024 & 2032
- Figure 78: Middle East and Africa Rubber Process Oil Industry Volume Share (%), by Application 2024 & 2032
- Figure 79: Middle East and Africa Rubber Process Oil Industry Revenue (Million), by Country 2024 & 2032
- Figure 80: Middle East and Africa Rubber Process Oil Industry Volume (Million), by Country 2024 & 2032
- Figure 81: Middle East and Africa Rubber Process Oil Industry Revenue Share (%), by Country 2024 & 2032
- Figure 82: Middle East and Africa Rubber Process Oil Industry Volume Share (%), by Country 2024 & 2032
List of Tables
- Table 1: Global Rubber Process Oil Industry Revenue Million Forecast, by Region 2019 & 2032
- Table 2: Global Rubber Process Oil Industry Volume Million Forecast, by Region 2019 & 2032
- Table 3: Global Rubber Process Oil Industry Revenue Million Forecast, by Product Type 2019 & 2032
- Table 4: Global Rubber Process Oil Industry Volume Million Forecast, by Product Type 2019 & 2032
- Table 5: Global Rubber Process Oil Industry Revenue Million Forecast, by Application 2019 & 2032
- Table 6: Global Rubber Process Oil Industry Volume Million Forecast, by Application 2019 & 2032
- Table 7: Global Rubber Process Oil Industry Revenue Million Forecast, by Region 2019 & 2032
- Table 8: Global Rubber Process Oil Industry Volume Million Forecast, by Region 2019 & 2032
- Table 9: Global Rubber Process Oil Industry Revenue Million Forecast, by Country 2019 & 2032
- Table 10: Global Rubber Process Oil Industry Volume Million Forecast, by Country 2019 & 2032
- Table 11: China Rubber Process Oil Industry Revenue (Million) Forecast, by Application 2019 & 2032
- Table 12: China Rubber Process Oil Industry Volume (Million) Forecast, by Application 2019 & 2032
- Table 13: India Rubber Process Oil Industry Revenue (Million) Forecast, by Application 2019 & 2032
- Table 14: India Rubber Process Oil Industry Volume (Million) Forecast, by Application 2019 & 2032
- Table 15: Japan Rubber Process Oil Industry Revenue (Million) Forecast, by Application 2019 & 2032
- Table 16: Japan Rubber Process Oil Industry Volume (Million) Forecast, by Application 2019 & 2032
- Table 17: South Korea Rubber Process Oil Industry Revenue (Million) Forecast, by Application 2019 & 2032
- Table 18: South Korea Rubber Process Oil Industry Volume (Million) Forecast, by Application 2019 & 2032
- Table 19: Rest of Asia Pacific Rubber Process Oil Industry Revenue (Million) Forecast, by Application 2019 & 2032
- Table 20: Rest of Asia Pacific Rubber Process Oil Industry Volume (Million) Forecast, by Application 2019 & 2032
- Table 21: Global Rubber Process Oil Industry Revenue Million Forecast, by Country 2019 & 2032
- Table 22: Global Rubber Process Oil Industry Volume Million Forecast, by Country 2019 & 2032
- Table 23: United States Rubber Process Oil Industry Revenue (Million) Forecast, by Application 2019 & 2032
- Table 24: United States Rubber Process Oil Industry Volume (Million) Forecast, by Application 2019 & 2032
- Table 25: Canada Rubber Process Oil Industry Revenue (Million) Forecast, by Application 2019 & 2032
- Table 26: Canada Rubber Process Oil Industry Volume (Million) Forecast, by Application 2019 & 2032
- Table 27: Mexico Rubber Process Oil Industry Revenue (Million) Forecast, by Application 2019 & 2032
- Table 28: Mexico Rubber Process Oil Industry Volume (Million) Forecast, by Application 2019 & 2032
- Table 29: Global Rubber Process Oil Industry Revenue Million Forecast, by Country 2019 & 2032
- Table 30: Global Rubber Process Oil Industry Volume Million Forecast, by Country 2019 & 2032
- Table 31: Germany Rubber Process Oil Industry Revenue (Million) Forecast, by Application 2019 & 2032
- Table 32: Germany Rubber Process Oil Industry Volume (Million) Forecast, by Application 2019 & 2032
- Table 33: United Kingdom Rubber Process Oil Industry Revenue (Million) Forecast, by Application 2019 & 2032
- Table 34: United Kingdom Rubber Process Oil Industry Volume (Million) Forecast, by Application 2019 & 2032
- Table 35: France Rubber Process Oil Industry Revenue (Million) Forecast, by Application 2019 & 2032
- Table 36: France Rubber Process Oil Industry Volume (Million) Forecast, by Application 2019 & 2032
- Table 37: Italy Rubber Process Oil Industry Revenue (Million) Forecast, by Application 2019 & 2032
- Table 38: Italy Rubber Process Oil Industry Volume (Million) Forecast, by Application 2019 & 2032
- Table 39: Rest of Europe Rubber Process Oil Industry Revenue (Million) Forecast, by Application 2019 & 2032
- Table 40: Rest of Europe Rubber Process Oil Industry Volume (Million) Forecast, by Application 2019 & 2032
- Table 41: Global Rubber Process Oil Industry Revenue Million Forecast, by Country 2019 & 2032
- Table 42: Global Rubber Process Oil Industry Volume Million Forecast, by Country 2019 & 2032
- Table 43: Brazil Rubber Process Oil Industry Revenue (Million) Forecast, by Application 2019 & 2032
- Table 44: Brazil Rubber Process Oil Industry Volume (Million) Forecast, by Application 2019 & 2032
- Table 45: Argentina Rubber Process Oil Industry Revenue (Million) Forecast, by Application 2019 & 2032
- Table 46: Argentina Rubber Process Oil Industry Volume (Million) Forecast, by Application 2019 & 2032
- Table 47: Rest of South America Rubber Process Oil Industry Revenue (Million) Forecast, by Application 2019 & 2032
- Table 48: Rest of South America Rubber Process Oil Industry Volume (Million) Forecast, by Application 2019 & 2032
- Table 49: Global Rubber Process Oil Industry Revenue Million Forecast, by Country 2019 & 2032
- Table 50: Global Rubber Process Oil Industry Volume Million Forecast, by Country 2019 & 2032
- Table 51: Saudi Arabia Rubber Process Oil Industry Revenue (Million) Forecast, by Application 2019 & 2032
- Table 52: Saudi Arabia Rubber Process Oil Industry Volume (Million) Forecast, by Application 2019 & 2032
- Table 53: South Africa Rubber Process Oil Industry Revenue (Million) Forecast, by Application 2019 & 2032
- Table 54: South Africa Rubber Process Oil Industry Volume (Million) Forecast, by Application 2019 & 2032
- Table 55: Rest of Middle East and Africa Rubber Process Oil Industry Revenue (Million) Forecast, by Application 2019 & 2032
- Table 56: Rest of Middle East and Africa Rubber Process Oil Industry Volume (Million) Forecast, by Application 2019 & 2032
- Table 57: Global Rubber Process Oil Industry Revenue Million Forecast, by Product Type 2019 & 2032
- Table 58: Global Rubber Process Oil Industry Volume Million Forecast, by Product Type 2019 & 2032
- Table 59: Global Rubber Process Oil Industry Revenue Million Forecast, by Application 2019 & 2032
- Table 60: Global Rubber Process Oil Industry Volume Million Forecast, by Application 2019 & 2032
- Table 61: Global Rubber Process Oil Industry Revenue Million Forecast, by Country 2019 & 2032
- Table 62: Global Rubber Process Oil Industry Volume Million Forecast, by Country 2019 & 2032
- Table 63: China Rubber Process Oil Industry Revenue (Million) Forecast, by Application 2019 & 2032
- Table 64: China Rubber Process Oil Industry Volume (Million) Forecast, by Application 2019 & 2032
- Table 65: India Rubber Process Oil Industry Revenue (Million) Forecast, by Application 2019 & 2032
- Table 66: India Rubber Process Oil Industry Volume (Million) Forecast, by Application 2019 & 2032
- Table 67: Japan Rubber Process Oil Industry Revenue (Million) Forecast, by Application 2019 & 2032
- Table 68: Japan Rubber Process Oil Industry Volume (Million) Forecast, by Application 2019 & 2032
- Table 69: South Korea Rubber Process Oil Industry Revenue (Million) Forecast, by Application 2019 & 2032
- Table 70: South Korea Rubber Process Oil Industry Volume (Million) Forecast, by Application 2019 & 2032
- Table 71: Rest of Asia Pacific Rubber Process Oil Industry Revenue (Million) Forecast, by Application 2019 & 2032
- Table 72: Rest of Asia Pacific Rubber Process Oil Industry Volume (Million) Forecast, by Application 2019 & 2032
- Table 73: Global Rubber Process Oil Industry Revenue Million Forecast, by Product Type 2019 & 2032
- Table 74: Global Rubber Process Oil Industry Volume Million Forecast, by Product Type 2019 & 2032
- Table 75: Global Rubber Process Oil Industry Revenue Million Forecast, by Application 2019 & 2032
- Table 76: Global Rubber Process Oil Industry Volume Million Forecast, by Application 2019 & 2032
- Table 77: Global Rubber Process Oil Industry Revenue Million Forecast, by Country 2019 & 2032
- Table 78: Global Rubber Process Oil Industry Volume Million Forecast, by Country 2019 & 2032
- Table 79: United States Rubber Process Oil Industry Revenue (Million) Forecast, by Application 2019 & 2032
- Table 80: United States Rubber Process Oil Industry Volume (Million) Forecast, by Application 2019 & 2032
- Table 81: Canada Rubber Process Oil Industry Revenue (Million) Forecast, by Application 2019 & 2032
- Table 82: Canada Rubber Process Oil Industry Volume (Million) Forecast, by Application 2019 & 2032
- Table 83: Mexico Rubber Process Oil Industry Revenue (Million) Forecast, by Application 2019 & 2032
- Table 84: Mexico Rubber Process Oil Industry Volume (Million) Forecast, by Application 2019 & 2032
- Table 85: Global Rubber Process Oil Industry Revenue Million Forecast, by Product Type 2019 & 2032
- Table 86: Global Rubber Process Oil Industry Volume Million Forecast, by Product Type 2019 & 2032
- Table 87: Global Rubber Process Oil Industry Revenue Million Forecast, by Application 2019 & 2032
- Table 88: Global Rubber Process Oil Industry Volume Million Forecast, by Application 2019 & 2032
- Table 89: Global Rubber Process Oil Industry Revenue Million Forecast, by Country 2019 & 2032
- Table 90: Global Rubber Process Oil Industry Volume Million Forecast, by Country 2019 & 2032
- Table 91: Germany Rubber Process Oil Industry Revenue (Million) Forecast, by Application 2019 & 2032
- Table 92: Germany Rubber Process Oil Industry Volume (Million) Forecast, by Application 2019 & 2032
- Table 93: United Kingdom Rubber Process Oil Industry Revenue (Million) Forecast, by Application 2019 & 2032
- Table 94: United Kingdom Rubber Process Oil Industry Volume (Million) Forecast, by Application 2019 & 2032
- Table 95: France Rubber Process Oil Industry Revenue (Million) Forecast, by Application 2019 & 2032
- Table 96: France Rubber Process Oil Industry Volume (Million) Forecast, by Application 2019 & 2032
- Table 97: Italy Rubber Process Oil Industry Revenue (Million) Forecast, by Application 2019 & 2032
- Table 98: Italy Rubber Process Oil Industry Volume (Million) Forecast, by Application 2019 & 2032
- Table 99: Rest of Europe Rubber Process Oil Industry Revenue (Million) Forecast, by Application 2019 & 2032
- Table 100: Rest of Europe Rubber Process Oil Industry Volume (Million) Forecast, by Application 2019 & 2032
- Table 101: Global Rubber Process Oil Industry Revenue Million Forecast, by Product Type 2019 & 2032
- Table 102: Global Rubber Process Oil Industry Volume Million Forecast, by Product Type 2019 & 2032
- Table 103: Global Rubber Process Oil Industry Revenue Million Forecast, by Application 2019 & 2032
- Table 104: Global Rubber Process Oil Industry Volume Million Forecast, by Application 2019 & 2032
- Table 105: Global Rubber Process Oil Industry Revenue Million Forecast, by Country 2019 & 2032
- Table 106: Global Rubber Process Oil Industry Volume Million Forecast, by Country 2019 & 2032
- Table 107: Brazil Rubber Process Oil Industry Revenue (Million) Forecast, by Application 2019 & 2032
- Table 108: Brazil Rubber Process Oil Industry Volume (Million) Forecast, by Application 2019 & 2032
- Table 109: Argentina Rubber Process Oil Industry Revenue (Million) Forecast, by Application 2019 & 2032
- Table 110: Argentina Rubber Process Oil Industry Volume (Million) Forecast, by Application 2019 & 2032
- Table 111: Rest of South America Rubber Process Oil Industry Revenue (Million) Forecast, by Application 2019 & 2032
- Table 112: Rest of South America Rubber Process Oil Industry Volume (Million) Forecast, by Application 2019 & 2032
- Table 113: Global Rubber Process Oil Industry Revenue Million Forecast, by Product Type 2019 & 2032
- Table 114: Global Rubber Process Oil Industry Volume Million Forecast, by Product Type 2019 & 2032
- Table 115: Global Rubber Process Oil Industry Revenue Million Forecast, by Application 2019 & 2032
- Table 116: Global Rubber Process Oil Industry Volume Million Forecast, by Application 2019 & 2032
- Table 117: Global Rubber Process Oil Industry Revenue Million Forecast, by Country 2019 & 2032
- Table 118: Global Rubber Process Oil Industry Volume Million Forecast, by Country 2019 & 2032
- Table 119: Saudi Arabia Rubber Process Oil Industry Revenue (Million) Forecast, by Application 2019 & 2032
- Table 120: Saudi Arabia Rubber Process Oil Industry Volume (Million) Forecast, by Application 2019 & 2032
- Table 121: South Africa Rubber Process Oil Industry Revenue (Million) Forecast, by Application 2019 & 2032
- Table 122: South Africa Rubber Process Oil Industry Volume (Million) Forecast, by Application 2019 & 2032
- Table 123: Rest of Middle East and Africa Rubber Process Oil Industry Revenue (Million) Forecast, by Application 2019 & 2032
- Table 124: Rest of Middle East and Africa Rubber Process Oil Industry Volume (Million) Forecast, by Application 2019 & 2032
Frequently Asked Questions
1. What is the projected Compound Annual Growth Rate (CAGR) of the Rubber Process Oil Industry?
The projected CAGR is approximately 2.93%.
2. Which companies are prominent players in the Rubber Process Oil Industry?
Key companies in the market include APAR Industries, ORGKHIM Biochemical Holding, Exxon Mobil Corporation, Sterlite Lubricants, EaglePetrochem, Repsol, LODHA Petro, Chevron Corporation, Witmans Industries Pvt Ltd*List Not Exhaustive, TotalEnergies, HF Sinclair Corporation, Panama Petrochem Ltd, CPC Corporation.
3. What are the main segments of the Rubber Process Oil Industry?
The market segments include Product Type, Application.
4. Can you provide details about the market size?
The market size is estimated to be USD XX Million as of 2022.
5. What are some drivers contributing to market growth?
Increasing Demand for Tire and Automotive Components; Growing Demand for Footwear; Others.
6. What are the notable trends driving market growth?
Growing Demand of Rubber Process Oil from Tire and Automobile Components.
7. Are there any restraints impacting market growth?
Volatility in Raw Material Price; Other Restraints.
8. Can you provide examples of recent developments in the market?
N/A
9. What pricing options are available for accessing the report?
Pricing options include single-user, multi-user, and enterprise licenses priced at USD 4750, USD 5250, and USD 8750 respectively.
10. Is the market size provided in terms of value or volume?
The market size is provided in terms of value, measured in Million and volume, measured in Million.
11. Are there any specific market keywords associated with the report?
Yes, the market keyword associated with the report is "Rubber Process Oil Industry," which aids in identifying and referencing the specific market segment covered.
12. How do I determine which pricing option suits my needs best?
The pricing options vary based on user requirements and access needs. Individual users may opt for single-user licenses, while businesses requiring broader access may choose multi-user or enterprise licenses for cost-effective access to the report.
13. Are there any additional resources or data provided in the Rubber Process Oil Industry report?
While the report offers comprehensive insights, it's advisable to review the specific contents or supplementary materials provided to ascertain if additional resources or data are available.
14. How can I stay updated on further developments or reports in the Rubber Process Oil Industry?
To stay informed about further developments, trends, and reports in the Rubber Process Oil Industry, consider subscribing to industry newsletters, following relevant companies and organizations, or regularly checking reputable industry news sources and publications.
Methodology
Step 1 - Identification of Relevant Samples Size from Population Database


Step 2 - Approaches for Defining Global Market Size (Value, Volume* & Price*)

Note*: In applicable scenarios
Step 3 - Data Sources
Primary Research
- Web Analytics
- Survey Reports
- Research Institute
- Latest Research Reports
- Opinion Leaders
Secondary Research
- Annual Reports
- White Paper
- Latest Press Release
- Industry Association
- Paid Database
- Investor Presentations

Step 4 - Data Triangulation
Involves using different sources of information in order to increase the validity of a study
These sources are likely to be stakeholders in a program - participants, other researchers, program staff, other community members, and so on.
Then we put all data in single framework & apply various statistical tools to find out the dynamic on the market.
During the analysis stage, feedback from the stakeholder groups would be compared to determine areas of agreement as well as areas of divergence


