
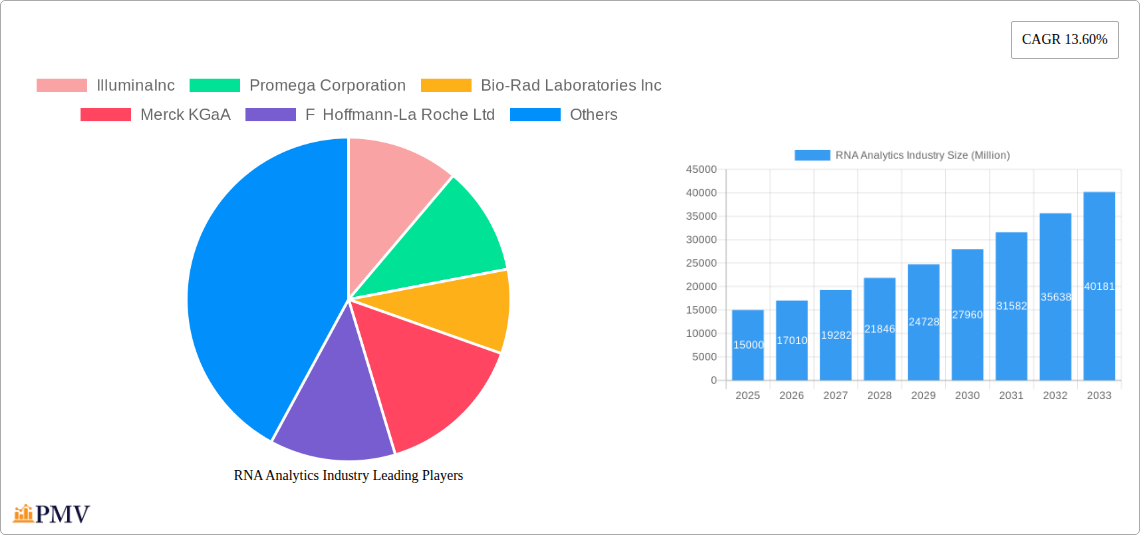
Key Insights
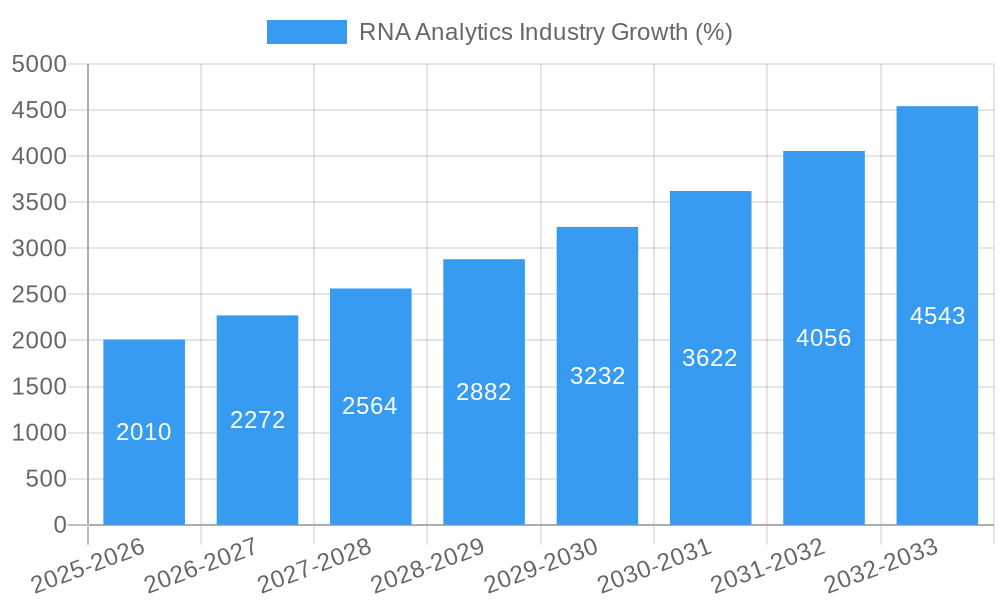
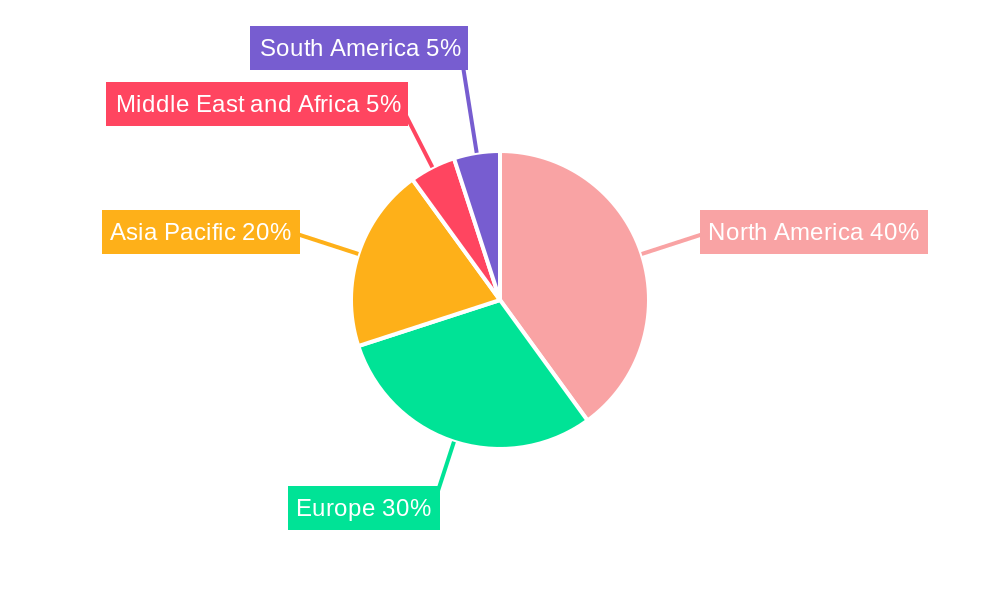
The RNA analytics market is experiencing robust growth, driven by advancements in sequencing technologies, the increasing understanding of RNA's role in various biological processes, and the expanding applications in clinical diagnostics and drug discovery. The market's Compound Annual Growth Rate (CAGR) of 13.60% from 2019 to 2024 indicates a significant upward trajectory, projected to continue into the forecast period (2025-2033). Key market segments include reagents/consumables, instruments, and various technologies like microarrays, sequencing, and PCR. The clinical diagnostics application segment is a major driver, fueled by the rising prevalence of chronic diseases and the need for accurate and rapid diagnostics. Drug discovery and toxicogenomics are also significant application areas, leveraging RNA analysis for target identification and toxicity assessment. Leading companies like Illumina, Promega, Bio-Rad, and Thermo Fisher Scientific are actively contributing to market expansion through technological innovation and strategic partnerships. Geographic distribution shows North America and Europe currently holding substantial market shares, but the Asia-Pacific region is poised for significant growth owing to expanding research infrastructure and increasing healthcare spending.
The competitive landscape is characterized by both large multinational corporations and specialized smaller companies. The market's future growth will depend on factors such as ongoing technological advancements, regulatory approvals for new diagnostic tools, increasing research funding in genomics and transcriptomics, and the growing adoption of personalized medicine approaches. Continued innovation in areas like single-cell RNA sequencing and spatial transcriptomics will further fuel market expansion, creating opportunities for companies providing advanced analytical tools and services. While challenges remain, such as the high cost of advanced technologies and the need for skilled professionals, the overall outlook for the RNA analytics market remains exceptionally positive, promising significant growth and transformative advancements in healthcare and life sciences over the coming decade.
This comprehensive report provides an in-depth analysis of the RNA Analytics industry, offering invaluable insights for stakeholders seeking to understand market dynamics, competitive landscapes, and future growth potential. Covering the period from 2019 to 2033, with a focus on 2025, this report is crucial for strategic decision-making. The study period is 2019-2033, with the base year being 2025 and the forecast period spanning 2025-2033. The historical period analyzed is 2019-2024. The report encompasses key segments, including By Product Type (Reagents/Consumables, Instruments, Other Product Types), By Technology (Microarrays, Sequencing, Polymerase Chain Reaction (PCR), Others), By Application (Clinical Diagnostics, Drug Discovery, Toxicogenomic, Other Applications), and By End User (Pharmaceutical & Biotechnology Companies, Hospitals and Diagnostic Centers, Others). Leading players like Illumina Inc, Promega Corporation, Bio-Rad Laboratories Inc, Merck KGaA, F Hoffmann-La Roche Ltd, Eurofins Scientific, Agilent Technologies Inc, LC Sciences, GenXPro GmbH, BioMérieux SA, Thermo Fisher Scientific, and QIAGEN are thoroughly analyzed.
RNA Analytics Industry Market Structure & Competitive Dynamics
The RNA analytics market exhibits a moderately concentrated structure, with a few dominant players commanding significant market share. Illumina Inc, Thermo Fisher Scientific, and QIAGEN collectively hold an estimated xx% market share in 2025, reflecting their strong brand recognition, extensive product portfolios, and robust distribution networks. The market is characterized by intense competition, driven by continuous technological advancements and the emergence of innovative solutions. Innovation ecosystems play a crucial role, with significant investments in R&D shaping the competitive landscape. Stringent regulatory frameworks, particularly in the clinical diagnostics segment, influence product development and market entry. While no direct substitutes exist, alternative technologies like PCR and microarrays compete for market share within specific applications. End-user trends are shifting toward personalized medicine and point-of-care diagnostics, fostering demand for smaller, more efficient RNA analytics solutions. M&A activity has been relatively moderate in recent years, with deal values averaging approximately xx Million USD annually. Key M&A activities include:
- Strategic partnerships and collaborations are also prevalent, fostering technological advancements and market expansion.
RNA Analytics Industry Industry Trends & Insights
The RNA analytics market is experiencing significant growth, projected to reach xx Million USD by 2033, exhibiting a CAGR of xx% during the forecast period (2025-2033). This growth is primarily driven by the increasing adoption of RNA-based technologies in various applications, including clinical diagnostics, drug discovery, and agricultural research. Technological disruptions, particularly advancements in next-generation sequencing (NGS) and microfluidic technologies, are accelerating market expansion. Consumer preferences are shifting towards higher throughput, cost-effective, and more user-friendly systems. The market penetration of NGS technology is increasing steadily, surpassing xx% in 2025, driven by its high sensitivity and comprehensive transcriptome profiling capabilities. The growing demand for personalized medicine is significantly influencing market dynamics. Competitive dynamics are shaped by factors such as technological innovation, pricing strategies, and regulatory approvals.
Dominant Markets & Segments in RNA Analytics Industry
The North American region is currently the dominant market for RNA analytics, driven by factors including high healthcare expenditure, strong research infrastructure, and a large number of pharmaceutical and biotechnology companies. Within the segments:
- By Product Type: Reagents/consumables constitute the largest segment, driven by the high demand for RNA extraction kits, reverse transcription reagents, and PCR master mixes. Instruments, while smaller in market size, are experiencing rapid growth due to the demand for advanced NGS systems and real-time PCR machines.
- By Technology: Sequencing is the leading technology, accounting for xx% of the total market value in 2025, followed by PCR and microarrays. The continuous advancement in sequencing technologies is driving its increased market penetration.
- By Application: Clinical diagnostics is the largest application area, propelled by the rising prevalence of various diseases and growing focus on personalized medicine. Drug discovery is another major application area, owing to the increasing use of RNA-based technologies for target identification and validation.
- By End User: Pharmaceutical and biotechnology companies are the major end-users, followed by hospitals and diagnostic centers.
Key drivers for regional dominance include robust healthcare infrastructure, favorable regulatory policies, and significant government funding for research and development.
RNA Analytics Industry Product Innovations
Recent innovations in RNA analytics include advancements in NGS platforms offering higher throughput and sensitivity, the development of microfluidic devices for miniaturized RNA analysis, and improved reagents/consumables providing better performance and efficiency. These innovations are improving the accessibility, affordability, and speed of RNA analysis, opening new avenues in research and clinical diagnostics. Furthermore, the integration of AI and machine learning in RNA sequencing data analysis is improving the accuracy and speed of data interpretation. This allows researchers to gain valuable insights from complex datasets, driving further adoption of RNA analytics technologies across various fields.
Report Segmentation & Scope
This report comprehensively segments the RNA analytics market based on product type, technology, application, and end-user. Each segment includes growth projections, market sizes (in Millions USD), and competitive dynamics analysis, providing a granular view of the market. For instance, the Reagents/Consumables segment is expected to witness robust growth fueled by the increasing adoption of RNA-based diagnostic and research applications. Similarly, the Sequencing technology segment is projected to witness high growth due to technological advancements offering higher throughput and sensitivity. The clinical diagnostics application segment is anticipated to dominate the market, propelled by the increasing incidence of various diseases, which mandates robust diagnostic tools. Finally, pharmaceutical and biotechnology companies are expected to remain the largest end-user segment due to their heavy reliance on RNA analytics for drug discovery and development.
Key Drivers of RNA Analytics Industry Growth
The RNA analytics market is propelled by several key factors. Technological advancements, particularly in NGS and microfluidic technologies, are enhancing the speed, accuracy, and cost-effectiveness of RNA analysis. The rising prevalence of chronic diseases is driving the demand for advanced diagnostic tools, increasing the adoption of RNA-based diagnostics. Government funding and initiatives supporting research and development in genomics and personalized medicine are also fueling market growth. Additionally, the expanding application of RNA analytics in various fields like drug discovery, agricultural biotechnology, and environmental monitoring is contributing to the market’s expansion.
Challenges in the RNA Analytics Industry Sector
The RNA analytics industry faces several challenges. High equipment costs and the need for specialized expertise can limit accessibility, particularly for smaller research institutions and healthcare facilities. Stringent regulatory requirements for clinical diagnostic applications pose significant hurdles for new market entrants. Supply chain disruptions and the volatility of raw material prices can affect the cost of reagents and consumables. Furthermore, intense competition among established players and the emergence of new technologies necessitate continuous innovation and strategic adaptation to maintain a competitive edge.
Leading Players in the RNA Analytics Industry Market
- Illumina Inc
- Promega Corporation
- Bio-Rad Laboratories Inc
- Merck KGaA
- F Hoffmann-La Roche Ltd
- Eurofins Scientific
- Agilent Technologies Inc
- LC Sciences
- GenXPro GmbH
- BioMérieux SA
- Thermo Fisher Scientific
- QIAGEN
Key Developments in RNA Analytics Industry Sector
- June 2022: Bio-Rad Laboratories, Inc. launched the SEQuoia Express Stranded RNA Library Prep Kit, streamlining RNA-Sequencing workflows. This launch enhanced the efficiency and accessibility of RNA sequencing, potentially boosting market adoption.
- February 2022: eRNA signed a research agreement with Merck KGaA to advance mRNA design and LNP delivery platforms. This collaboration highlights the growing interest in mRNA-based therapies and the potential for RNA analytics to play a crucial role in their development.
Strategic RNA Analytics Industry Market Outlook
The RNA analytics market is poised for significant growth, driven by continuous technological advancements, expanding applications, and increasing investments in research and development. Strategic opportunities lie in developing innovative, cost-effective solutions, expanding into emerging markets, and fostering collaborations to accelerate the translation of RNA-based technologies into clinical practice. Focus on personalized medicine and point-of-care diagnostics will also drive future market growth. The market's future potential is immense, offering substantial rewards for companies that can effectively address the challenges and capitalize on the emerging opportunities.
RNA Analytics Industry Segmentation
-
1. Product Type
- 1.1. Reagents/Consumables
- 1.2. Instruments
- 1.3. Other Product Types
-
2. Technology
- 2.1. Microarrays
- 2.2. Sequencing
- 2.3. Polymerase Chain Reaction (PCR)
- 2.4. Others
-
3. Application
- 3.1. Clinical Diagnostics
- 3.2. Drug Discovery
- 3.3. Toxicogenomic
- 3.4. Other Applications
-
4. End User
- 4.1. Pharmaceutical & Biotechnology Companies
- 4.2. Hospitals and Diagnostic Centers
- 4.3. Others
RNA Analytics Industry Segmentation By Geography
-
1. North America
- 1.1. United States
- 1.2. Canada
- 1.3. Mexico
-
2. Europe
- 2.1. Germany
- 2.2. United Kingdom
- 2.3. France
- 2.4. Italy
- 2.5. Spain
- 2.6. Rest of Europe
-
3. Asia Pacific
- 3.1. China
- 3.2. Japan
- 3.3. India
- 3.4. Australia
- 3.5. South Korea
- 3.6. Rest of Asia Pacific
-
4. Middle East and Africa
- 4.1. GCC
- 4.2. South Africa
- 4.3. Rest of Middle East and Africa
-
5. South America
- 5.1. Brazil
- 5.2. Argentina
- 5.3. Rest of South America
RNA Analytics Industry REPORT HIGHLIGHTS
| Aspects | Details |
|---|---|
| Study Period | 2019-2033 |
| Base Year | 2024 |
| Estimated Year | 2025 |
| Forecast Period | 2025-2033 |
| Historical Period | 2019-2024 |
| Growth Rate | CAGR of 13.60% from 2019-2033 |
| Segmentation |
|
Table of Contents
- 1. Introduction
- 1.1. Research Scope
- 1.2. Market Segmentation
- 1.3. Research Methodology
- 1.4. Definitions and Assumptions
- 2. Executive Summary
- 2.1. Introduction
- 3. Market Dynamics
- 3.1. Introduction
- 3.2. Market Drivers
- 3.2.1. Rising RNA Analysis in Cancer Personalized or Precision Medicine; Growing Applications of RNA Sequencing in Transcriptomics
- 3.3. Market Restrains
- 3.3.1. High Cost Associated With Platforms; High Capital Investments for Research and Development
- 3.4. Market Trends
- 3.4.1. Reagents/Consumables Segment is Expected to Hold a Significant Share
- 4. Market Factor Analysis
- 4.1. Porters Five Forces
- 4.2. Supply/Value Chain
- 4.3. PESTEL analysis
- 4.4. Market Entropy
- 4.5. Patent/Trademark Analysis
- 5. Global RNA Analytics Industry Analysis, Insights and Forecast, 2019-2031
- 5.1. Market Analysis, Insights and Forecast - by Product Type
- 5.1.1. Reagents/Consumables
- 5.1.2. Instruments
- 5.1.3. Other Product Types
- 5.2. Market Analysis, Insights and Forecast - by Technology
- 5.2.1. Microarrays
- 5.2.2. Sequencing
- 5.2.3. Polymerase Chain Reaction (PCR)
- 5.2.4. Others
- 5.3. Market Analysis, Insights and Forecast - by Application
- 5.3.1. Clinical Diagnostics
- 5.3.2. Drug Discovery
- 5.3.3. Toxicogenomic
- 5.3.4. Other Applications
- 5.4. Market Analysis, Insights and Forecast - by End User
- 5.4.1. Pharmaceutical & Biotechnology Companies
- 5.4.2. Hospitals and Diagnostic Centers
- 5.4.3. Others
- 5.5. Market Analysis, Insights and Forecast - by Region
- 5.5.1. North America
- 5.5.2. Europe
- 5.5.3. Asia Pacific
- 5.5.4. Middle East and Africa
- 5.5.5. South America
- 5.1. Market Analysis, Insights and Forecast - by Product Type
- 6. North America RNA Analytics Industry Analysis, Insights and Forecast, 2019-2031
- 6.1. Market Analysis, Insights and Forecast - by Product Type
- 6.1.1. Reagents/Consumables
- 6.1.2. Instruments
- 6.1.3. Other Product Types
- 6.2. Market Analysis, Insights and Forecast - by Technology
- 6.2.1. Microarrays
- 6.2.2. Sequencing
- 6.2.3. Polymerase Chain Reaction (PCR)
- 6.2.4. Others
- 6.3. Market Analysis, Insights and Forecast - by Application
- 6.3.1. Clinical Diagnostics
- 6.3.2. Drug Discovery
- 6.3.3. Toxicogenomic
- 6.3.4. Other Applications
- 6.4. Market Analysis, Insights and Forecast - by End User
- 6.4.1. Pharmaceutical & Biotechnology Companies
- 6.4.2. Hospitals and Diagnostic Centers
- 6.4.3. Others
- 6.1. Market Analysis, Insights and Forecast - by Product Type
- 7. Europe RNA Analytics Industry Analysis, Insights and Forecast, 2019-2031
- 7.1. Market Analysis, Insights and Forecast - by Product Type
- 7.1.1. Reagents/Consumables
- 7.1.2. Instruments
- 7.1.3. Other Product Types
- 7.2. Market Analysis, Insights and Forecast - by Technology
- 7.2.1. Microarrays
- 7.2.2. Sequencing
- 7.2.3. Polymerase Chain Reaction (PCR)
- 7.2.4. Others
- 7.3. Market Analysis, Insights and Forecast - by Application
- 7.3.1. Clinical Diagnostics
- 7.3.2. Drug Discovery
- 7.3.3. Toxicogenomic
- 7.3.4. Other Applications
- 7.4. Market Analysis, Insights and Forecast - by End User
- 7.4.1. Pharmaceutical & Biotechnology Companies
- 7.4.2. Hospitals and Diagnostic Centers
- 7.4.3. Others
- 7.1. Market Analysis, Insights and Forecast - by Product Type
- 8. Asia Pacific RNA Analytics Industry Analysis, Insights and Forecast, 2019-2031
- 8.1. Market Analysis, Insights and Forecast - by Product Type
- 8.1.1. Reagents/Consumables
- 8.1.2. Instruments
- 8.1.3. Other Product Types
- 8.2. Market Analysis, Insights and Forecast - by Technology
- 8.2.1. Microarrays
- 8.2.2. Sequencing
- 8.2.3. Polymerase Chain Reaction (PCR)
- 8.2.4. Others
- 8.3. Market Analysis, Insights and Forecast - by Application
- 8.3.1. Clinical Diagnostics
- 8.3.2. Drug Discovery
- 8.3.3. Toxicogenomic
- 8.3.4. Other Applications
- 8.4. Market Analysis, Insights and Forecast - by End User
- 8.4.1. Pharmaceutical & Biotechnology Companies
- 8.4.2. Hospitals and Diagnostic Centers
- 8.4.3. Others
- 8.1. Market Analysis, Insights and Forecast - by Product Type
- 9. Middle East and Africa RNA Analytics Industry Analysis, Insights and Forecast, 2019-2031
- 9.1. Market Analysis, Insights and Forecast - by Product Type
- 9.1.1. Reagents/Consumables
- 9.1.2. Instruments
- 9.1.3. Other Product Types
- 9.2. Market Analysis, Insights and Forecast - by Technology
- 9.2.1. Microarrays
- 9.2.2. Sequencing
- 9.2.3. Polymerase Chain Reaction (PCR)
- 9.2.4. Others
- 9.3. Market Analysis, Insights and Forecast - by Application
- 9.3.1. Clinical Diagnostics
- 9.3.2. Drug Discovery
- 9.3.3. Toxicogenomic
- 9.3.4. Other Applications
- 9.4. Market Analysis, Insights and Forecast - by End User
- 9.4.1. Pharmaceutical & Biotechnology Companies
- 9.4.2. Hospitals and Diagnostic Centers
- 9.4.3. Others
- 9.1. Market Analysis, Insights and Forecast - by Product Type
- 10. South America RNA Analytics Industry Analysis, Insights and Forecast, 2019-2031
- 10.1. Market Analysis, Insights and Forecast - by Product Type
- 10.1.1. Reagents/Consumables
- 10.1.2. Instruments
- 10.1.3. Other Product Types
- 10.2. Market Analysis, Insights and Forecast - by Technology
- 10.2.1. Microarrays
- 10.2.2. Sequencing
- 10.2.3. Polymerase Chain Reaction (PCR)
- 10.2.4. Others
- 10.3. Market Analysis, Insights and Forecast - by Application
- 10.3.1. Clinical Diagnostics
- 10.3.2. Drug Discovery
- 10.3.3. Toxicogenomic
- 10.3.4. Other Applications
- 10.4. Market Analysis, Insights and Forecast - by End User
- 10.4.1. Pharmaceutical & Biotechnology Companies
- 10.4.2. Hospitals and Diagnostic Centers
- 10.4.3. Others
- 10.1. Market Analysis, Insights and Forecast - by Product Type
- 11. North America RNA Analytics Industry Analysis, Insights and Forecast, 2019-2031
- 11.1. Market Analysis, Insights and Forecast - By Country/Sub-region
- 11.1.1 United States
- 11.1.2 Canada
- 11.1.3 Mexico
- 12. Europe RNA Analytics Industry Analysis, Insights and Forecast, 2019-2031
- 12.1. Market Analysis, Insights and Forecast - By Country/Sub-region
- 12.1.1 Germany
- 12.1.2 United Kingdom
- 12.1.3 France
- 12.1.4 Italy
- 12.1.5 Spain
- 12.1.6 Rest of Europe
- 13. Asia Pacific RNA Analytics Industry Analysis, Insights and Forecast, 2019-2031
- 13.1. Market Analysis, Insights and Forecast - By Country/Sub-region
- 13.1.1 China
- 13.1.2 Japan
- 13.1.3 India
- 13.1.4 Australia
- 13.1.5 South Korea
- 13.1.6 Rest of Asia Pacific
- 14. Middle East and Africa RNA Analytics Industry Analysis, Insights and Forecast, 2019-2031
- 14.1. Market Analysis, Insights and Forecast - By Country/Sub-region
- 14.1.1 GCC
- 14.1.2 South Africa
- 14.1.3 Rest of Middle East and Africa
- 15. South America RNA Analytics Industry Analysis, Insights and Forecast, 2019-2031
- 15.1. Market Analysis, Insights and Forecast - By Country/Sub-region
- 15.1.1 Brazil
- 15.1.2 Argentina
- 15.1.3 Rest of South America
- 16. Competitive Analysis
- 16.1. Global Market Share Analysis 2024
- 16.2. Company Profiles
- 16.2.1 IlluminaInc
- 16.2.1.1. Overview
- 16.2.1.2. Products
- 16.2.1.3. SWOT Analysis
- 16.2.1.4. Recent Developments
- 16.2.1.5. Financials (Based on Availability)
- 16.2.2 Promega Corporation
- 16.2.2.1. Overview
- 16.2.2.2. Products
- 16.2.2.3. SWOT Analysis
- 16.2.2.4. Recent Developments
- 16.2.2.5. Financials (Based on Availability)
- 16.2.3 Bio-Rad Laboratories Inc
- 16.2.3.1. Overview
- 16.2.3.2. Products
- 16.2.3.3. SWOT Analysis
- 16.2.3.4. Recent Developments
- 16.2.3.5. Financials (Based on Availability)
- 16.2.4 Merck KGaA
- 16.2.4.1. Overview
- 16.2.4.2. Products
- 16.2.4.3. SWOT Analysis
- 16.2.4.4. Recent Developments
- 16.2.4.5. Financials (Based on Availability)
- 16.2.5 F Hoffmann-La Roche Ltd
- 16.2.5.1. Overview
- 16.2.5.2. Products
- 16.2.5.3. SWOT Analysis
- 16.2.5.4. Recent Developments
- 16.2.5.5. Financials (Based on Availability)
- 16.2.6 Eurofins Scientific
- 16.2.6.1. Overview
- 16.2.6.2. Products
- 16.2.6.3. SWOT Analysis
- 16.2.6.4. Recent Developments
- 16.2.6.5. Financials (Based on Availability)
- 16.2.7 Agilent Technologies Inc
- 16.2.7.1. Overview
- 16.2.7.2. Products
- 16.2.7.3. SWOT Analysis
- 16.2.7.4. Recent Developments
- 16.2.7.5. Financials (Based on Availability)
- 16.2.8 LC Sciences
- 16.2.8.1. Overview
- 16.2.8.2. Products
- 16.2.8.3. SWOT Analysis
- 16.2.8.4. Recent Developments
- 16.2.8.5. Financials (Based on Availability)
- 16.2.9 GenXPro GmbH
- 16.2.9.1. Overview
- 16.2.9.2. Products
- 16.2.9.3. SWOT Analysis
- 16.2.9.4. Recent Developments
- 16.2.9.5. Financials (Based on Availability)
- 16.2.10 BioMérieux SA
- 16.2.10.1. Overview
- 16.2.10.2. Products
- 16.2.10.3. SWOT Analysis
- 16.2.10.4. Recent Developments
- 16.2.10.5. Financials (Based on Availability)
- 16.2.11 Thermo Fisher Scientific
- 16.2.11.1. Overview
- 16.2.11.2. Products
- 16.2.11.3. SWOT Analysis
- 16.2.11.4. Recent Developments
- 16.2.11.5. Financials (Based on Availability)
- 16.2.12 QIAGEN
- 16.2.12.1. Overview
- 16.2.12.2. Products
- 16.2.12.3. SWOT Analysis
- 16.2.12.4. Recent Developments
- 16.2.12.5. Financials (Based on Availability)
- 16.2.1 IlluminaInc
List of Figures
- Figure 1: Global RNA Analytics Industry Revenue Breakdown (Million, %) by Region 2024 & 2032
- Figure 2: Global RNA Analytics Industry Volume Breakdown (K Unit, %) by Region 2024 & 2032
- Figure 3: North America RNA Analytics Industry Revenue (Million), by Country 2024 & 2032
- Figure 4: North America RNA Analytics Industry Volume (K Unit), by Country 2024 & 2032
- Figure 5: North America RNA Analytics Industry Revenue Share (%), by Country 2024 & 2032
- Figure 6: North America RNA Analytics Industry Volume Share (%), by Country 2024 & 2032
- Figure 7: Europe RNA Analytics Industry Revenue (Million), by Country 2024 & 2032
- Figure 8: Europe RNA Analytics Industry Volume (K Unit), by Country 2024 & 2032
- Figure 9: Europe RNA Analytics Industry Revenue Share (%), by Country 2024 & 2032
- Figure 10: Europe RNA Analytics Industry Volume Share (%), by Country 2024 & 2032
- Figure 11: Asia Pacific RNA Analytics Industry Revenue (Million), by Country 2024 & 2032
- Figure 12: Asia Pacific RNA Analytics Industry Volume (K Unit), by Country 2024 & 2032
- Figure 13: Asia Pacific RNA Analytics Industry Revenue Share (%), by Country 2024 & 2032
- Figure 14: Asia Pacific RNA Analytics Industry Volume Share (%), by Country 2024 & 2032
- Figure 15: Middle East and Africa RNA Analytics Industry Revenue (Million), by Country 2024 & 2032
- Figure 16: Middle East and Africa RNA Analytics Industry Volume (K Unit), by Country 2024 & 2032
- Figure 17: Middle East and Africa RNA Analytics Industry Revenue Share (%), by Country 2024 & 2032
- Figure 18: Middle East and Africa RNA Analytics Industry Volume Share (%), by Country 2024 & 2032
- Figure 19: South America RNA Analytics Industry Revenue (Million), by Country 2024 & 2032
- Figure 20: South America RNA Analytics Industry Volume (K Unit), by Country 2024 & 2032
- Figure 21: South America RNA Analytics Industry Revenue Share (%), by Country 2024 & 2032
- Figure 22: South America RNA Analytics Industry Volume Share (%), by Country 2024 & 2032
- Figure 23: North America RNA Analytics Industry Revenue (Million), by Product Type 2024 & 2032
- Figure 24: North America RNA Analytics Industry Volume (K Unit), by Product Type 2024 & 2032
- Figure 25: North America RNA Analytics Industry Revenue Share (%), by Product Type 2024 & 2032
- Figure 26: North America RNA Analytics Industry Volume Share (%), by Product Type 2024 & 2032
- Figure 27: North America RNA Analytics Industry Revenue (Million), by Technology 2024 & 2032
- Figure 28: North America RNA Analytics Industry Volume (K Unit), by Technology 2024 & 2032
- Figure 29: North America RNA Analytics Industry Revenue Share (%), by Technology 2024 & 2032
- Figure 30: North America RNA Analytics Industry Volume Share (%), by Technology 2024 & 2032
- Figure 31: North America RNA Analytics Industry Revenue (Million), by Application 2024 & 2032
- Figure 32: North America RNA Analytics Industry Volume (K Unit), by Application 2024 & 2032
- Figure 33: North America RNA Analytics Industry Revenue Share (%), by Application 2024 & 2032
- Figure 34: North America RNA Analytics Industry Volume Share (%), by Application 2024 & 2032
- Figure 35: North America RNA Analytics Industry Revenue (Million), by End User 2024 & 2032
- Figure 36: North America RNA Analytics Industry Volume (K Unit), by End User 2024 & 2032
- Figure 37: North America RNA Analytics Industry Revenue Share (%), by End User 2024 & 2032
- Figure 38: North America RNA Analytics Industry Volume Share (%), by End User 2024 & 2032
- Figure 39: North America RNA Analytics Industry Revenue (Million), by Country 2024 & 2032
- Figure 40: North America RNA Analytics Industry Volume (K Unit), by Country 2024 & 2032
- Figure 41: North America RNA Analytics Industry Revenue Share (%), by Country 2024 & 2032
- Figure 42: North America RNA Analytics Industry Volume Share (%), by Country 2024 & 2032
- Figure 43: Europe RNA Analytics Industry Revenue (Million), by Product Type 2024 & 2032
- Figure 44: Europe RNA Analytics Industry Volume (K Unit), by Product Type 2024 & 2032
- Figure 45: Europe RNA Analytics Industry Revenue Share (%), by Product Type 2024 & 2032
- Figure 46: Europe RNA Analytics Industry Volume Share (%), by Product Type 2024 & 2032
- Figure 47: Europe RNA Analytics Industry Revenue (Million), by Technology 2024 & 2032
- Figure 48: Europe RNA Analytics Industry Volume (K Unit), by Technology 2024 & 2032
- Figure 49: Europe RNA Analytics Industry Revenue Share (%), by Technology 2024 & 2032
- Figure 50: Europe RNA Analytics Industry Volume Share (%), by Technology 2024 & 2032
- Figure 51: Europe RNA Analytics Industry Revenue (Million), by Application 2024 & 2032
- Figure 52: Europe RNA Analytics Industry Volume (K Unit), by Application 2024 & 2032
- Figure 53: Europe RNA Analytics Industry Revenue Share (%), by Application 2024 & 2032
- Figure 54: Europe RNA Analytics Industry Volume Share (%), by Application 2024 & 2032
- Figure 55: Europe RNA Analytics Industry Revenue (Million), by End User 2024 & 2032
- Figure 56: Europe RNA Analytics Industry Volume (K Unit), by End User 2024 & 2032
- Figure 57: Europe RNA Analytics Industry Revenue Share (%), by End User 2024 & 2032
- Figure 58: Europe RNA Analytics Industry Volume Share (%), by End User 2024 & 2032
- Figure 59: Europe RNA Analytics Industry Revenue (Million), by Country 2024 & 2032
- Figure 60: Europe RNA Analytics Industry Volume (K Unit), by Country 2024 & 2032
- Figure 61: Europe RNA Analytics Industry Revenue Share (%), by Country 2024 & 2032
- Figure 62: Europe RNA Analytics Industry Volume Share (%), by Country 2024 & 2032
- Figure 63: Asia Pacific RNA Analytics Industry Revenue (Million), by Product Type 2024 & 2032
- Figure 64: Asia Pacific RNA Analytics Industry Volume (K Unit), by Product Type 2024 & 2032
- Figure 65: Asia Pacific RNA Analytics Industry Revenue Share (%), by Product Type 2024 & 2032
- Figure 66: Asia Pacific RNA Analytics Industry Volume Share (%), by Product Type 2024 & 2032
- Figure 67: Asia Pacific RNA Analytics Industry Revenue (Million), by Technology 2024 & 2032
- Figure 68: Asia Pacific RNA Analytics Industry Volume (K Unit), by Technology 2024 & 2032
- Figure 69: Asia Pacific RNA Analytics Industry Revenue Share (%), by Technology 2024 & 2032
- Figure 70: Asia Pacific RNA Analytics Industry Volume Share (%), by Technology 2024 & 2032
- Figure 71: Asia Pacific RNA Analytics Industry Revenue (Million), by Application 2024 & 2032
- Figure 72: Asia Pacific RNA Analytics Industry Volume (K Unit), by Application 2024 & 2032
- Figure 73: Asia Pacific RNA Analytics Industry Revenue Share (%), by Application 2024 & 2032
- Figure 74: Asia Pacific RNA Analytics Industry Volume Share (%), by Application 2024 & 2032
- Figure 75: Asia Pacific RNA Analytics Industry Revenue (Million), by End User 2024 & 2032
- Figure 76: Asia Pacific RNA Analytics Industry Volume (K Unit), by End User 2024 & 2032
- Figure 77: Asia Pacific RNA Analytics Industry Revenue Share (%), by End User 2024 & 2032
- Figure 78: Asia Pacific RNA Analytics Industry Volume Share (%), by End User 2024 & 2032
- Figure 79: Asia Pacific RNA Analytics Industry Revenue (Million), by Country 2024 & 2032
- Figure 80: Asia Pacific RNA Analytics Industry Volume (K Unit), by Country 2024 & 2032
- Figure 81: Asia Pacific RNA Analytics Industry Revenue Share (%), by Country 2024 & 2032
- Figure 82: Asia Pacific RNA Analytics Industry Volume Share (%), by Country 2024 & 2032
- Figure 83: Middle East and Africa RNA Analytics Industry Revenue (Million), by Product Type 2024 & 2032
- Figure 84: Middle East and Africa RNA Analytics Industry Volume (K Unit), by Product Type 2024 & 2032
- Figure 85: Middle East and Africa RNA Analytics Industry Revenue Share (%), by Product Type 2024 & 2032
- Figure 86: Middle East and Africa RNA Analytics Industry Volume Share (%), by Product Type 2024 & 2032
- Figure 87: Middle East and Africa RNA Analytics Industry Revenue (Million), by Technology 2024 & 2032
- Figure 88: Middle East and Africa RNA Analytics Industry Volume (K Unit), by Technology 2024 & 2032
- Figure 89: Middle East and Africa RNA Analytics Industry Revenue Share (%), by Technology 2024 & 2032
- Figure 90: Middle East and Africa RNA Analytics Industry Volume Share (%), by Technology 2024 & 2032
- Figure 91: Middle East and Africa RNA Analytics Industry Revenue (Million), by Application 2024 & 2032
- Figure 92: Middle East and Africa RNA Analytics Industry Volume (K Unit), by Application 2024 & 2032
- Figure 93: Middle East and Africa RNA Analytics Industry Revenue Share (%), by Application 2024 & 2032
- Figure 94: Middle East and Africa RNA Analytics Industry Volume Share (%), by Application 2024 & 2032
- Figure 95: Middle East and Africa RNA Analytics Industry Revenue (Million), by End User 2024 & 2032
- Figure 96: Middle East and Africa RNA Analytics Industry Volume (K Unit), by End User 2024 & 2032
- Figure 97: Middle East and Africa RNA Analytics Industry Revenue Share (%), by End User 2024 & 2032
- Figure 98: Middle East and Africa RNA Analytics Industry Volume Share (%), by End User 2024 & 2032
- Figure 99: Middle East and Africa RNA Analytics Industry Revenue (Million), by Country 2024 & 2032
- Figure 100: Middle East and Africa RNA Analytics Industry Volume (K Unit), by Country 2024 & 2032
- Figure 101: Middle East and Africa RNA Analytics Industry Revenue Share (%), by Country 2024 & 2032
- Figure 102: Middle East and Africa RNA Analytics Industry Volume Share (%), by Country 2024 & 2032
- Figure 103: South America RNA Analytics Industry Revenue (Million), by Product Type 2024 & 2032
- Figure 104: South America RNA Analytics Industry Volume (K Unit), by Product Type 2024 & 2032
- Figure 105: South America RNA Analytics Industry Revenue Share (%), by Product Type 2024 & 2032
- Figure 106: South America RNA Analytics Industry Volume Share (%), by Product Type 2024 & 2032
- Figure 107: South America RNA Analytics Industry Revenue (Million), by Technology 2024 & 2032
- Figure 108: South America RNA Analytics Industry Volume (K Unit), by Technology 2024 & 2032
- Figure 109: South America RNA Analytics Industry Revenue Share (%), by Technology 2024 & 2032
- Figure 110: South America RNA Analytics Industry Volume Share (%), by Technology 2024 & 2032
- Figure 111: South America RNA Analytics Industry Revenue (Million), by Application 2024 & 2032
- Figure 112: South America RNA Analytics Industry Volume (K Unit), by Application 2024 & 2032
- Figure 113: South America RNA Analytics Industry Revenue Share (%), by Application 2024 & 2032
- Figure 114: South America RNA Analytics Industry Volume Share (%), by Application 2024 & 2032
- Figure 115: South America RNA Analytics Industry Revenue (Million), by End User 2024 & 2032
- Figure 116: South America RNA Analytics Industry Volume (K Unit), by End User 2024 & 2032
- Figure 117: South America RNA Analytics Industry Revenue Share (%), by End User 2024 & 2032
- Figure 118: South America RNA Analytics Industry Volume Share (%), by End User 2024 & 2032
- Figure 119: South America RNA Analytics Industry Revenue (Million), by Country 2024 & 2032
- Figure 120: South America RNA Analytics Industry Volume (K Unit), by Country 2024 & 2032
- Figure 121: South America RNA Analytics Industry Revenue Share (%), by Country 2024 & 2032
- Figure 122: South America RNA Analytics Industry Volume Share (%), by Country 2024 & 2032
List of Tables
- Table 1: Global RNA Analytics Industry Revenue Million Forecast, by Region 2019 & 2032
- Table 2: Global RNA Analytics Industry Volume K Unit Forecast, by Region 2019 & 2032
- Table 3: Global RNA Analytics Industry Revenue Million Forecast, by Product Type 2019 & 2032
- Table 4: Global RNA Analytics Industry Volume K Unit Forecast, by Product Type 2019 & 2032
- Table 5: Global RNA Analytics Industry Revenue Million Forecast, by Technology 2019 & 2032
- Table 6: Global RNA Analytics Industry Volume K Unit Forecast, by Technology 2019 & 2032
- Table 7: Global RNA Analytics Industry Revenue Million Forecast, by Application 2019 & 2032
- Table 8: Global RNA Analytics Industry Volume K Unit Forecast, by Application 2019 & 2032
- Table 9: Global RNA Analytics Industry Revenue Million Forecast, by End User 2019 & 2032
- Table 10: Global RNA Analytics Industry Volume K Unit Forecast, by End User 2019 & 2032
- Table 11: Global RNA Analytics Industry Revenue Million Forecast, by Region 2019 & 2032
- Table 12: Global RNA Analytics Industry Volume K Unit Forecast, by Region 2019 & 2032
- Table 13: Global RNA Analytics Industry Revenue Million Forecast, by Country 2019 & 2032
- Table 14: Global RNA Analytics Industry Volume K Unit Forecast, by Country 2019 & 2032
- Table 15: United States RNA Analytics Industry Revenue (Million) Forecast, by Application 2019 & 2032
- Table 16: United States RNA Analytics Industry Volume (K Unit) Forecast, by Application 2019 & 2032
- Table 17: Canada RNA Analytics Industry Revenue (Million) Forecast, by Application 2019 & 2032
- Table 18: Canada RNA Analytics Industry Volume (K Unit) Forecast, by Application 2019 & 2032
- Table 19: Mexico RNA Analytics Industry Revenue (Million) Forecast, by Application 2019 & 2032
- Table 20: Mexico RNA Analytics Industry Volume (K Unit) Forecast, by Application 2019 & 2032
- Table 21: Global RNA Analytics Industry Revenue Million Forecast, by Country 2019 & 2032
- Table 22: Global RNA Analytics Industry Volume K Unit Forecast, by Country 2019 & 2032
- Table 23: Germany RNA Analytics Industry Revenue (Million) Forecast, by Application 2019 & 2032
- Table 24: Germany RNA Analytics Industry Volume (K Unit) Forecast, by Application 2019 & 2032
- Table 25: United Kingdom RNA Analytics Industry Revenue (Million) Forecast, by Application 2019 & 2032
- Table 26: United Kingdom RNA Analytics Industry Volume (K Unit) Forecast, by Application 2019 & 2032
- Table 27: France RNA Analytics Industry Revenue (Million) Forecast, by Application 2019 & 2032
- Table 28: France RNA Analytics Industry Volume (K Unit) Forecast, by Application 2019 & 2032
- Table 29: Italy RNA Analytics Industry Revenue (Million) Forecast, by Application 2019 & 2032
- Table 30: Italy RNA Analytics Industry Volume (K Unit) Forecast, by Application 2019 & 2032
- Table 31: Spain RNA Analytics Industry Revenue (Million) Forecast, by Application 2019 & 2032
- Table 32: Spain RNA Analytics Industry Volume (K Unit) Forecast, by Application 2019 & 2032
- Table 33: Rest of Europe RNA Analytics Industry Revenue (Million) Forecast, by Application 2019 & 2032
- Table 34: Rest of Europe RNA Analytics Industry Volume (K Unit) Forecast, by Application 2019 & 2032
- Table 35: Global RNA Analytics Industry Revenue Million Forecast, by Country 2019 & 2032
- Table 36: Global RNA Analytics Industry Volume K Unit Forecast, by Country 2019 & 2032
- Table 37: China RNA Analytics Industry Revenue (Million) Forecast, by Application 2019 & 2032
- Table 38: China RNA Analytics Industry Volume (K Unit) Forecast, by Application 2019 & 2032
- Table 39: Japan RNA Analytics Industry Revenue (Million) Forecast, by Application 2019 & 2032
- Table 40: Japan RNA Analytics Industry Volume (K Unit) Forecast, by Application 2019 & 2032
- Table 41: India RNA Analytics Industry Revenue (Million) Forecast, by Application 2019 & 2032
- Table 42: India RNA Analytics Industry Volume (K Unit) Forecast, by Application 2019 & 2032
- Table 43: Australia RNA Analytics Industry Revenue (Million) Forecast, by Application 2019 & 2032
- Table 44: Australia RNA Analytics Industry Volume (K Unit) Forecast, by Application 2019 & 2032
- Table 45: South Korea RNA Analytics Industry Revenue (Million) Forecast, by Application 2019 & 2032
- Table 46: South Korea RNA Analytics Industry Volume (K Unit) Forecast, by Application 2019 & 2032
- Table 47: Rest of Asia Pacific RNA Analytics Industry Revenue (Million) Forecast, by Application 2019 & 2032
- Table 48: Rest of Asia Pacific RNA Analytics Industry Volume (K Unit) Forecast, by Application 2019 & 2032
- Table 49: Global RNA Analytics Industry Revenue Million Forecast, by Country 2019 & 2032
- Table 50: Global RNA Analytics Industry Volume K Unit Forecast, by Country 2019 & 2032
- Table 51: GCC RNA Analytics Industry Revenue (Million) Forecast, by Application 2019 & 2032
- Table 52: GCC RNA Analytics Industry Volume (K Unit) Forecast, by Application 2019 & 2032
- Table 53: South Africa RNA Analytics Industry Revenue (Million) Forecast, by Application 2019 & 2032
- Table 54: South Africa RNA Analytics Industry Volume (K Unit) Forecast, by Application 2019 & 2032
- Table 55: Rest of Middle East and Africa RNA Analytics Industry Revenue (Million) Forecast, by Application 2019 & 2032
- Table 56: Rest of Middle East and Africa RNA Analytics Industry Volume (K Unit) Forecast, by Application 2019 & 2032
- Table 57: Global RNA Analytics Industry Revenue Million Forecast, by Country 2019 & 2032
- Table 58: Global RNA Analytics Industry Volume K Unit Forecast, by Country 2019 & 2032
- Table 59: Brazil RNA Analytics Industry Revenue (Million) Forecast, by Application 2019 & 2032
- Table 60: Brazil RNA Analytics Industry Volume (K Unit) Forecast, by Application 2019 & 2032
- Table 61: Argentina RNA Analytics Industry Revenue (Million) Forecast, by Application 2019 & 2032
- Table 62: Argentina RNA Analytics Industry Volume (K Unit) Forecast, by Application 2019 & 2032
- Table 63: Rest of South America RNA Analytics Industry Revenue (Million) Forecast, by Application 2019 & 2032
- Table 64: Rest of South America RNA Analytics Industry Volume (K Unit) Forecast, by Application 2019 & 2032
- Table 65: Global RNA Analytics Industry Revenue Million Forecast, by Product Type 2019 & 2032
- Table 66: Global RNA Analytics Industry Volume K Unit Forecast, by Product Type 2019 & 2032
- Table 67: Global RNA Analytics Industry Revenue Million Forecast, by Technology 2019 & 2032
- Table 68: Global RNA Analytics Industry Volume K Unit Forecast, by Technology 2019 & 2032
- Table 69: Global RNA Analytics Industry Revenue Million Forecast, by Application 2019 & 2032
- Table 70: Global RNA Analytics Industry Volume K Unit Forecast, by Application 2019 & 2032
- Table 71: Global RNA Analytics Industry Revenue Million Forecast, by End User 2019 & 2032
- Table 72: Global RNA Analytics Industry Volume K Unit Forecast, by End User 2019 & 2032
- Table 73: Global RNA Analytics Industry Revenue Million Forecast, by Country 2019 & 2032
- Table 74: Global RNA Analytics Industry Volume K Unit Forecast, by Country 2019 & 2032
- Table 75: United States RNA Analytics Industry Revenue (Million) Forecast, by Application 2019 & 2032
- Table 76: United States RNA Analytics Industry Volume (K Unit) Forecast, by Application 2019 & 2032
- Table 77: Canada RNA Analytics Industry Revenue (Million) Forecast, by Application 2019 & 2032
- Table 78: Canada RNA Analytics Industry Volume (K Unit) Forecast, by Application 2019 & 2032
- Table 79: Mexico RNA Analytics Industry Revenue (Million) Forecast, by Application 2019 & 2032
- Table 80: Mexico RNA Analytics Industry Volume (K Unit) Forecast, by Application 2019 & 2032
- Table 81: Global RNA Analytics Industry Revenue Million Forecast, by Product Type 2019 & 2032
- Table 82: Global RNA Analytics Industry Volume K Unit Forecast, by Product Type 2019 & 2032
- Table 83: Global RNA Analytics Industry Revenue Million Forecast, by Technology 2019 & 2032
- Table 84: Global RNA Analytics Industry Volume K Unit Forecast, by Technology 2019 & 2032
- Table 85: Global RNA Analytics Industry Revenue Million Forecast, by Application 2019 & 2032
- Table 86: Global RNA Analytics Industry Volume K Unit Forecast, by Application 2019 & 2032
- Table 87: Global RNA Analytics Industry Revenue Million Forecast, by End User 2019 & 2032
- Table 88: Global RNA Analytics Industry Volume K Unit Forecast, by End User 2019 & 2032
- Table 89: Global RNA Analytics Industry Revenue Million Forecast, by Country 2019 & 2032
- Table 90: Global RNA Analytics Industry Volume K Unit Forecast, by Country 2019 & 2032
- Table 91: Germany RNA Analytics Industry Revenue (Million) Forecast, by Application 2019 & 2032
- Table 92: Germany RNA Analytics Industry Volume (K Unit) Forecast, by Application 2019 & 2032
- Table 93: United Kingdom RNA Analytics Industry Revenue (Million) Forecast, by Application 2019 & 2032
- Table 94: United Kingdom RNA Analytics Industry Volume (K Unit) Forecast, by Application 2019 & 2032
- Table 95: France RNA Analytics Industry Revenue (Million) Forecast, by Application 2019 & 2032
- Table 96: France RNA Analytics Industry Volume (K Unit) Forecast, by Application 2019 & 2032
- Table 97: Italy RNA Analytics Industry Revenue (Million) Forecast, by Application 2019 & 2032
- Table 98: Italy RNA Analytics Industry Volume (K Unit) Forecast, by Application 2019 & 2032
- Table 99: Spain RNA Analytics Industry Revenue (Million) Forecast, by Application 2019 & 2032
- Table 100: Spain RNA Analytics Industry Volume (K Unit) Forecast, by Application 2019 & 2032
- Table 101: Rest of Europe RNA Analytics Industry Revenue (Million) Forecast, by Application 2019 & 2032
- Table 102: Rest of Europe RNA Analytics Industry Volume (K Unit) Forecast, by Application 2019 & 2032
- Table 103: Global RNA Analytics Industry Revenue Million Forecast, by Product Type 2019 & 2032
- Table 104: Global RNA Analytics Industry Volume K Unit Forecast, by Product Type 2019 & 2032
- Table 105: Global RNA Analytics Industry Revenue Million Forecast, by Technology 2019 & 2032
- Table 106: Global RNA Analytics Industry Volume K Unit Forecast, by Technology 2019 & 2032
- Table 107: Global RNA Analytics Industry Revenue Million Forecast, by Application 2019 & 2032
- Table 108: Global RNA Analytics Industry Volume K Unit Forecast, by Application 2019 & 2032
- Table 109: Global RNA Analytics Industry Revenue Million Forecast, by End User 2019 & 2032
- Table 110: Global RNA Analytics Industry Volume K Unit Forecast, by End User 2019 & 2032
- Table 111: Global RNA Analytics Industry Revenue Million Forecast, by Country 2019 & 2032
- Table 112: Global RNA Analytics Industry Volume K Unit Forecast, by Country 2019 & 2032
- Table 113: China RNA Analytics Industry Revenue (Million) Forecast, by Application 2019 & 2032
- Table 114: China RNA Analytics Industry Volume (K Unit) Forecast, by Application 2019 & 2032
- Table 115: Japan RNA Analytics Industry Revenue (Million) Forecast, by Application 2019 & 2032
- Table 116: Japan RNA Analytics Industry Volume (K Unit) Forecast, by Application 2019 & 2032
- Table 117: India RNA Analytics Industry Revenue (Million) Forecast, by Application 2019 & 2032
- Table 118: India RNA Analytics Industry Volume (K Unit) Forecast, by Application 2019 & 2032
- Table 119: Australia RNA Analytics Industry Revenue (Million) Forecast, by Application 2019 & 2032
- Table 120: Australia RNA Analytics Industry Volume (K Unit) Forecast, by Application 2019 & 2032
- Table 121: South Korea RNA Analytics Industry Revenue (Million) Forecast, by Application 2019 & 2032
- Table 122: South Korea RNA Analytics Industry Volume (K Unit) Forecast, by Application 2019 & 2032
- Table 123: Rest of Asia Pacific RNA Analytics Industry Revenue (Million) Forecast, by Application 2019 & 2032
- Table 124: Rest of Asia Pacific RNA Analytics Industry Volume (K Unit) Forecast, by Application 2019 & 2032
- Table 125: Global RNA Analytics Industry Revenue Million Forecast, by Product Type 2019 & 2032
- Table 126: Global RNA Analytics Industry Volume K Unit Forecast, by Product Type 2019 & 2032
- Table 127: Global RNA Analytics Industry Revenue Million Forecast, by Technology 2019 & 2032
- Table 128: Global RNA Analytics Industry Volume K Unit Forecast, by Technology 2019 & 2032
- Table 129: Global RNA Analytics Industry Revenue Million Forecast, by Application 2019 & 2032
- Table 130: Global RNA Analytics Industry Volume K Unit Forecast, by Application 2019 & 2032
- Table 131: Global RNA Analytics Industry Revenue Million Forecast, by End User 2019 & 2032
- Table 132: Global RNA Analytics Industry Volume K Unit Forecast, by End User 2019 & 2032
- Table 133: Global RNA Analytics Industry Revenue Million Forecast, by Country 2019 & 2032
- Table 134: Global RNA Analytics Industry Volume K Unit Forecast, by Country 2019 & 2032
- Table 135: GCC RNA Analytics Industry Revenue (Million) Forecast, by Application 2019 & 2032
- Table 136: GCC RNA Analytics Industry Volume (K Unit) Forecast, by Application 2019 & 2032
- Table 137: South Africa RNA Analytics Industry Revenue (Million) Forecast, by Application 2019 & 2032
- Table 138: South Africa RNA Analytics Industry Volume (K Unit) Forecast, by Application 2019 & 2032
- Table 139: Rest of Middle East and Africa RNA Analytics Industry Revenue (Million) Forecast, by Application 2019 & 2032
- Table 140: Rest of Middle East and Africa RNA Analytics Industry Volume (K Unit) Forecast, by Application 2019 & 2032
- Table 141: Global RNA Analytics Industry Revenue Million Forecast, by Product Type 2019 & 2032
- Table 142: Global RNA Analytics Industry Volume K Unit Forecast, by Product Type 2019 & 2032
- Table 143: Global RNA Analytics Industry Revenue Million Forecast, by Technology 2019 & 2032
- Table 144: Global RNA Analytics Industry Volume K Unit Forecast, by Technology 2019 & 2032
- Table 145: Global RNA Analytics Industry Revenue Million Forecast, by Application 2019 & 2032
- Table 146: Global RNA Analytics Industry Volume K Unit Forecast, by Application 2019 & 2032
- Table 147: Global RNA Analytics Industry Revenue Million Forecast, by End User 2019 & 2032
- Table 148: Global RNA Analytics Industry Volume K Unit Forecast, by End User 2019 & 2032
- Table 149: Global RNA Analytics Industry Revenue Million Forecast, by Country 2019 & 2032
- Table 150: Global RNA Analytics Industry Volume K Unit Forecast, by Country 2019 & 2032
- Table 151: Brazil RNA Analytics Industry Revenue (Million) Forecast, by Application 2019 & 2032
- Table 152: Brazil RNA Analytics Industry Volume (K Unit) Forecast, by Application 2019 & 2032
- Table 153: Argentina RNA Analytics Industry Revenue (Million) Forecast, by Application 2019 & 2032
- Table 154: Argentina RNA Analytics Industry Volume (K Unit) Forecast, by Application 2019 & 2032
- Table 155: Rest of South America RNA Analytics Industry Revenue (Million) Forecast, by Application 2019 & 2032
- Table 156: Rest of South America RNA Analytics Industry Volume (K Unit) Forecast, by Application 2019 & 2032
Frequently Asked Questions
1. What is the projected Compound Annual Growth Rate (CAGR) of the RNA Analytics Industry?
The projected CAGR is approximately 13.60%.
2. Which companies are prominent players in the RNA Analytics Industry?
Key companies in the market include IlluminaInc, Promega Corporation, Bio-Rad Laboratories Inc, Merck KGaA, F Hoffmann-La Roche Ltd, Eurofins Scientific, Agilent Technologies Inc, LC Sciences, GenXPro GmbH, BioMérieux SA, Thermo Fisher Scientific, QIAGEN.
3. What are the main segments of the RNA Analytics Industry?
The market segments include Product Type, Technology, Application, End User.
4. Can you provide details about the market size?
The market size is estimated to be USD XX Million as of 2022.
5. What are some drivers contributing to market growth?
Rising RNA Analysis in Cancer Personalized or Precision Medicine; Growing Applications of RNA Sequencing in Transcriptomics.
6. What are the notable trends driving market growth?
Reagents/Consumables Segment is Expected to Hold a Significant Share.
7. Are there any restraints impacting market growth?
High Cost Associated With Platforms; High Capital Investments for Research and Development.
8. Can you provide examples of recent developments in the market?
June 2022: Bio-Rad Laboratories, Inc. launched the SEQuoia Express Stranded RNA Library Prep Kit. The kit provides biopharmaceutical and research scientists with an easy-to-use solution for constructing robust libraries to support efficient RNA-Sequencing workflows for comprehensive transcriptome profiling.
9. What pricing options are available for accessing the report?
Pricing options include single-user, multi-user, and enterprise licenses priced at USD 4750, USD 5250, and USD 8750 respectively.
10. Is the market size provided in terms of value or volume?
The market size is provided in terms of value, measured in Million and volume, measured in K Unit.
11. Are there any specific market keywords associated with the report?
Yes, the market keyword associated with the report is "RNA Analytics Industry," which aids in identifying and referencing the specific market segment covered.
12. How do I determine which pricing option suits my needs best?
The pricing options vary based on user requirements and access needs. Individual users may opt for single-user licenses, while businesses requiring broader access may choose multi-user or enterprise licenses for cost-effective access to the report.
13. Are there any additional resources or data provided in the RNA Analytics Industry report?
While the report offers comprehensive insights, it's advisable to review the specific contents or supplementary materials provided to ascertain if additional resources or data are available.
14. How can I stay updated on further developments or reports in the RNA Analytics Industry?
To stay informed about further developments, trends, and reports in the RNA Analytics Industry, consider subscribing to industry newsletters, following relevant companies and organizations, or regularly checking reputable industry news sources and publications.
Methodology
Step 1 - Identification of Relevant Samples Size from Population Database


Step 2 - Approaches for Defining Global Market Size (Value, Volume* & Price*)

Note*: In applicable scenarios
Step 3 - Data Sources
Primary Research
- Web Analytics
- Survey Reports
- Research Institute
- Latest Research Reports
- Opinion Leaders
Secondary Research
- Annual Reports
- White Paper
- Latest Press Release
- Industry Association
- Paid Database
- Investor Presentations

Step 4 - Data Triangulation
Involves using different sources of information in order to increase the validity of a study
These sources are likely to be stakeholders in a program - participants, other researchers, program staff, other community members, and so on.
Then we put all data in single framework & apply various statistical tools to find out the dynamic on the market.
During the analysis stage, feedback from the stakeholder groups would be compared to determine areas of agreement as well as areas of divergence


