
Key Insights
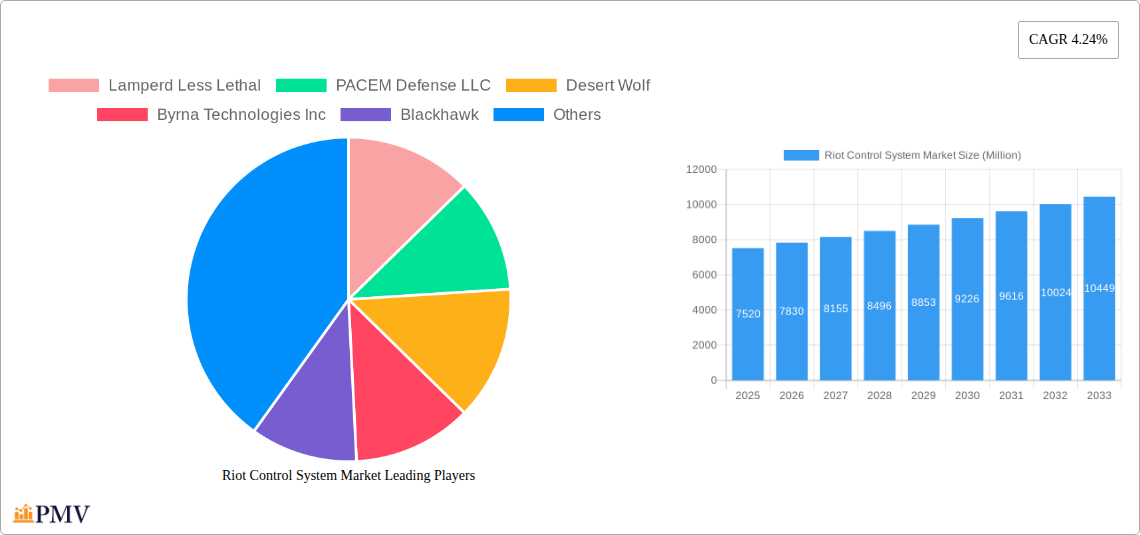
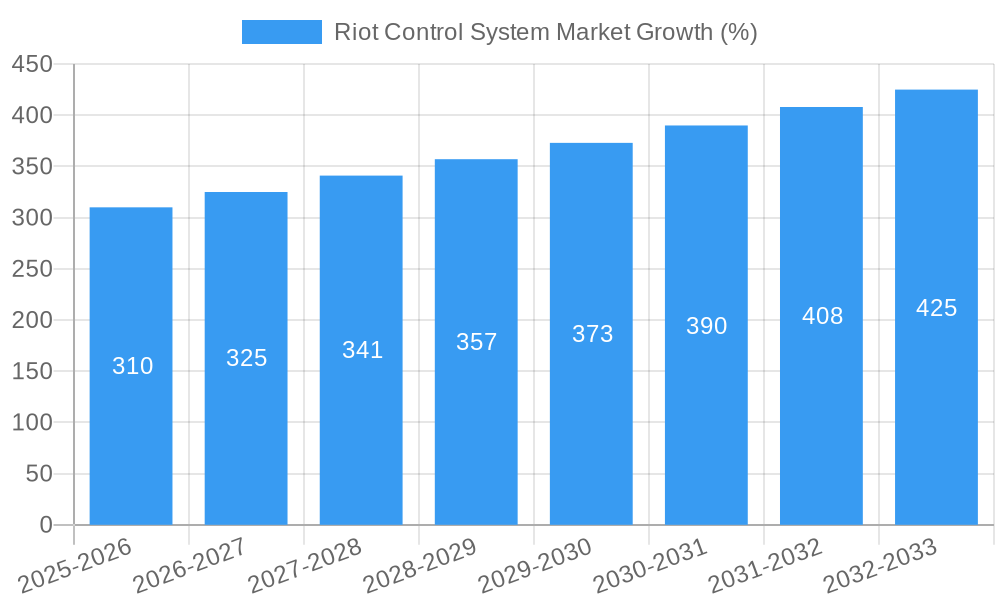
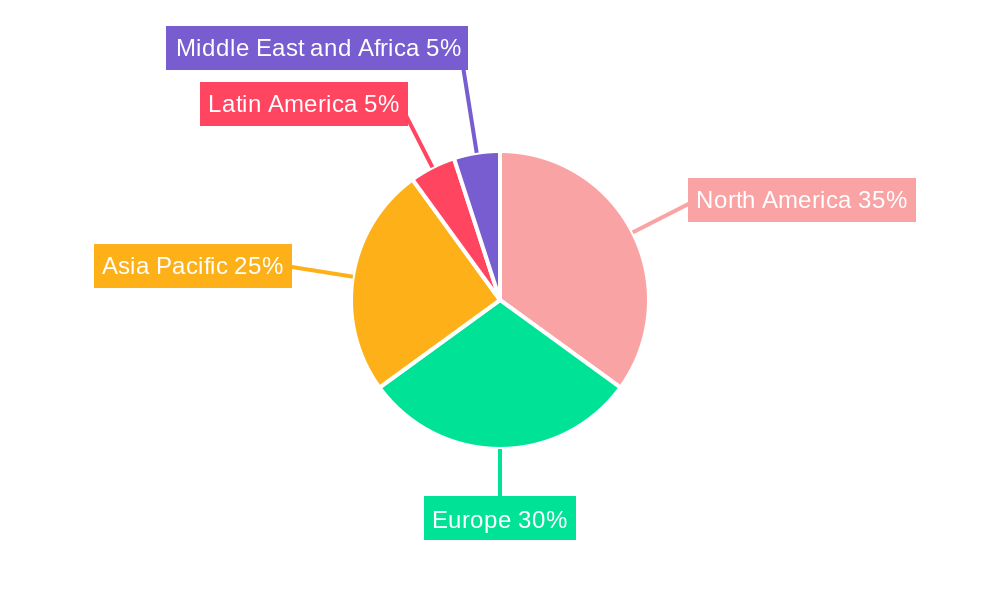
The global riot control systems market, valued at $7.52 billion in 2025, is projected to experience robust growth, driven by escalating civil unrest globally and the increasing need for effective, non-lethal crowd control measures by law enforcement and military agencies. The market's Compound Annual Growth Rate (CAGR) of 4.24% from 2025 to 2033 indicates a steady expansion, fueled by technological advancements in less-lethal weaponry and sophisticated training programs for personnel. Key growth drivers include the rising adoption of advanced technologies such as body cameras integrated with less-lethal devices for improved accountability and evidence gathering, and the increasing demand for more precise and targeted non-lethal weapons minimizing collateral damage. Market segmentation reveals significant demand across various product types, including personal protective equipment, shields, area denial systems (anti-vehicle and anti-personnel), a diverse range of ammunition (rubber bullets, bean bag rounds, etc.), explosives (flashbang and sting grenades), and gases and sprays (pepper spray, tear gas). The law enforcement sector constitutes a major end-user segment, followed by special forces units. Regional analysis indicates strong growth across North America and Europe, driven by mature markets and robust public safety budgets. However, Asia-Pacific and the Middle East & Africa are also exhibiting significant potential for market expansion due to rising urbanization, social unrest, and increasing government investments in security infrastructure.
The market faces certain restraints, including ethical concerns surrounding the use of less-lethal weapons, stringent regulatory frameworks governing their deployment and production, and the potential for misuse or escalation of force. However, these are being mitigated through advancements in safety features, improved training protocols, and stronger ethical guidelines. The continuous innovation in non-lethal technologies, focusing on increased precision, reduced injury risk, and enhanced situational awareness, is expected to play a pivotal role in the market's future growth trajectory. Furthermore, the growing emphasis on responsible and ethical use, coupled with advancements in data analytics for improved situational assessment, will shape the market's development in the coming years. The strategic partnerships between manufacturers and government agencies to improve procurement and training programs will also further strengthen the market's growth momentum.
Riot Control System Market: A Comprehensive Report (2019-2033)
This in-depth report provides a comprehensive analysis of the global Riot Control System market, offering actionable insights for stakeholders across the industry. With a study period spanning 2019-2033, a base year of 2025, and a forecast period of 2025-2033, this report leverages historical data (2019-2024) to project future market trends and dynamics. The report covers key segments, leading players, and emerging technologies, providing a complete picture of this dynamic market valued at xx Million in 2025 and projected to reach xx Million by 2033.
Riot Control System Market Market Structure & Competitive Dynamics
The Riot Control System market exhibits a moderately consolidated structure, with several key players vying for market share. Market concentration is influenced by factors such as technological innovation, regulatory landscapes, and the prevalence of product substitutes. The market is witnessing increased M&A activity, with deals primarily focused on expanding product portfolios and geographic reach. For instance, a recent deal valued at xx Million involved [Insert hypothetical M&A details, if available; otherwise, state "no significant M&A deals were publicly reported within the timeframe"]. Furthermore, the regulatory environment significantly impacts market dynamics, with varying regulations across different regions influencing product adoption and market penetration. The presence of substitute technologies and products also presents competitive pressures. End-user trends, particularly increased demand from law enforcement agencies for advanced riot control equipment, are driving market growth. Key metrics like market share are analyzed in detail, providing a granular understanding of the competitive landscape.
- Market Concentration: Moderately Consolidated (xx% market share held by top 5 players in 2025)
- Innovation Ecosystem: Active, with ongoing R&D in non-lethal weaponry and technological integration.
- Regulatory Frameworks: Varying across geographies, impacting product approvals and sales.
- Product Substitutes: Limited, but evolving with technological advancements in crowd control techniques.
- M&A Activity: Moderate, with deals focusing on expansion and technological integration.
Riot Control System Market Industry Trends & Insights
The global Riot Control System market is projected to experience a Compound Annual Growth Rate (CAGR) of xx% during the forecast period (2025-2033). This growth is driven by several factors, including rising global unrest and civil conflicts, increasing demand for advanced non-lethal weaponry, and technological advancements leading to improved efficacy and safety of riot control equipment. Technological disruptions are transforming the market, with the integration of AI, drones, and other smart technologies. Consumer preferences are shifting towards more precise and less harmful crowd control methods, leading to innovations in less-lethal ammunition and equipment. The competitive landscape is highly dynamic, with both established players and new entrants continuously striving to enhance their product offerings and expand their market reach. Market penetration for advanced riot control systems is expected to increase significantly by xx% by 2033, driven by government investments in security and law enforcement.
Dominant Markets & Segments in Riot Control System Market
The North American region currently dominates the Riot Control System market due to high government spending on law enforcement and security, coupled with advancements in non-lethal technologies. However, rapidly developing economies in Asia-Pacific are showing strong growth potential.
- Leading Region: North America
- Leading End-User: Law Enforcement
- Leading Product Type: Ammunition (Bean Bag Rounds, Rubber Bullets experiencing highest growth)
Key Drivers by Segment:
- Law Enforcement: Increased government funding, heightened security concerns, and demand for non-lethal solutions.
- Ammunition (Bean Bag Rounds): Effective, relatively safe, and widely adopted alternative to lethal force.
- Gases and Sprays (Pepper Spray): Widely used, cost-effective, and readily available for crowd control.
The dominance of specific segments is analyzed in detail, taking into account factors like technological advancements, regulatory landscapes, and economic policies.
Riot Control System Market Product Innovations
Recent innovations are focused on enhancing the precision and safety of riot control systems. This includes the development of more accurate and less harmful projectiles, as well as the integration of smart technologies like drones for targeted deployment of crowd control measures. The market is witnessing a transition towards less-lethal and more precise solutions, emphasizing both effectiveness and minimizing collateral damage. These innovations align with growing concerns about human rights and the ethical use of force in crowd control scenarios.
Report Segmentation & Scope
The report segments the Riot Control System market by product type (Personal Protective Equipment, Shields, Offensive Equipment, Area Denial systems [Anti-vehicle, Anti-personnel], Ammunition [Rubber Bullets, Wax Bullets, Plastic Bullets, Bean Bag Rounds, Sponge Grenades], Explosives [Flash Bang Grenades, Sting Grenades], and Gases and Sprays [Water Canons, Scent-based Weapons, Tear Gas, Pepper Spray]) and end-user (Law Enforcement, Special Forces). Each segment is analyzed extensively, considering growth projections, market size, and competitive dynamics. Market size for each segment is projected for the forecast period and is detailed within the full report.
Key Drivers of Riot Control System Market Growth
Several factors drive the growth of the Riot Control System market. Increased global instability and civil unrest necessitates effective crowd control solutions. Government spending on security and law enforcement is a significant driver, particularly in developed and rapidly developing nations. Technological advancements continue to improve the effectiveness and safety of riot control equipment. Regulatory changes related to less-lethal weaponry also influence market growth.
Challenges in the Riot Control System Market Sector
The market faces several challenges, including stringent regulations and ethical concerns surrounding the use of riot control equipment. Supply chain disruptions and cost fluctuations of raw materials also pose challenges. Competitive pressures from both established players and emerging companies impact profitability and market share. These factors are analyzed quantitatively in the full report, to demonstrate their potential impact on market growth.
Leading Players in the Riot Control System Market Market
- Lamperd Less Lethal
- PACEM Defense LLC
- Desert Wolf
- Byrna Technologies Inc
- Blackhawk
- NonLethal Technologies Inc
- Axon Enterprise Inc
- Genasys Inc
- Etienne Lacroix Group
- Condor Non-lethal Technologies
- Combined Systems Inc
- Safariland LLC
Key Developments in Riot Control System Market Sector
- September 2022: BSF launched a tear gas shell-dropping drone system, significantly impacting the market by introducing UAV technology for riot control.
- June 2022: The Iranian police invested nearly USD 10 Million in anti-riot equipment, demonstrating the market's responsiveness to heightened social unrest.
Strategic Riot Control System Market Market Outlook
The Riot Control System market exhibits significant growth potential driven by escalating global security concerns and continuous technological advancements. Strategic opportunities exist for companies that focus on innovation, particularly in developing less-lethal, more precise, and ethically sound crowd control technologies. Further market expansion is anticipated in developing economies, particularly with increased investment in public safety infrastructure.
Riot Control System Market Segmentation
-
1. Product Type
-
1.1. Personal Protective Equipment
- 1.1.1. Vests
- 1.1.2. Helmets
- 1.1.3. Gas Masks
- 1.1.4. Shields
-
1.2. Offensive Equipment
-
1.2.1. Area Denial
- 1.2.1.1. Anti-vehicle
- 1.2.1.2. Anti-personnel
-
1.2.2. Ammunition
- 1.2.2.1. Rubber Bullets
- 1.2.2.2. Wax Bullets
- 1.2.2.3. Plastic Bullets
- 1.2.2.4. Bean Bag Rounds
- 1.2.2.5. Sponge Grenade
-
1.2.3. Explosives
- 1.2.3.1. Flash Bang Grenades
- 1.2.3.2. Sting Grenades
-
1.2.4. Gases and Sprays
- 1.2.4.1. Water Canons
- 1.2.4.2. Scent-based Weapons
- 1.2.4.3. Tear Gas
- 1.2.4.4. Pepper Spray
- 1.2.5. Directed Energy Weapons
- 1.2.6. Electroshock Weapons
- 1.2.7. Other Offensive Equipment
-
1.2.1. Area Denial
-
1.1. Personal Protective Equipment
-
2. End-User
- 2.1. Law Enforcement
- 2.2. Special Forces
Riot Control System Market Segmentation By Geography
-
1. North America
- 1.1. United States
- 1.2. Canada
-
2. Europe
- 2.1. United Kingdom
- 2.2. France
- 2.3. Germany
- 2.4. Russia
- 2.5. Rest of Europe
-
3. Asia Pacific
- 3.1. China
- 3.2. India
- 3.3. Japan
- 3.4. South Korea
- 3.5. Rest of Asia Pacific
-
4. Latin America
- 4.1. Brazil
- 4.2. Rest of Latin America
-
5. Middle East and Africa
- 5.1. Saudi Arabia
- 5.2. United Arab Emirates
- 5.3. Israel
- 5.4. Rest of Middle East and Africa
Riot Control System Market REPORT HIGHLIGHTS
| Aspects | Details |
|---|---|
| Study Period | 2019-2033 |
| Base Year | 2024 |
| Estimated Year | 2025 |
| Forecast Period | 2025-2033 |
| Historical Period | 2019-2024 |
| Growth Rate | CAGR of 4.24% from 2019-2033 |
| Segmentation |
|
Table of Contents
- 1. Introduction
- 1.1. Research Scope
- 1.2. Market Segmentation
- 1.3. Research Methodology
- 1.4. Definitions and Assumptions
- 2. Executive Summary
- 2.1. Introduction
- 3. Market Dynamics
- 3.1. Introduction
- 3.2. Market Drivers
- 3.3. Market Restrains
- 3.4. Market Trends
- 3.4.1. The Offensive Equipment Segment is Expected to Experience the Highest Growth During the Forecast Period
- 4. Market Factor Analysis
- 4.1. Porters Five Forces
- 4.2. Supply/Value Chain
- 4.3. PESTEL analysis
- 4.4. Market Entropy
- 4.5. Patent/Trademark Analysis
- 5. Global Riot Control System Market Analysis, Insights and Forecast, 2019-2031
- 5.1. Market Analysis, Insights and Forecast - by Product Type
- 5.1.1. Personal Protective Equipment
- 5.1.1.1. Vests
- 5.1.1.2. Helmets
- 5.1.1.3. Gas Masks
- 5.1.1.4. Shields
- 5.1.2. Offensive Equipment
- 5.1.2.1. Area Denial
- 5.1.2.1.1. Anti-vehicle
- 5.1.2.1.2. Anti-personnel
- 5.1.2.2. Ammunition
- 5.1.2.2.1. Rubber Bullets
- 5.1.2.2.2. Wax Bullets
- 5.1.2.2.3. Plastic Bullets
- 5.1.2.2.4. Bean Bag Rounds
- 5.1.2.2.5. Sponge Grenade
- 5.1.2.3. Explosives
- 5.1.2.3.1. Flash Bang Grenades
- 5.1.2.3.2. Sting Grenades
- 5.1.2.4. Gases and Sprays
- 5.1.2.4.1. Water Canons
- 5.1.2.4.2. Scent-based Weapons
- 5.1.2.4.3. Tear Gas
- 5.1.2.4.4. Pepper Spray
- 5.1.2.5. Directed Energy Weapons
- 5.1.2.6. Electroshock Weapons
- 5.1.2.7. Other Offensive Equipment
- 5.1.2.1. Area Denial
- 5.1.1. Personal Protective Equipment
- 5.2. Market Analysis, Insights and Forecast - by End-User
- 5.2.1. Law Enforcement
- 5.2.2. Special Forces
- 5.3. Market Analysis, Insights and Forecast - by Region
- 5.3.1. North America
- 5.3.2. Europe
- 5.3.3. Asia Pacific
- 5.3.4. Latin America
- 5.3.5. Middle East and Africa
- 5.1. Market Analysis, Insights and Forecast - by Product Type
- 6. North America Riot Control System Market Analysis, Insights and Forecast, 2019-2031
- 6.1. Market Analysis, Insights and Forecast - by Product Type
- 6.1.1. Personal Protective Equipment
- 6.1.1.1. Vests
- 6.1.1.2. Helmets
- 6.1.1.3. Gas Masks
- 6.1.1.4. Shields
- 6.1.2. Offensive Equipment
- 6.1.2.1. Area Denial
- 6.1.2.1.1. Anti-vehicle
- 6.1.2.1.2. Anti-personnel
- 6.1.2.2. Ammunition
- 6.1.2.2.1. Rubber Bullets
- 6.1.2.2.2. Wax Bullets
- 6.1.2.2.3. Plastic Bullets
- 6.1.2.2.4. Bean Bag Rounds
- 6.1.2.2.5. Sponge Grenade
- 6.1.2.3. Explosives
- 6.1.2.3.1. Flash Bang Grenades
- 6.1.2.3.2. Sting Grenades
- 6.1.2.4. Gases and Sprays
- 6.1.2.4.1. Water Canons
- 6.1.2.4.2. Scent-based Weapons
- 6.1.2.4.3. Tear Gas
- 6.1.2.4.4. Pepper Spray
- 6.1.2.5. Directed Energy Weapons
- 6.1.2.6. Electroshock Weapons
- 6.1.2.7. Other Offensive Equipment
- 6.1.2.1. Area Denial
- 6.1.1. Personal Protective Equipment
- 6.2. Market Analysis, Insights and Forecast - by End-User
- 6.2.1. Law Enforcement
- 6.2.2. Special Forces
- 6.1. Market Analysis, Insights and Forecast - by Product Type
- 7. Europe Riot Control System Market Analysis, Insights and Forecast, 2019-2031
- 7.1. Market Analysis, Insights and Forecast - by Product Type
- 7.1.1. Personal Protective Equipment
- 7.1.1.1. Vests
- 7.1.1.2. Helmets
- 7.1.1.3. Gas Masks
- 7.1.1.4. Shields
- 7.1.2. Offensive Equipment
- 7.1.2.1. Area Denial
- 7.1.2.1.1. Anti-vehicle
- 7.1.2.1.2. Anti-personnel
- 7.1.2.2. Ammunition
- 7.1.2.2.1. Rubber Bullets
- 7.1.2.2.2. Wax Bullets
- 7.1.2.2.3. Plastic Bullets
- 7.1.2.2.4. Bean Bag Rounds
- 7.1.2.2.5. Sponge Grenade
- 7.1.2.3. Explosives
- 7.1.2.3.1. Flash Bang Grenades
- 7.1.2.3.2. Sting Grenades
- 7.1.2.4. Gases and Sprays
- 7.1.2.4.1. Water Canons
- 7.1.2.4.2. Scent-based Weapons
- 7.1.2.4.3. Tear Gas
- 7.1.2.4.4. Pepper Spray
- 7.1.2.5. Directed Energy Weapons
- 7.1.2.6. Electroshock Weapons
- 7.1.2.7. Other Offensive Equipment
- 7.1.2.1. Area Denial
- 7.1.1. Personal Protective Equipment
- 7.2. Market Analysis, Insights and Forecast - by End-User
- 7.2.1. Law Enforcement
- 7.2.2. Special Forces
- 7.1. Market Analysis, Insights and Forecast - by Product Type
- 8. Asia Pacific Riot Control System Market Analysis, Insights and Forecast, 2019-2031
- 8.1. Market Analysis, Insights and Forecast - by Product Type
- 8.1.1. Personal Protective Equipment
- 8.1.1.1. Vests
- 8.1.1.2. Helmets
- 8.1.1.3. Gas Masks
- 8.1.1.4. Shields
- 8.1.2. Offensive Equipment
- 8.1.2.1. Area Denial
- 8.1.2.1.1. Anti-vehicle
- 8.1.2.1.2. Anti-personnel
- 8.1.2.2. Ammunition
- 8.1.2.2.1. Rubber Bullets
- 8.1.2.2.2. Wax Bullets
- 8.1.2.2.3. Plastic Bullets
- 8.1.2.2.4. Bean Bag Rounds
- 8.1.2.2.5. Sponge Grenade
- 8.1.2.3. Explosives
- 8.1.2.3.1. Flash Bang Grenades
- 8.1.2.3.2. Sting Grenades
- 8.1.2.4. Gases and Sprays
- 8.1.2.4.1. Water Canons
- 8.1.2.4.2. Scent-based Weapons
- 8.1.2.4.3. Tear Gas
- 8.1.2.4.4. Pepper Spray
- 8.1.2.5. Directed Energy Weapons
- 8.1.2.6. Electroshock Weapons
- 8.1.2.7. Other Offensive Equipment
- 8.1.2.1. Area Denial
- 8.1.1. Personal Protective Equipment
- 8.2. Market Analysis, Insights and Forecast - by End-User
- 8.2.1. Law Enforcement
- 8.2.2. Special Forces
- 8.1. Market Analysis, Insights and Forecast - by Product Type
- 9. Latin America Riot Control System Market Analysis, Insights and Forecast, 2019-2031
- 9.1. Market Analysis, Insights and Forecast - by Product Type
- 9.1.1. Personal Protective Equipment
- 9.1.1.1. Vests
- 9.1.1.2. Helmets
- 9.1.1.3. Gas Masks
- 9.1.1.4. Shields
- 9.1.2. Offensive Equipment
- 9.1.2.1. Area Denial
- 9.1.2.1.1. Anti-vehicle
- 9.1.2.1.2. Anti-personnel
- 9.1.2.2. Ammunition
- 9.1.2.2.1. Rubber Bullets
- 9.1.2.2.2. Wax Bullets
- 9.1.2.2.3. Plastic Bullets
- 9.1.2.2.4. Bean Bag Rounds
- 9.1.2.2.5. Sponge Grenade
- 9.1.2.3. Explosives
- 9.1.2.3.1. Flash Bang Grenades
- 9.1.2.3.2. Sting Grenades
- 9.1.2.4. Gases and Sprays
- 9.1.2.4.1. Water Canons
- 9.1.2.4.2. Scent-based Weapons
- 9.1.2.4.3. Tear Gas
- 9.1.2.4.4. Pepper Spray
- 9.1.2.5. Directed Energy Weapons
- 9.1.2.6. Electroshock Weapons
- 9.1.2.7. Other Offensive Equipment
- 9.1.2.1. Area Denial
- 9.1.1. Personal Protective Equipment
- 9.2. Market Analysis, Insights and Forecast - by End-User
- 9.2.1. Law Enforcement
- 9.2.2. Special Forces
- 9.1. Market Analysis, Insights and Forecast - by Product Type
- 10. Middle East and Africa Riot Control System Market Analysis, Insights and Forecast, 2019-2031
- 10.1. Market Analysis, Insights and Forecast - by Product Type
- 10.1.1. Personal Protective Equipment
- 10.1.1.1. Vests
- 10.1.1.2. Helmets
- 10.1.1.3. Gas Masks
- 10.1.1.4. Shields
- 10.1.2. Offensive Equipment
- 10.1.2.1. Area Denial
- 10.1.2.1.1. Anti-vehicle
- 10.1.2.1.2. Anti-personnel
- 10.1.2.2. Ammunition
- 10.1.2.2.1. Rubber Bullets
- 10.1.2.2.2. Wax Bullets
- 10.1.2.2.3. Plastic Bullets
- 10.1.2.2.4. Bean Bag Rounds
- 10.1.2.2.5. Sponge Grenade
- 10.1.2.3. Explosives
- 10.1.2.3.1. Flash Bang Grenades
- 10.1.2.3.2. Sting Grenades
- 10.1.2.4. Gases and Sprays
- 10.1.2.4.1. Water Canons
- 10.1.2.4.2. Scent-based Weapons
- 10.1.2.4.3. Tear Gas
- 10.1.2.4.4. Pepper Spray
- 10.1.2.5. Directed Energy Weapons
- 10.1.2.6. Electroshock Weapons
- 10.1.2.7. Other Offensive Equipment
- 10.1.2.1. Area Denial
- 10.1.1. Personal Protective Equipment
- 10.2. Market Analysis, Insights and Forecast - by End-User
- 10.2.1. Law Enforcement
- 10.2.2. Special Forces
- 10.1. Market Analysis, Insights and Forecast - by Product Type
- 11. North America Riot Control System Market Analysis, Insights and Forecast, 2019-2031
- 11.1. Market Analysis, Insights and Forecast - By Country/Sub-region
- 11.1.1 United States
- 11.1.2 Canada
- 12. Europe Riot Control System Market Analysis, Insights and Forecast, 2019-2031
- 12.1. Market Analysis, Insights and Forecast - By Country/Sub-region
- 12.1.1 United Kingdom
- 12.1.2 France
- 12.1.3 Germany
- 12.1.4 Italy
- 12.1.5 Rest of Europe
- 13. Asia Pacific Riot Control System Market Analysis, Insights and Forecast, 2019-2031
- 13.1. Market Analysis, Insights and Forecast - By Country/Sub-region
- 13.1.1 China
- 13.1.2 India
- 13.1.3 Japan
- 13.1.4 South Korea
- 13.1.5 Rest of Asia Pacific
- 14. Latin America Riot Control System Market Analysis, Insights and Forecast, 2019-2031
- 14.1. Market Analysis, Insights and Forecast - By Country/Sub-region
- 14.1.1 Brazil
- 14.1.2 Mexico
- 14.1.3 Rest of Latin America
- 15. Middle East and Africa Riot Control System Market Analysis, Insights and Forecast, 2019-2031
- 15.1. Market Analysis, Insights and Forecast - By Country/Sub-region
- 15.1.1 Saudi Arabia
- 15.1.2 United Arab Emirates
- 15.1.3 South Africa
- 15.1.4 Qatar
- 15.1.5 Rest of Middle East and Africa
- 16. Competitive Analysis
- 16.1. Global Market Share Analysis 2024
- 16.2. Company Profiles
- 16.2.1 Lamperd Less Lethal
- 16.2.1.1. Overview
- 16.2.1.2. Products
- 16.2.1.3. SWOT Analysis
- 16.2.1.4. Recent Developments
- 16.2.1.5. Financials (Based on Availability)
- 16.2.2 PACEM Defense LLC
- 16.2.2.1. Overview
- 16.2.2.2. Products
- 16.2.2.3. SWOT Analysis
- 16.2.2.4. Recent Developments
- 16.2.2.5. Financials (Based on Availability)
- 16.2.3 Desert Wolf
- 16.2.3.1. Overview
- 16.2.3.2. Products
- 16.2.3.3. SWOT Analysis
- 16.2.3.4. Recent Developments
- 16.2.3.5. Financials (Based on Availability)
- 16.2.4 Byrna Technologies Inc
- 16.2.4.1. Overview
- 16.2.4.2. Products
- 16.2.4.3. SWOT Analysis
- 16.2.4.4. Recent Developments
- 16.2.4.5. Financials (Based on Availability)
- 16.2.5 Blackhawk
- 16.2.5.1. Overview
- 16.2.5.2. Products
- 16.2.5.3. SWOT Analysis
- 16.2.5.4. Recent Developments
- 16.2.5.5. Financials (Based on Availability)
- 16.2.6 NonLethal Technologies Inc
- 16.2.6.1. Overview
- 16.2.6.2. Products
- 16.2.6.3. SWOT Analysis
- 16.2.6.4. Recent Developments
- 16.2.6.5. Financials (Based on Availability)
- 16.2.7 Axon Enterprise Inc
- 16.2.7.1. Overview
- 16.2.7.2. Products
- 16.2.7.3. SWOT Analysis
- 16.2.7.4. Recent Developments
- 16.2.7.5. Financials (Based on Availability)
- 16.2.8 Genasys Inc
- 16.2.8.1. Overview
- 16.2.8.2. Products
- 16.2.8.3. SWOT Analysis
- 16.2.8.4. Recent Developments
- 16.2.8.5. Financials (Based on Availability)
- 16.2.9 Etienne Lacroix Group
- 16.2.9.1. Overview
- 16.2.9.2. Products
- 16.2.9.3. SWOT Analysis
- 16.2.9.4. Recent Developments
- 16.2.9.5. Financials (Based on Availability)
- 16.2.10 Condor Non-lethal Technologies
- 16.2.10.1. Overview
- 16.2.10.2. Products
- 16.2.10.3. SWOT Analysis
- 16.2.10.4. Recent Developments
- 16.2.10.5. Financials (Based on Availability)
- 16.2.11 Combined Systems Inc
- 16.2.11.1. Overview
- 16.2.11.2. Products
- 16.2.11.3. SWOT Analysis
- 16.2.11.4. Recent Developments
- 16.2.11.5. Financials (Based on Availability)
- 16.2.12 Safariland LLC
- 16.2.12.1. Overview
- 16.2.12.2. Products
- 16.2.12.3. SWOT Analysis
- 16.2.12.4. Recent Developments
- 16.2.12.5. Financials (Based on Availability)
- 16.2.1 Lamperd Less Lethal
List of Figures
- Figure 1: Global Riot Control System Market Revenue Breakdown (Million, %) by Region 2024 & 2032
- Figure 2: North America Riot Control System Market Revenue (Million), by Country 2024 & 2032
- Figure 3: North America Riot Control System Market Revenue Share (%), by Country 2024 & 2032
- Figure 4: Europe Riot Control System Market Revenue (Million), by Country 2024 & 2032
- Figure 5: Europe Riot Control System Market Revenue Share (%), by Country 2024 & 2032
- Figure 6: Asia Pacific Riot Control System Market Revenue (Million), by Country 2024 & 2032
- Figure 7: Asia Pacific Riot Control System Market Revenue Share (%), by Country 2024 & 2032
- Figure 8: Latin America Riot Control System Market Revenue (Million), by Country 2024 & 2032
- Figure 9: Latin America Riot Control System Market Revenue Share (%), by Country 2024 & 2032
- Figure 10: Middle East and Africa Riot Control System Market Revenue (Million), by Country 2024 & 2032
- Figure 11: Middle East and Africa Riot Control System Market Revenue Share (%), by Country 2024 & 2032
- Figure 12: North America Riot Control System Market Revenue (Million), by Product Type 2024 & 2032
- Figure 13: North America Riot Control System Market Revenue Share (%), by Product Type 2024 & 2032
- Figure 14: North America Riot Control System Market Revenue (Million), by End-User 2024 & 2032
- Figure 15: North America Riot Control System Market Revenue Share (%), by End-User 2024 & 2032
- Figure 16: North America Riot Control System Market Revenue (Million), by Country 2024 & 2032
- Figure 17: North America Riot Control System Market Revenue Share (%), by Country 2024 & 2032
- Figure 18: Europe Riot Control System Market Revenue (Million), by Product Type 2024 & 2032
- Figure 19: Europe Riot Control System Market Revenue Share (%), by Product Type 2024 & 2032
- Figure 20: Europe Riot Control System Market Revenue (Million), by End-User 2024 & 2032
- Figure 21: Europe Riot Control System Market Revenue Share (%), by End-User 2024 & 2032
- Figure 22: Europe Riot Control System Market Revenue (Million), by Country 2024 & 2032
- Figure 23: Europe Riot Control System Market Revenue Share (%), by Country 2024 & 2032
- Figure 24: Asia Pacific Riot Control System Market Revenue (Million), by Product Type 2024 & 2032
- Figure 25: Asia Pacific Riot Control System Market Revenue Share (%), by Product Type 2024 & 2032
- Figure 26: Asia Pacific Riot Control System Market Revenue (Million), by End-User 2024 & 2032
- Figure 27: Asia Pacific Riot Control System Market Revenue Share (%), by End-User 2024 & 2032
- Figure 28: Asia Pacific Riot Control System Market Revenue (Million), by Country 2024 & 2032
- Figure 29: Asia Pacific Riot Control System Market Revenue Share (%), by Country 2024 & 2032
- Figure 30: Latin America Riot Control System Market Revenue (Million), by Product Type 2024 & 2032
- Figure 31: Latin America Riot Control System Market Revenue Share (%), by Product Type 2024 & 2032
- Figure 32: Latin America Riot Control System Market Revenue (Million), by End-User 2024 & 2032
- Figure 33: Latin America Riot Control System Market Revenue Share (%), by End-User 2024 & 2032
- Figure 34: Latin America Riot Control System Market Revenue (Million), by Country 2024 & 2032
- Figure 35: Latin America Riot Control System Market Revenue Share (%), by Country 2024 & 2032
- Figure 36: Middle East and Africa Riot Control System Market Revenue (Million), by Product Type 2024 & 2032
- Figure 37: Middle East and Africa Riot Control System Market Revenue Share (%), by Product Type 2024 & 2032
- Figure 38: Middle East and Africa Riot Control System Market Revenue (Million), by End-User 2024 & 2032
- Figure 39: Middle East and Africa Riot Control System Market Revenue Share (%), by End-User 2024 & 2032
- Figure 40: Middle East and Africa Riot Control System Market Revenue (Million), by Country 2024 & 2032
- Figure 41: Middle East and Africa Riot Control System Market Revenue Share (%), by Country 2024 & 2032
List of Tables
- Table 1: Global Riot Control System Market Revenue Million Forecast, by Region 2019 & 2032
- Table 2: Global Riot Control System Market Revenue Million Forecast, by Product Type 2019 & 2032
- Table 3: Global Riot Control System Market Revenue Million Forecast, by End-User 2019 & 2032
- Table 4: Global Riot Control System Market Revenue Million Forecast, by Region 2019 & 2032
- Table 5: Global Riot Control System Market Revenue Million Forecast, by Country 2019 & 2032
- Table 6: United States Riot Control System Market Revenue (Million) Forecast, by Application 2019 & 2032
- Table 7: Canada Riot Control System Market Revenue (Million) Forecast, by Application 2019 & 2032
- Table 8: Global Riot Control System Market Revenue Million Forecast, by Country 2019 & 2032
- Table 9: United Kingdom Riot Control System Market Revenue (Million) Forecast, by Application 2019 & 2032
- Table 10: France Riot Control System Market Revenue (Million) Forecast, by Application 2019 & 2032
- Table 11: Germany Riot Control System Market Revenue (Million) Forecast, by Application 2019 & 2032
- Table 12: Italy Riot Control System Market Revenue (Million) Forecast, by Application 2019 & 2032
- Table 13: Rest of Europe Riot Control System Market Revenue (Million) Forecast, by Application 2019 & 2032
- Table 14: Global Riot Control System Market Revenue Million Forecast, by Country 2019 & 2032
- Table 15: China Riot Control System Market Revenue (Million) Forecast, by Application 2019 & 2032
- Table 16: India Riot Control System Market Revenue (Million) Forecast, by Application 2019 & 2032
- Table 17: Japan Riot Control System Market Revenue (Million) Forecast, by Application 2019 & 2032
- Table 18: South Korea Riot Control System Market Revenue (Million) Forecast, by Application 2019 & 2032
- Table 19: Rest of Asia Pacific Riot Control System Market Revenue (Million) Forecast, by Application 2019 & 2032
- Table 20: Global Riot Control System Market Revenue Million Forecast, by Country 2019 & 2032
- Table 21: Brazil Riot Control System Market Revenue (Million) Forecast, by Application 2019 & 2032
- Table 22: Mexico Riot Control System Market Revenue (Million) Forecast, by Application 2019 & 2032
- Table 23: Rest of Latin America Riot Control System Market Revenue (Million) Forecast, by Application 2019 & 2032
- Table 24: Global Riot Control System Market Revenue Million Forecast, by Country 2019 & 2032
- Table 25: Saudi Arabia Riot Control System Market Revenue (Million) Forecast, by Application 2019 & 2032
- Table 26: United Arab Emirates Riot Control System Market Revenue (Million) Forecast, by Application 2019 & 2032
- Table 27: South Africa Riot Control System Market Revenue (Million) Forecast, by Application 2019 & 2032
- Table 28: Qatar Riot Control System Market Revenue (Million) Forecast, by Application 2019 & 2032
- Table 29: Rest of Middle East and Africa Riot Control System Market Revenue (Million) Forecast, by Application 2019 & 2032
- Table 30: Global Riot Control System Market Revenue Million Forecast, by Product Type 2019 & 2032
- Table 31: Global Riot Control System Market Revenue Million Forecast, by End-User 2019 & 2032
- Table 32: Global Riot Control System Market Revenue Million Forecast, by Country 2019 & 2032
- Table 33: United States Riot Control System Market Revenue (Million) Forecast, by Application 2019 & 2032
- Table 34: Canada Riot Control System Market Revenue (Million) Forecast, by Application 2019 & 2032
- Table 35: Global Riot Control System Market Revenue Million Forecast, by Product Type 2019 & 2032
- Table 36: Global Riot Control System Market Revenue Million Forecast, by End-User 2019 & 2032
- Table 37: Global Riot Control System Market Revenue Million Forecast, by Country 2019 & 2032
- Table 38: United Kingdom Riot Control System Market Revenue (Million) Forecast, by Application 2019 & 2032
- Table 39: France Riot Control System Market Revenue (Million) Forecast, by Application 2019 & 2032
- Table 40: Germany Riot Control System Market Revenue (Million) Forecast, by Application 2019 & 2032
- Table 41: Russia Riot Control System Market Revenue (Million) Forecast, by Application 2019 & 2032
- Table 42: Rest of Europe Riot Control System Market Revenue (Million) Forecast, by Application 2019 & 2032
- Table 43: Global Riot Control System Market Revenue Million Forecast, by Product Type 2019 & 2032
- Table 44: Global Riot Control System Market Revenue Million Forecast, by End-User 2019 & 2032
- Table 45: Global Riot Control System Market Revenue Million Forecast, by Country 2019 & 2032
- Table 46: China Riot Control System Market Revenue (Million) Forecast, by Application 2019 & 2032
- Table 47: India Riot Control System Market Revenue (Million) Forecast, by Application 2019 & 2032
- Table 48: Japan Riot Control System Market Revenue (Million) Forecast, by Application 2019 & 2032
- Table 49: South Korea Riot Control System Market Revenue (Million) Forecast, by Application 2019 & 2032
- Table 50: Rest of Asia Pacific Riot Control System Market Revenue (Million) Forecast, by Application 2019 & 2032
- Table 51: Global Riot Control System Market Revenue Million Forecast, by Product Type 2019 & 2032
- Table 52: Global Riot Control System Market Revenue Million Forecast, by End-User 2019 & 2032
- Table 53: Global Riot Control System Market Revenue Million Forecast, by Country 2019 & 2032
- Table 54: Brazil Riot Control System Market Revenue (Million) Forecast, by Application 2019 & 2032
- Table 55: Rest of Latin America Riot Control System Market Revenue (Million) Forecast, by Application 2019 & 2032
- Table 56: Global Riot Control System Market Revenue Million Forecast, by Product Type 2019 & 2032
- Table 57: Global Riot Control System Market Revenue Million Forecast, by End-User 2019 & 2032
- Table 58: Global Riot Control System Market Revenue Million Forecast, by Country 2019 & 2032
- Table 59: Saudi Arabia Riot Control System Market Revenue (Million) Forecast, by Application 2019 & 2032
- Table 60: United Arab Emirates Riot Control System Market Revenue (Million) Forecast, by Application 2019 & 2032
- Table 61: Israel Riot Control System Market Revenue (Million) Forecast, by Application 2019 & 2032
- Table 62: Rest of Middle East and Africa Riot Control System Market Revenue (Million) Forecast, by Application 2019 & 2032
Frequently Asked Questions
1. What is the projected Compound Annual Growth Rate (CAGR) of the Riot Control System Market?
The projected CAGR is approximately 4.24%.
2. Which companies are prominent players in the Riot Control System Market?
Key companies in the market include Lamperd Less Lethal, PACEM Defense LLC, Desert Wolf, Byrna Technologies Inc, Blackhawk, NonLethal Technologies Inc, Axon Enterprise Inc, Genasys Inc, Etienne Lacroix Group, Condor Non-lethal Technologies, Combined Systems Inc, Safariland LLC.
3. What are the main segments of the Riot Control System Market?
The market segments include Product Type, End-User.
4. Can you provide details about the market size?
The market size is estimated to be USD 7.52 Million as of 2022.
5. What are some drivers contributing to market growth?
N/A
6. What are the notable trends driving market growth?
The Offensive Equipment Segment is Expected to Experience the Highest Growth During the Forecast Period.
7. Are there any restraints impacting market growth?
N/A
8. Can you provide examples of recent developments in the market?
September 2022: BSF launched a tear gas shell-dropping drone system that will be useful for security forces to control protesters and rioters. It can be used for launching shells from an unmanned aerial vehicle (UAV).
9. What pricing options are available for accessing the report?
Pricing options include single-user, multi-user, and enterprise licenses priced at USD 4750, USD 5250, and USD 8750 respectively.
10. Is the market size provided in terms of value or volume?
The market size is provided in terms of value, measured in Million.
11. Are there any specific market keywords associated with the report?
Yes, the market keyword associated with the report is "Riot Control System Market," which aids in identifying and referencing the specific market segment covered.
12. How do I determine which pricing option suits my needs best?
The pricing options vary based on user requirements and access needs. Individual users may opt for single-user licenses, while businesses requiring broader access may choose multi-user or enterprise licenses for cost-effective access to the report.
13. Are there any additional resources or data provided in the Riot Control System Market report?
While the report offers comprehensive insights, it's advisable to review the specific contents or supplementary materials provided to ascertain if additional resources or data are available.
14. How can I stay updated on further developments or reports in the Riot Control System Market?
To stay informed about further developments, trends, and reports in the Riot Control System Market, consider subscribing to industry newsletters, following relevant companies and organizations, or regularly checking reputable industry news sources and publications.
Methodology
Step 1 - Identification of Relevant Samples Size from Population Database


Step 2 - Approaches for Defining Global Market Size (Value, Volume* & Price*)

Note*: In applicable scenarios
Step 3 - Data Sources
Primary Research
- Web Analytics
- Survey Reports
- Research Institute
- Latest Research Reports
- Opinion Leaders
Secondary Research
- Annual Reports
- White Paper
- Latest Press Release
- Industry Association
- Paid Database
- Investor Presentations

Step 4 - Data Triangulation
Involves using different sources of information in order to increase the validity of a study
These sources are likely to be stakeholders in a program - participants, other researchers, program staff, other community members, and so on.
Then we put all data in single framework & apply various statistical tools to find out the dynamic on the market.
During the analysis stage, feedback from the stakeholder groups would be compared to determine areas of agreement as well as areas of divergence


