
Key Insights
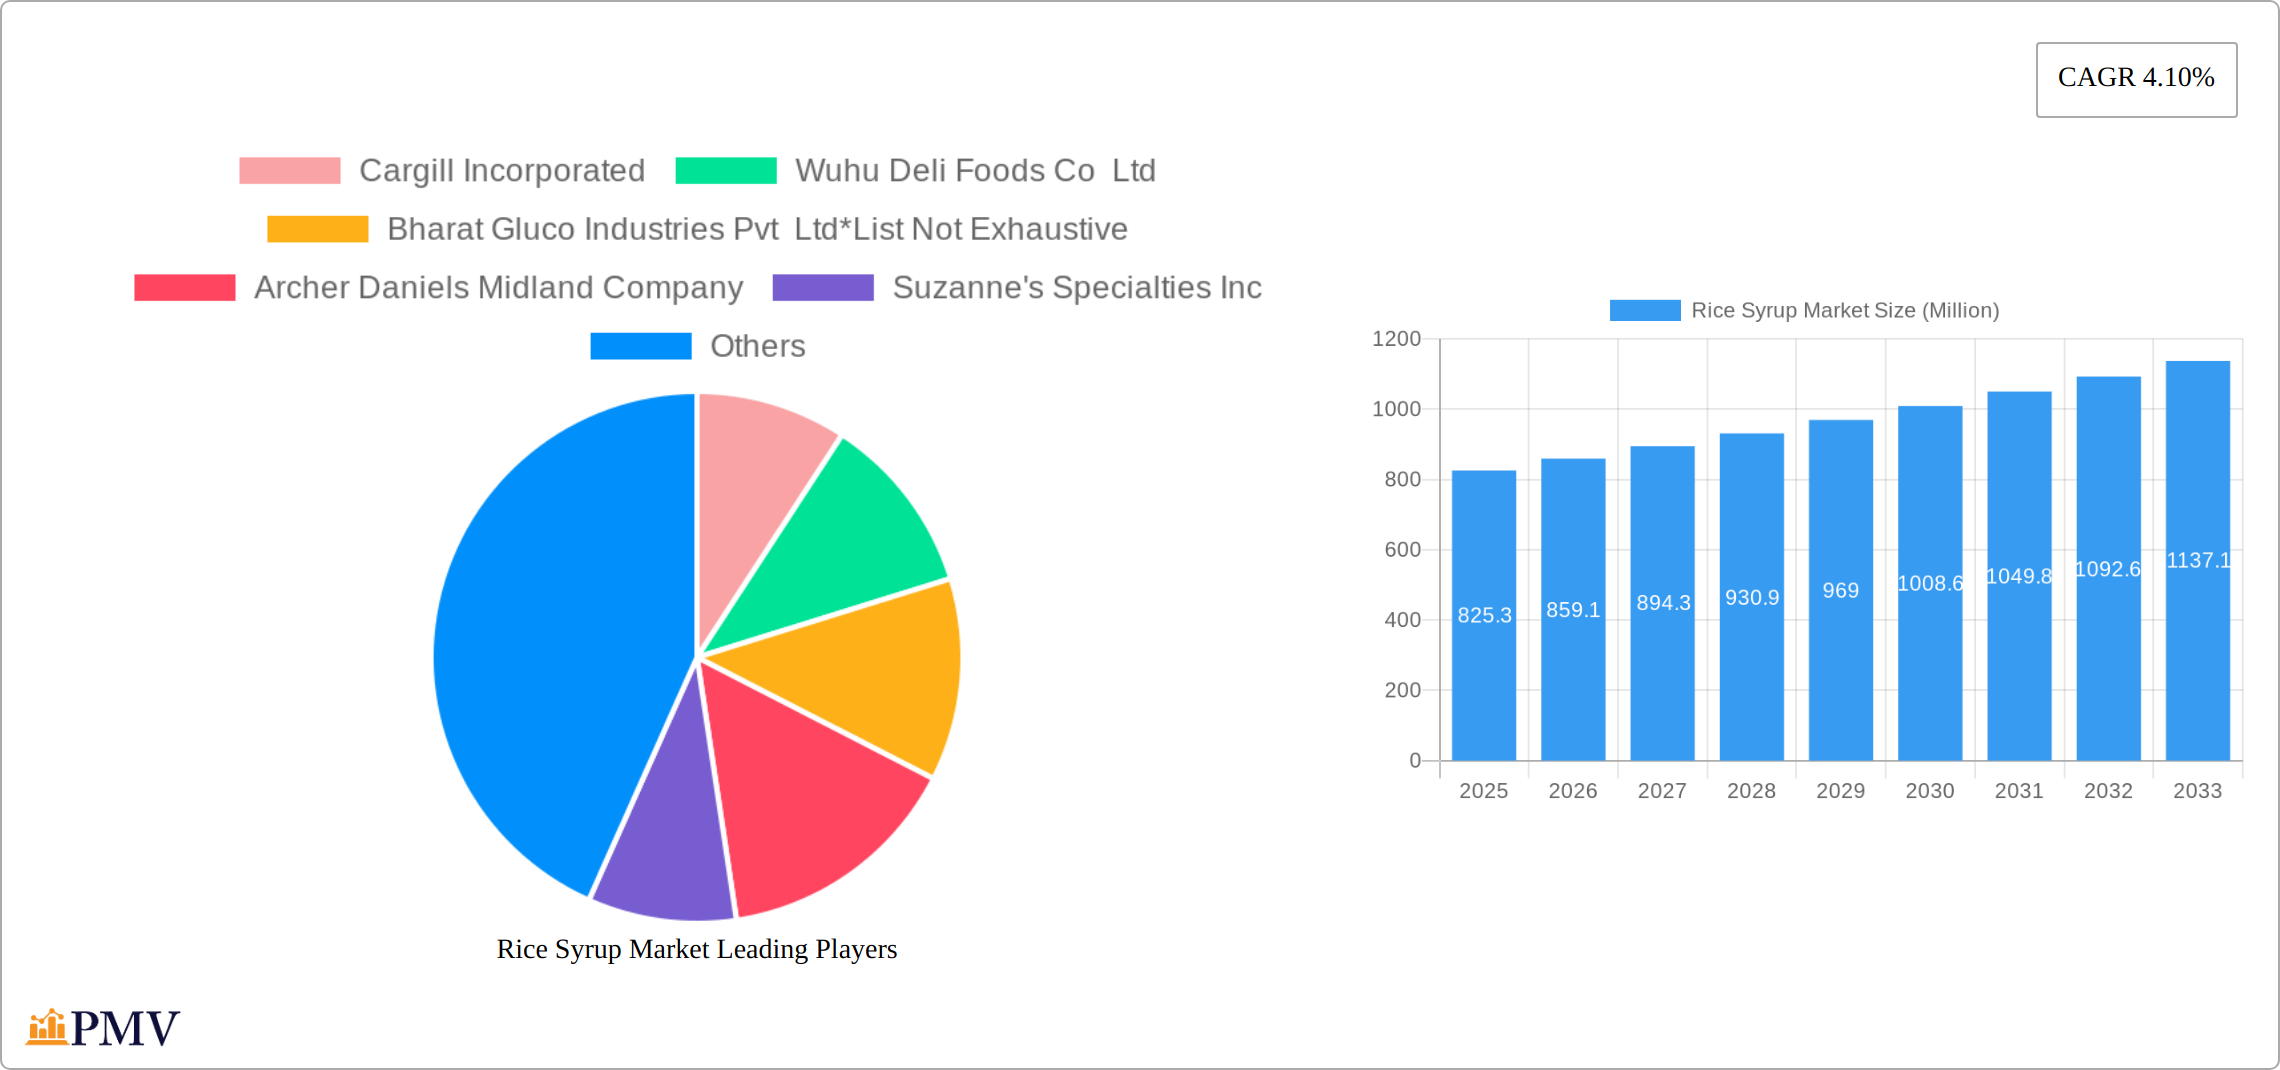
The Rice Syrup Market, valued at $825.3 million in 2025, is poised for steady growth with a Compound Annual Growth Rate (CAGR) of 4.10% from 2025 to 2033. This growth trajectory is driven by increasing consumer demand for natural sweeteners and the expanding use of rice syrup in various applications such as bakery and confectionery, beverages, and dairy products. Key market drivers include the rising awareness of health benefits associated with rice syrup, such as its low glycemic index and suitability for those with dietary restrictions like gluten intolerance. Additionally, the trend towards organic and clean-label products is propelling the demand for organic rice syrup, which is expected to see significant growth within the forecast period.
The market is segmented by application, rice type, and category, with notable segments including bakery and confectionery, brown rice syrup, and organic products. Geographically, North America and Europe hold substantial market shares due to their high consumption of processed foods and a strong inclination towards health-conscious products. However, the Asia Pacific region is anticipated to experience the fastest growth, fueled by the increasing disposable income and changing dietary habits in countries like China and India. Major players in the market, such as Cargill Incorporated, Archer Daniels Midland Company, and Associated British Foods PLC, are focusing on product innovation and strategic expansions to strengthen their market positions. The competitive landscape is characterized by mergers, acquisitions, and collaborations aimed at enhancing product portfolios and expanding global footprints.
The Rice Syrup Market Report offers a comprehensive analysis of the global rice syrup industry, covering market trends, competitive dynamics, and future projections from 2019 to 2033. This report is meticulously crafted to provide actionable insights for stakeholders, including manufacturers, investors, and policymakers. With detailed segmentation by application, rice type, and category, this report serves as an essential tool for understanding the market landscape and identifying growth opportunities.
Rice Syrup Market Market Structure & Competitive Dynamics
The rice syrup market exhibits a moderately concentrated structure, with key players like Cargill Incorporated and Archer Daniels Midland Company commanding substantial market shares. A dynamic innovation ecosystem thrives, fueled by ongoing R&D investments focused on enhancing product quality and expanding applications across diverse food and beverage sectors. While regulatory landscapes vary geographically, a common thread is the emphasis on food safety and clear labeling standards. Competition from substitutes, particularly high fructose corn syrup, remains a factor, however, the inherent natural appeal of rice syrup continues to secure its market position and drive growth.
End-user trends strongly favor organic and clean-label products, significantly impacting product development strategies. The market has witnessed considerable M&A activity in recent years, with transactions reaching values as high as $500 million, reflecting efforts to consolidate market share and bolster production capabilities. Key performance indicators reveal a robust market:
- Market Share Dominance: Cargill Incorporated maintains an estimated 20% share of the global market, highlighting its leading position.
- Strategic Acquisitions: Recent mergers and acquisitions in the sector average approximately $300 million, indicating significant investment and consolidation.
- Innovation Investment: A notable 15% increase in R&D spending over the past five years underscores the commitment to product innovation and improvement.
- Growth Trajectory: The market is projected to experience a robust CAGR of 6.5% from 2025 to 2033, reaching an estimated $2.5 billion by 2033.
Rice Syrup Market Industry Trends & Insights
The rice syrup market is experiencing robust growth, fueled by the escalating consumer preference for natural sweeteners and clean-label products. This trend is projected to drive a Compound Annual Growth Rate (CAGR) of 6.5% from 2025 to 2033, resulting in a market valuation of $2.5 billion by 2033. Technological advancements, such as the adoption of enzyme-based production methods, are boosting efficiency and reducing production costs, further stimulating market expansion.
Consumers are increasingly seeking healthier alternatives, with rice syrup gaining popularity due to its lower glycemic index and non-GMO attributes. The competitive landscape is becoming increasingly intense, prompting companies to invest heavily in product differentiation and strategic market penetration initiatives. North America, with an estimated 35% market penetration rate, exemplifies a mature market, while significant growth potential remains untapped in other regions.
Key trends include the surging demand for organic rice syrup, anticipated to outpace the growth of conventional products due to heightened health consciousness. The Asia-Pacific region is emerging as a significant growth engine, driven by increasing disposable incomes and a rapidly expanding food and beverage industry. This dynamic market presents compelling opportunities for both established players and new entrants.
Dominant Markets & Segments in Rice Syrup Market
The bakery and confectionery sector currently dominates the rice syrup market, leveraging its versatility and aligning with consumer demand for healthier sweetening options. This segment is projected to capture approximately 40% of the total market revenue in 2025. Several key factors contribute to this dominance:
- Supportive Economic Policies: Favorable trade agreements are facilitating increased market access and expansion.
- Robust Infrastructure: Advanced food processing facilities in North America and Europe provide a strong foundation for production and distribution.
- Evolving Consumer Preferences: The persistent demand for natural and organic products is a crucial driver of market growth.
Brown rice syrup is gaining traction due to its perceived health benefits and richer nutrient profile compared to its refined counterparts. The organic segment is experiencing remarkable growth, with a projected CAGR of 7.5% from 2025 to 2033, reflecting the increasing consumer preference for sustainable and environmentally friendly products. North America holds a significant market share, bolstered by well-established food industries and high consumer awareness. However, the Asia-Pacific region, particularly China and India, shows immense potential for future growth, driven by rising health consciousness and a burgeoning food processing sector.
Rice Syrup Market Product Innovations
Recent product innovations within the rice syrup market are primarily focused on enhancing nutritional profiles and expanding the range of applications. Companies are increasingly employing enzyme technology to produce rice syrups with improved sweetness and texture, catering to diverse consumer preferences and dietary needs. These innovations not only address current health trends but also provide a critical competitive advantage by offering unique product attributes that resonate with today's health-conscious consumers.
Report Segmentation & Scope
By Application: The bakery and confectionery segment is the largest, with a projected market size of $1 Billion by 2033. This segment's growth is driven by the demand for natural sweeteners in baked goods and candies.
By Rice Type: Brown rice syrup is gaining popularity, with an expected market size of $800 Million by 2033. Its health benefits, such as a lower glycemic index, are key growth factors.
By Category: The organic segment is poised for significant growth, projected to reach $700 Million by 2033. Consumer preference for organic products and sustainable practices fuels this growth.
Key Drivers of Rice Syrup Market Growth
Key drivers of the rice syrup market include technological advancements in production processes, economic factors such as rising disposable incomes, and regulatory support for natural sweeteners. For instance, enzyme technology has revolutionized rice syrup production, making it more cost-effective and scalable. Economic growth in emerging markets like China and India is boosting demand for processed foods, where rice syrup is a preferred ingredient. Regulatory bodies in several countries are promoting healthier food options, further propelling market growth.
Challenges in the Rice Syrup Market Sector
The rice syrup market faces several challenges, including stringent regulatory standards that can hinder market entry and expansion. Supply chain disruptions, particularly in raw material sourcing, pose significant risks, potentially impacting production costs and availability. Competitive pressures from alternative sweeteners, such as agave and maple syrups, are intensifying, necessitating continuous innovation and marketing efforts to maintain market share.
Leading Players in the Rice Syrup Market Market
- Cargill Incorporated
- Wuhu Deli Foods Co Ltd
- Bharat Gluco Industries Pvt Ltd
- Archer Daniels Midland Company
- Suzanne's Specialties Inc
- Pure Life Organic Foods Ltd
- Associated British Foods PLC
- Axiom Foods Inc
- California Natural Products Inc
- Gulshan Polyols Ltd
Key Developments in Rice Syrup Market Sector
- January 2023: Cargill Incorporated launched a new line of organic rice syrup, strategically expanding its product portfolio to meet the growing demand for organic sweeteners.
- March 2022: Archer Daniels Midland Company acquired a rice syrup manufacturer, significantly enhancing its production capacity and market reach.
- June 2021: Axiom Foods Inc. introduced a novel enzyme-based rice syrup, improving product quality and bolstering its market competitiveness.
- [Add more recent developments here, if available] Include dates, company names, and a brief description of the development.
Strategic Rice Syrup Market Market Outlook
The rice syrup market is poised for significant growth over the forecast period, driven by increasing consumer awareness of health and wellness. Strategic opportunities lie in expanding product offerings to include organic and specialty varieties, tapping into emerging markets, and leveraging technological advancements to enhance production efficiency. The market's future potential is promising, with a focus on sustainable practices and innovation expected to accelerate growth and market penetration.
Rice Syrup Market Segmentation
-
1. Rice Type
- 1.1. Brown Rice
- 1.2. White Rice
-
2. Category
- 2.1. Organic
- 2.2. Conventional
-
3. Application
- 3.1. Bakery and Confectionery
- 3.2. Beverages
- 3.3. Dessert and Dairy
- 3.4. Meat, Poultry, and Seafood
- 3.5. Instant Formula
- 3.6. Other Applications
Rice Syrup Market Segmentation By Geography
-
1. North America
- 1.1. United States
- 1.2. Canada
- 1.3. Mexico
- 1.4. Rest of North America
-
2. Europe
- 2.1. Germany
- 2.2. United Kingdom
- 2.3. France
- 2.4. Russia
- 2.5. Spain
- 2.6. Rest of Europe
-
3. Asia Pacific
- 3.1. China
- 3.2. Japan
- 3.3. India
- 3.4. Australia
- 3.5. Rest of Asia Pacific
-
4. South America
- 4.1. Brazil
- 4.2. Argentina
- 4.3. Rest of South America
-
5. Middle East and Africa
- 5.1. Saudi Arabia
- 5.2. South Africa
- 5.3. Rest of Middle East and Africa

Rice Syrup Market REPORT HIGHLIGHTS
| Aspects | Details |
|---|---|
| Study Period | 2019-2033 |
| Base Year | 2024 |
| Estimated Year | 2025 |
| Forecast Period | 2025-2033 |
| Historical Period | 2019-2024 |
| Growth Rate | CAGR of 4.10% from 2019-2033 |
| Segmentation |
|
Table of Contents
- 1. Introduction
- 1.1. Research Scope
- 1.2. Market Segmentation
- 1.3. Research Methodology
- 1.4. Definitions and Assumptions
- 2. Executive Summary
- 2.1. Introduction
- 3. Market Dynamics
- 3.1. Introduction
- 3.2. Market Drivers
- 3.2.1. Increasing Demand For Convenience & Processed Food
- 3.3. Market Restrains
- 3.3.1. Increased Consumer Awareness On Side-Effects Of Chemical Additives
- 3.4. Market Trends
- 3.4.1. Rising Demand for Natural Sweetener
- 4. Market Factor Analysis
- 4.1. Porters Five Forces
- 4.2. Supply/Value Chain
- 4.3. PESTEL analysis
- 4.4. Market Entropy
- 4.5. Patent/Trademark Analysis
- 5. Global Rice Syrup Market Analysis, Insights and Forecast, 2019-2031
- 5.1. Market Analysis, Insights and Forecast - by Rice Type
- 5.1.1. Brown Rice
- 5.1.2. White Rice
- 5.2. Market Analysis, Insights and Forecast - by Category
- 5.2.1. Organic
- 5.2.2. Conventional
- 5.3. Market Analysis, Insights and Forecast - by Application
- 5.3.1. Bakery and Confectionery
- 5.3.2. Beverages
- 5.3.3. Dessert and Dairy
- 5.3.4. Meat, Poultry, and Seafood
- 5.3.5. Instant Formula
- 5.3.6. Other Applications
- 5.4. Market Analysis, Insights and Forecast - by Region
- 5.4.1. North America
- 5.4.2. Europe
- 5.4.3. Asia Pacific
- 5.4.4. South America
- 5.4.5. Middle East and Africa
- 5.1. Market Analysis, Insights and Forecast - by Rice Type
- 6. North America Rice Syrup Market Analysis, Insights and Forecast, 2019-2031
- 6.1. Market Analysis, Insights and Forecast - by Rice Type
- 6.1.1. Brown Rice
- 6.1.2. White Rice
- 6.2. Market Analysis, Insights and Forecast - by Category
- 6.2.1. Organic
- 6.2.2. Conventional
- 6.3. Market Analysis, Insights and Forecast - by Application
- 6.3.1. Bakery and Confectionery
- 6.3.2. Beverages
- 6.3.3. Dessert and Dairy
- 6.3.4. Meat, Poultry, and Seafood
- 6.3.5. Instant Formula
- 6.3.6. Other Applications
- 6.1. Market Analysis, Insights and Forecast - by Rice Type
- 7. Europe Rice Syrup Market Analysis, Insights and Forecast, 2019-2031
- 7.1. Market Analysis, Insights and Forecast - by Rice Type
- 7.1.1. Brown Rice
- 7.1.2. White Rice
- 7.2. Market Analysis, Insights and Forecast - by Category
- 7.2.1. Organic
- 7.2.2. Conventional
- 7.3. Market Analysis, Insights and Forecast - by Application
- 7.3.1. Bakery and Confectionery
- 7.3.2. Beverages
- 7.3.3. Dessert and Dairy
- 7.3.4. Meat, Poultry, and Seafood
- 7.3.5. Instant Formula
- 7.3.6. Other Applications
- 7.1. Market Analysis, Insights and Forecast - by Rice Type
- 8. Asia Pacific Rice Syrup Market Analysis, Insights and Forecast, 2019-2031
- 8.1. Market Analysis, Insights and Forecast - by Rice Type
- 8.1.1. Brown Rice
- 8.1.2. White Rice
- 8.2. Market Analysis, Insights and Forecast - by Category
- 8.2.1. Organic
- 8.2.2. Conventional
- 8.3. Market Analysis, Insights and Forecast - by Application
- 8.3.1. Bakery and Confectionery
- 8.3.2. Beverages
- 8.3.3. Dessert and Dairy
- 8.3.4. Meat, Poultry, and Seafood
- 8.3.5. Instant Formula
- 8.3.6. Other Applications
- 8.1. Market Analysis, Insights and Forecast - by Rice Type
- 9. South America Rice Syrup Market Analysis, Insights and Forecast, 2019-2031
- 9.1. Market Analysis, Insights and Forecast - by Rice Type
- 9.1.1. Brown Rice
- 9.1.2. White Rice
- 9.2. Market Analysis, Insights and Forecast - by Category
- 9.2.1. Organic
- 9.2.2. Conventional
- 9.3. Market Analysis, Insights and Forecast - by Application
- 9.3.1. Bakery and Confectionery
- 9.3.2. Beverages
- 9.3.3. Dessert and Dairy
- 9.3.4. Meat, Poultry, and Seafood
- 9.3.5. Instant Formula
- 9.3.6. Other Applications
- 9.1. Market Analysis, Insights and Forecast - by Rice Type
- 10. Middle East and Africa Rice Syrup Market Analysis, Insights and Forecast, 2019-2031
- 10.1. Market Analysis, Insights and Forecast - by Rice Type
- 10.1.1. Brown Rice
- 10.1.2. White Rice
- 10.2. Market Analysis, Insights and Forecast - by Category
- 10.2.1. Organic
- 10.2.2. Conventional
- 10.3. Market Analysis, Insights and Forecast - by Application
- 10.3.1. Bakery and Confectionery
- 10.3.2. Beverages
- 10.3.3. Dessert and Dairy
- 10.3.4. Meat, Poultry, and Seafood
- 10.3.5. Instant Formula
- 10.3.6. Other Applications
- 10.1. Market Analysis, Insights and Forecast - by Rice Type
- 11. North America Rice Syrup Market Analysis, Insights and Forecast, 2019-2031
- 11.1. Market Analysis, Insights and Forecast - By Country/Sub-region
- 11.1.1 United States
- 11.1.2 Canada
- 11.1.3 Mexico
- 11.1.4 Rest of North America
- 12. Europe Rice Syrup Market Analysis, Insights and Forecast, 2019-2031
- 12.1. Market Analysis, Insights and Forecast - By Country/Sub-region
- 12.1.1 Germany
- 12.1.2 United Kingdom
- 12.1.3 France
- 12.1.4 Russia
- 12.1.5 Spain
- 12.1.6 Rest of Europe
- 13. Asia Pacific Rice Syrup Market Analysis, Insights and Forecast, 2019-2031
- 13.1. Market Analysis, Insights and Forecast - By Country/Sub-region
- 13.1.1 China
- 13.1.2 Japan
- 13.1.3 India
- 13.1.4 Australia
- 13.1.5 Rest of Asia Pacific
- 14. South America Rice Syrup Market Analysis, Insights and Forecast, 2019-2031
- 14.1. Market Analysis, Insights and Forecast - By Country/Sub-region
- 14.1.1 Brazil
- 14.1.2 Argentina
- 14.1.3 Rest of South America
- 15. Middle East and Africa Rice Syrup Market Analysis, Insights and Forecast, 2019-2031
- 15.1. Market Analysis, Insights and Forecast - By Country/Sub-region
- 15.1.1 Saudi Arabia
- 15.1.2 South Africa
- 15.1.3 Rest of Middle East and Africa
- 16. Competitive Analysis
- 16.1. Global Market Share Analysis 2024
- 16.2. Company Profiles
- 16.2.1 Cargill Incorporated
- 16.2.1.1. Overview
- 16.2.1.2. Products
- 16.2.1.3. SWOT Analysis
- 16.2.1.4. Recent Developments
- 16.2.1.5. Financials (Based on Availability)
- 16.2.2 Wuhu Deli Foods Co Ltd
- 16.2.2.1. Overview
- 16.2.2.2. Products
- 16.2.2.3. SWOT Analysis
- 16.2.2.4. Recent Developments
- 16.2.2.5. Financials (Based on Availability)
- 16.2.3 Bharat Gluco Industries Pvt Ltd*List Not Exhaustive
- 16.2.3.1. Overview
- 16.2.3.2. Products
- 16.2.3.3. SWOT Analysis
- 16.2.3.4. Recent Developments
- 16.2.3.5. Financials (Based on Availability)
- 16.2.4 Archer Daniels Midland Company
- 16.2.4.1. Overview
- 16.2.4.2. Products
- 16.2.4.3. SWOT Analysis
- 16.2.4.4. Recent Developments
- 16.2.4.5. Financials (Based on Availability)
- 16.2.5 Suzanne's Specialties Inc
- 16.2.5.1. Overview
- 16.2.5.2. Products
- 16.2.5.3. SWOT Analysis
- 16.2.5.4. Recent Developments
- 16.2.5.5. Financials (Based on Availability)
- 16.2.6 Pure Life Organic Foods Ltd
- 16.2.6.1. Overview
- 16.2.6.2. Products
- 16.2.6.3. SWOT Analysis
- 16.2.6.4. Recent Developments
- 16.2.6.5. Financials (Based on Availability)
- 16.2.7 Associated British Foods PLC
- 16.2.7.1. Overview
- 16.2.7.2. Products
- 16.2.7.3. SWOT Analysis
- 16.2.7.4. Recent Developments
- 16.2.7.5. Financials (Based on Availability)
- 16.2.8 Axiom Foods Inc
- 16.2.8.1. Overview
- 16.2.8.2. Products
- 16.2.8.3. SWOT Analysis
- 16.2.8.4. Recent Developments
- 16.2.8.5. Financials (Based on Availability)
- 16.2.9 California Natural Products Inc
- 16.2.9.1. Overview
- 16.2.9.2. Products
- 16.2.9.3. SWOT Analysis
- 16.2.9.4. Recent Developments
- 16.2.9.5. Financials (Based on Availability)
- 16.2.10 Gulshan Polyols Ltd
- 16.2.10.1. Overview
- 16.2.10.2. Products
- 16.2.10.3. SWOT Analysis
- 16.2.10.4. Recent Developments
- 16.2.10.5. Financials (Based on Availability)
- 16.2.1 Cargill Incorporated
List of Figures
- Figure 1: Global Rice Syrup Market Revenue Breakdown (Million, %) by Region 2024 & 2032
- Figure 2: Global Rice Syrup Market Volume Breakdown (Liters, %) by Region 2024 & 2032
- Figure 3: North America Rice Syrup Market Revenue (Million), by Country 2024 & 2032
- Figure 4: North America Rice Syrup Market Volume (Liters), by Country 2024 & 2032
- Figure 5: North America Rice Syrup Market Revenue Share (%), by Country 2024 & 2032
- Figure 6: North America Rice Syrup Market Volume Share (%), by Country 2024 & 2032
- Figure 7: Europe Rice Syrup Market Revenue (Million), by Country 2024 & 2032
- Figure 8: Europe Rice Syrup Market Volume (Liters), by Country 2024 & 2032
- Figure 9: Europe Rice Syrup Market Revenue Share (%), by Country 2024 & 2032
- Figure 10: Europe Rice Syrup Market Volume Share (%), by Country 2024 & 2032
- Figure 11: Asia Pacific Rice Syrup Market Revenue (Million), by Country 2024 & 2032
- Figure 12: Asia Pacific Rice Syrup Market Volume (Liters), by Country 2024 & 2032
- Figure 13: Asia Pacific Rice Syrup Market Revenue Share (%), by Country 2024 & 2032
- Figure 14: Asia Pacific Rice Syrup Market Volume Share (%), by Country 2024 & 2032
- Figure 15: South America Rice Syrup Market Revenue (Million), by Country 2024 & 2032
- Figure 16: South America Rice Syrup Market Volume (Liters), by Country 2024 & 2032
- Figure 17: South America Rice Syrup Market Revenue Share (%), by Country 2024 & 2032
- Figure 18: South America Rice Syrup Market Volume Share (%), by Country 2024 & 2032
- Figure 19: Middle East and Africa Rice Syrup Market Revenue (Million), by Country 2024 & 2032
- Figure 20: Middle East and Africa Rice Syrup Market Volume (Liters), by Country 2024 & 2032
- Figure 21: Middle East and Africa Rice Syrup Market Revenue Share (%), by Country 2024 & 2032
- Figure 22: Middle East and Africa Rice Syrup Market Volume Share (%), by Country 2024 & 2032
- Figure 23: North America Rice Syrup Market Revenue (Million), by Rice Type 2024 & 2032
- Figure 24: North America Rice Syrup Market Volume (Liters), by Rice Type 2024 & 2032
- Figure 25: North America Rice Syrup Market Revenue Share (%), by Rice Type 2024 & 2032
- Figure 26: North America Rice Syrup Market Volume Share (%), by Rice Type 2024 & 2032
- Figure 27: North America Rice Syrup Market Revenue (Million), by Category 2024 & 2032
- Figure 28: North America Rice Syrup Market Volume (Liters), by Category 2024 & 2032
- Figure 29: North America Rice Syrup Market Revenue Share (%), by Category 2024 & 2032
- Figure 30: North America Rice Syrup Market Volume Share (%), by Category 2024 & 2032
- Figure 31: North America Rice Syrup Market Revenue (Million), by Application 2024 & 2032
- Figure 32: North America Rice Syrup Market Volume (Liters), by Application 2024 & 2032
- Figure 33: North America Rice Syrup Market Revenue Share (%), by Application 2024 & 2032
- Figure 34: North America Rice Syrup Market Volume Share (%), by Application 2024 & 2032
- Figure 35: North America Rice Syrup Market Revenue (Million), by Country 2024 & 2032
- Figure 36: North America Rice Syrup Market Volume (Liters), by Country 2024 & 2032
- Figure 37: North America Rice Syrup Market Revenue Share (%), by Country 2024 & 2032
- Figure 38: North America Rice Syrup Market Volume Share (%), by Country 2024 & 2032
- Figure 39: Europe Rice Syrup Market Revenue (Million), by Rice Type 2024 & 2032
- Figure 40: Europe Rice Syrup Market Volume (Liters), by Rice Type 2024 & 2032
- Figure 41: Europe Rice Syrup Market Revenue Share (%), by Rice Type 2024 & 2032
- Figure 42: Europe Rice Syrup Market Volume Share (%), by Rice Type 2024 & 2032
- Figure 43: Europe Rice Syrup Market Revenue (Million), by Category 2024 & 2032
- Figure 44: Europe Rice Syrup Market Volume (Liters), by Category 2024 & 2032
- Figure 45: Europe Rice Syrup Market Revenue Share (%), by Category 2024 & 2032
- Figure 46: Europe Rice Syrup Market Volume Share (%), by Category 2024 & 2032
- Figure 47: Europe Rice Syrup Market Revenue (Million), by Application 2024 & 2032
- Figure 48: Europe Rice Syrup Market Volume (Liters), by Application 2024 & 2032
- Figure 49: Europe Rice Syrup Market Revenue Share (%), by Application 2024 & 2032
- Figure 50: Europe Rice Syrup Market Volume Share (%), by Application 2024 & 2032
- Figure 51: Europe Rice Syrup Market Revenue (Million), by Country 2024 & 2032
- Figure 52: Europe Rice Syrup Market Volume (Liters), by Country 2024 & 2032
- Figure 53: Europe Rice Syrup Market Revenue Share (%), by Country 2024 & 2032
- Figure 54: Europe Rice Syrup Market Volume Share (%), by Country 2024 & 2032
- Figure 55: Asia Pacific Rice Syrup Market Revenue (Million), by Rice Type 2024 & 2032
- Figure 56: Asia Pacific Rice Syrup Market Volume (Liters), by Rice Type 2024 & 2032
- Figure 57: Asia Pacific Rice Syrup Market Revenue Share (%), by Rice Type 2024 & 2032
- Figure 58: Asia Pacific Rice Syrup Market Volume Share (%), by Rice Type 2024 & 2032
- Figure 59: Asia Pacific Rice Syrup Market Revenue (Million), by Category 2024 & 2032
- Figure 60: Asia Pacific Rice Syrup Market Volume (Liters), by Category 2024 & 2032
- Figure 61: Asia Pacific Rice Syrup Market Revenue Share (%), by Category 2024 & 2032
- Figure 62: Asia Pacific Rice Syrup Market Volume Share (%), by Category 2024 & 2032
- Figure 63: Asia Pacific Rice Syrup Market Revenue (Million), by Application 2024 & 2032
- Figure 64: Asia Pacific Rice Syrup Market Volume (Liters), by Application 2024 & 2032
- Figure 65: Asia Pacific Rice Syrup Market Revenue Share (%), by Application 2024 & 2032
- Figure 66: Asia Pacific Rice Syrup Market Volume Share (%), by Application 2024 & 2032
- Figure 67: Asia Pacific Rice Syrup Market Revenue (Million), by Country 2024 & 2032
- Figure 68: Asia Pacific Rice Syrup Market Volume (Liters), by Country 2024 & 2032
- Figure 69: Asia Pacific Rice Syrup Market Revenue Share (%), by Country 2024 & 2032
- Figure 70: Asia Pacific Rice Syrup Market Volume Share (%), by Country 2024 & 2032
- Figure 71: South America Rice Syrup Market Revenue (Million), by Rice Type 2024 & 2032
- Figure 72: South America Rice Syrup Market Volume (Liters), by Rice Type 2024 & 2032
- Figure 73: South America Rice Syrup Market Revenue Share (%), by Rice Type 2024 & 2032
- Figure 74: South America Rice Syrup Market Volume Share (%), by Rice Type 2024 & 2032
- Figure 75: South America Rice Syrup Market Revenue (Million), by Category 2024 & 2032
- Figure 76: South America Rice Syrup Market Volume (Liters), by Category 2024 & 2032
- Figure 77: South America Rice Syrup Market Revenue Share (%), by Category 2024 & 2032
- Figure 78: South America Rice Syrup Market Volume Share (%), by Category 2024 & 2032
- Figure 79: South America Rice Syrup Market Revenue (Million), by Application 2024 & 2032
- Figure 80: South America Rice Syrup Market Volume (Liters), by Application 2024 & 2032
- Figure 81: South America Rice Syrup Market Revenue Share (%), by Application 2024 & 2032
- Figure 82: South America Rice Syrup Market Volume Share (%), by Application 2024 & 2032
- Figure 83: South America Rice Syrup Market Revenue (Million), by Country 2024 & 2032
- Figure 84: South America Rice Syrup Market Volume (Liters), by Country 2024 & 2032
- Figure 85: South America Rice Syrup Market Revenue Share (%), by Country 2024 & 2032
- Figure 86: South America Rice Syrup Market Volume Share (%), by Country 2024 & 2032
- Figure 87: Middle East and Africa Rice Syrup Market Revenue (Million), by Rice Type 2024 & 2032
- Figure 88: Middle East and Africa Rice Syrup Market Volume (Liters), by Rice Type 2024 & 2032
- Figure 89: Middle East and Africa Rice Syrup Market Revenue Share (%), by Rice Type 2024 & 2032
- Figure 90: Middle East and Africa Rice Syrup Market Volume Share (%), by Rice Type 2024 & 2032
- Figure 91: Middle East and Africa Rice Syrup Market Revenue (Million), by Category 2024 & 2032
- Figure 92: Middle East and Africa Rice Syrup Market Volume (Liters), by Category 2024 & 2032
- Figure 93: Middle East and Africa Rice Syrup Market Revenue Share (%), by Category 2024 & 2032
- Figure 94: Middle East and Africa Rice Syrup Market Volume Share (%), by Category 2024 & 2032
- Figure 95: Middle East and Africa Rice Syrup Market Revenue (Million), by Application 2024 & 2032
- Figure 96: Middle East and Africa Rice Syrup Market Volume (Liters), by Application 2024 & 2032
- Figure 97: Middle East and Africa Rice Syrup Market Revenue Share (%), by Application 2024 & 2032
- Figure 98: Middle East and Africa Rice Syrup Market Volume Share (%), by Application 2024 & 2032
- Figure 99: Middle East and Africa Rice Syrup Market Revenue (Million), by Country 2024 & 2032
- Figure 100: Middle East and Africa Rice Syrup Market Volume (Liters), by Country 2024 & 2032
- Figure 101: Middle East and Africa Rice Syrup Market Revenue Share (%), by Country 2024 & 2032
- Figure 102: Middle East and Africa Rice Syrup Market Volume Share (%), by Country 2024 & 2032
List of Tables
- Table 1: Global Rice Syrup Market Revenue Million Forecast, by Region 2019 & 2032
- Table 2: Global Rice Syrup Market Volume Liters Forecast, by Region 2019 & 2032
- Table 3: Global Rice Syrup Market Revenue Million Forecast, by Rice Type 2019 & 2032
- Table 4: Global Rice Syrup Market Volume Liters Forecast, by Rice Type 2019 & 2032
- Table 5: Global Rice Syrup Market Revenue Million Forecast, by Category 2019 & 2032
- Table 6: Global Rice Syrup Market Volume Liters Forecast, by Category 2019 & 2032
- Table 7: Global Rice Syrup Market Revenue Million Forecast, by Application 2019 & 2032
- Table 8: Global Rice Syrup Market Volume Liters Forecast, by Application 2019 & 2032
- Table 9: Global Rice Syrup Market Revenue Million Forecast, by Region 2019 & 2032
- Table 10: Global Rice Syrup Market Volume Liters Forecast, by Region 2019 & 2032
- Table 11: Global Rice Syrup Market Revenue Million Forecast, by Country 2019 & 2032
- Table 12: Global Rice Syrup Market Volume Liters Forecast, by Country 2019 & 2032
- Table 13: United States Rice Syrup Market Revenue (Million) Forecast, by Application 2019 & 2032
- Table 14: United States Rice Syrup Market Volume (Liters) Forecast, by Application 2019 & 2032
- Table 15: Canada Rice Syrup Market Revenue (Million) Forecast, by Application 2019 & 2032
- Table 16: Canada Rice Syrup Market Volume (Liters) Forecast, by Application 2019 & 2032
- Table 17: Mexico Rice Syrup Market Revenue (Million) Forecast, by Application 2019 & 2032
- Table 18: Mexico Rice Syrup Market Volume (Liters) Forecast, by Application 2019 & 2032
- Table 19: Rest of North America Rice Syrup Market Revenue (Million) Forecast, by Application 2019 & 2032
- Table 20: Rest of North America Rice Syrup Market Volume (Liters) Forecast, by Application 2019 & 2032
- Table 21: Global Rice Syrup Market Revenue Million Forecast, by Country 2019 & 2032
- Table 22: Global Rice Syrup Market Volume Liters Forecast, by Country 2019 & 2032
- Table 23: Germany Rice Syrup Market Revenue (Million) Forecast, by Application 2019 & 2032
- Table 24: Germany Rice Syrup Market Volume (Liters) Forecast, by Application 2019 & 2032
- Table 25: United Kingdom Rice Syrup Market Revenue (Million) Forecast, by Application 2019 & 2032
- Table 26: United Kingdom Rice Syrup Market Volume (Liters) Forecast, by Application 2019 & 2032
- Table 27: France Rice Syrup Market Revenue (Million) Forecast, by Application 2019 & 2032
- Table 28: France Rice Syrup Market Volume (Liters) Forecast, by Application 2019 & 2032
- Table 29: Russia Rice Syrup Market Revenue (Million) Forecast, by Application 2019 & 2032
- Table 30: Russia Rice Syrup Market Volume (Liters) Forecast, by Application 2019 & 2032
- Table 31: Spain Rice Syrup Market Revenue (Million) Forecast, by Application 2019 & 2032
- Table 32: Spain Rice Syrup Market Volume (Liters) Forecast, by Application 2019 & 2032
- Table 33: Rest of Europe Rice Syrup Market Revenue (Million) Forecast, by Application 2019 & 2032
- Table 34: Rest of Europe Rice Syrup Market Volume (Liters) Forecast, by Application 2019 & 2032
- Table 35: Global Rice Syrup Market Revenue Million Forecast, by Country 2019 & 2032
- Table 36: Global Rice Syrup Market Volume Liters Forecast, by Country 2019 & 2032
- Table 37: China Rice Syrup Market Revenue (Million) Forecast, by Application 2019 & 2032
- Table 38: China Rice Syrup Market Volume (Liters) Forecast, by Application 2019 & 2032
- Table 39: Japan Rice Syrup Market Revenue (Million) Forecast, by Application 2019 & 2032
- Table 40: Japan Rice Syrup Market Volume (Liters) Forecast, by Application 2019 & 2032
- Table 41: India Rice Syrup Market Revenue (Million) Forecast, by Application 2019 & 2032
- Table 42: India Rice Syrup Market Volume (Liters) Forecast, by Application 2019 & 2032
- Table 43: Australia Rice Syrup Market Revenue (Million) Forecast, by Application 2019 & 2032
- Table 44: Australia Rice Syrup Market Volume (Liters) Forecast, by Application 2019 & 2032
- Table 45: Rest of Asia Pacific Rice Syrup Market Revenue (Million) Forecast, by Application 2019 & 2032
- Table 46: Rest of Asia Pacific Rice Syrup Market Volume (Liters) Forecast, by Application 2019 & 2032
- Table 47: Global Rice Syrup Market Revenue Million Forecast, by Country 2019 & 2032
- Table 48: Global Rice Syrup Market Volume Liters Forecast, by Country 2019 & 2032
- Table 49: Brazil Rice Syrup Market Revenue (Million) Forecast, by Application 2019 & 2032
- Table 50: Brazil Rice Syrup Market Volume (Liters) Forecast, by Application 2019 & 2032
- Table 51: Argentina Rice Syrup Market Revenue (Million) Forecast, by Application 2019 & 2032
- Table 52: Argentina Rice Syrup Market Volume (Liters) Forecast, by Application 2019 & 2032
- Table 53: Rest of South America Rice Syrup Market Revenue (Million) Forecast, by Application 2019 & 2032
- Table 54: Rest of South America Rice Syrup Market Volume (Liters) Forecast, by Application 2019 & 2032
- Table 55: Global Rice Syrup Market Revenue Million Forecast, by Country 2019 & 2032
- Table 56: Global Rice Syrup Market Volume Liters Forecast, by Country 2019 & 2032
- Table 57: Saudi Arabia Rice Syrup Market Revenue (Million) Forecast, by Application 2019 & 2032
- Table 58: Saudi Arabia Rice Syrup Market Volume (Liters) Forecast, by Application 2019 & 2032
- Table 59: South Africa Rice Syrup Market Revenue (Million) Forecast, by Application 2019 & 2032
- Table 60: South Africa Rice Syrup Market Volume (Liters) Forecast, by Application 2019 & 2032
- Table 61: Rest of Middle East and Africa Rice Syrup Market Revenue (Million) Forecast, by Application 2019 & 2032
- Table 62: Rest of Middle East and Africa Rice Syrup Market Volume (Liters) Forecast, by Application 2019 & 2032
- Table 63: Global Rice Syrup Market Revenue Million Forecast, by Rice Type 2019 & 2032
- Table 64: Global Rice Syrup Market Volume Liters Forecast, by Rice Type 2019 & 2032
- Table 65: Global Rice Syrup Market Revenue Million Forecast, by Category 2019 & 2032
- Table 66: Global Rice Syrup Market Volume Liters Forecast, by Category 2019 & 2032
- Table 67: Global Rice Syrup Market Revenue Million Forecast, by Application 2019 & 2032
- Table 68: Global Rice Syrup Market Volume Liters Forecast, by Application 2019 & 2032
- Table 69: Global Rice Syrup Market Revenue Million Forecast, by Country 2019 & 2032
- Table 70: Global Rice Syrup Market Volume Liters Forecast, by Country 2019 & 2032
- Table 71: United States Rice Syrup Market Revenue (Million) Forecast, by Application 2019 & 2032
- Table 72: United States Rice Syrup Market Volume (Liters) Forecast, by Application 2019 & 2032
- Table 73: Canada Rice Syrup Market Revenue (Million) Forecast, by Application 2019 & 2032
- Table 74: Canada Rice Syrup Market Volume (Liters) Forecast, by Application 2019 & 2032
- Table 75: Mexico Rice Syrup Market Revenue (Million) Forecast, by Application 2019 & 2032
- Table 76: Mexico Rice Syrup Market Volume (Liters) Forecast, by Application 2019 & 2032
- Table 77: Rest of North America Rice Syrup Market Revenue (Million) Forecast, by Application 2019 & 2032
- Table 78: Rest of North America Rice Syrup Market Volume (Liters) Forecast, by Application 2019 & 2032
- Table 79: Global Rice Syrup Market Revenue Million Forecast, by Rice Type 2019 & 2032
- Table 80: Global Rice Syrup Market Volume Liters Forecast, by Rice Type 2019 & 2032
- Table 81: Global Rice Syrup Market Revenue Million Forecast, by Category 2019 & 2032
- Table 82: Global Rice Syrup Market Volume Liters Forecast, by Category 2019 & 2032
- Table 83: Global Rice Syrup Market Revenue Million Forecast, by Application 2019 & 2032
- Table 84: Global Rice Syrup Market Volume Liters Forecast, by Application 2019 & 2032
- Table 85: Global Rice Syrup Market Revenue Million Forecast, by Country 2019 & 2032
- Table 86: Global Rice Syrup Market Volume Liters Forecast, by Country 2019 & 2032
- Table 87: Germany Rice Syrup Market Revenue (Million) Forecast, by Application 2019 & 2032
- Table 88: Germany Rice Syrup Market Volume (Liters) Forecast, by Application 2019 & 2032
- Table 89: United Kingdom Rice Syrup Market Revenue (Million) Forecast, by Application 2019 & 2032
- Table 90: United Kingdom Rice Syrup Market Volume (Liters) Forecast, by Application 2019 & 2032
- Table 91: France Rice Syrup Market Revenue (Million) Forecast, by Application 2019 & 2032
- Table 92: France Rice Syrup Market Volume (Liters) Forecast, by Application 2019 & 2032
- Table 93: Russia Rice Syrup Market Revenue (Million) Forecast, by Application 2019 & 2032
- Table 94: Russia Rice Syrup Market Volume (Liters) Forecast, by Application 2019 & 2032
- Table 95: Spain Rice Syrup Market Revenue (Million) Forecast, by Application 2019 & 2032
- Table 96: Spain Rice Syrup Market Volume (Liters) Forecast, by Application 2019 & 2032
- Table 97: Rest of Europe Rice Syrup Market Revenue (Million) Forecast, by Application 2019 & 2032
- Table 98: Rest of Europe Rice Syrup Market Volume (Liters) Forecast, by Application 2019 & 2032
- Table 99: Global Rice Syrup Market Revenue Million Forecast, by Rice Type 2019 & 2032
- Table 100: Global Rice Syrup Market Volume Liters Forecast, by Rice Type 2019 & 2032
- Table 101: Global Rice Syrup Market Revenue Million Forecast, by Category 2019 & 2032
- Table 102: Global Rice Syrup Market Volume Liters Forecast, by Category 2019 & 2032
- Table 103: Global Rice Syrup Market Revenue Million Forecast, by Application 2019 & 2032
- Table 104: Global Rice Syrup Market Volume Liters Forecast, by Application 2019 & 2032
- Table 105: Global Rice Syrup Market Revenue Million Forecast, by Country 2019 & 2032
- Table 106: Global Rice Syrup Market Volume Liters Forecast, by Country 2019 & 2032
- Table 107: China Rice Syrup Market Revenue (Million) Forecast, by Application 2019 & 2032
- Table 108: China Rice Syrup Market Volume (Liters) Forecast, by Application 2019 & 2032
- Table 109: Japan Rice Syrup Market Revenue (Million) Forecast, by Application 2019 & 2032
- Table 110: Japan Rice Syrup Market Volume (Liters) Forecast, by Application 2019 & 2032
- Table 111: India Rice Syrup Market Revenue (Million) Forecast, by Application 2019 & 2032
- Table 112: India Rice Syrup Market Volume (Liters) Forecast, by Application 2019 & 2032
- Table 113: Australia Rice Syrup Market Revenue (Million) Forecast, by Application 2019 & 2032
- Table 114: Australia Rice Syrup Market Volume (Liters) Forecast, by Application 2019 & 2032
- Table 115: Rest of Asia Pacific Rice Syrup Market Revenue (Million) Forecast, by Application 2019 & 2032
- Table 116: Rest of Asia Pacific Rice Syrup Market Volume (Liters) Forecast, by Application 2019 & 2032
- Table 117: Global Rice Syrup Market Revenue Million Forecast, by Rice Type 2019 & 2032
- Table 118: Global Rice Syrup Market Volume Liters Forecast, by Rice Type 2019 & 2032
- Table 119: Global Rice Syrup Market Revenue Million Forecast, by Category 2019 & 2032
- Table 120: Global Rice Syrup Market Volume Liters Forecast, by Category 2019 & 2032
- Table 121: Global Rice Syrup Market Revenue Million Forecast, by Application 2019 & 2032
- Table 122: Global Rice Syrup Market Volume Liters Forecast, by Application 2019 & 2032
- Table 123: Global Rice Syrup Market Revenue Million Forecast, by Country 2019 & 2032
- Table 124: Global Rice Syrup Market Volume Liters Forecast, by Country 2019 & 2032
- Table 125: Brazil Rice Syrup Market Revenue (Million) Forecast, by Application 2019 & 2032
- Table 126: Brazil Rice Syrup Market Volume (Liters) Forecast, by Application 2019 & 2032
- Table 127: Argentina Rice Syrup Market Revenue (Million) Forecast, by Application 2019 & 2032
- Table 128: Argentina Rice Syrup Market Volume (Liters) Forecast, by Application 2019 & 2032
- Table 129: Rest of South America Rice Syrup Market Revenue (Million) Forecast, by Application 2019 & 2032
- Table 130: Rest of South America Rice Syrup Market Volume (Liters) Forecast, by Application 2019 & 2032
- Table 131: Global Rice Syrup Market Revenue Million Forecast, by Rice Type 2019 & 2032
- Table 132: Global Rice Syrup Market Volume Liters Forecast, by Rice Type 2019 & 2032
- Table 133: Global Rice Syrup Market Revenue Million Forecast, by Category 2019 & 2032
- Table 134: Global Rice Syrup Market Volume Liters Forecast, by Category 2019 & 2032
- Table 135: Global Rice Syrup Market Revenue Million Forecast, by Application 2019 & 2032
- Table 136: Global Rice Syrup Market Volume Liters Forecast, by Application 2019 & 2032
- Table 137: Global Rice Syrup Market Revenue Million Forecast, by Country 2019 & 2032
- Table 138: Global Rice Syrup Market Volume Liters Forecast, by Country 2019 & 2032
- Table 139: Saudi Arabia Rice Syrup Market Revenue (Million) Forecast, by Application 2019 & 2032
- Table 140: Saudi Arabia Rice Syrup Market Volume (Liters) Forecast, by Application 2019 & 2032
- Table 141: South Africa Rice Syrup Market Revenue (Million) Forecast, by Application 2019 & 2032
- Table 142: South Africa Rice Syrup Market Volume (Liters) Forecast, by Application 2019 & 2032
- Table 143: Rest of Middle East and Africa Rice Syrup Market Revenue (Million) Forecast, by Application 2019 & 2032
- Table 144: Rest of Middle East and Africa Rice Syrup Market Volume (Liters) Forecast, by Application 2019 & 2032
Frequently Asked Questions
1. What is the projected Compound Annual Growth Rate (CAGR) of the Rice Syrup Market?
The projected CAGR is approximately 4.10%.
2. Which companies are prominent players in the Rice Syrup Market?
Key companies in the market include Cargill Incorporated, Wuhu Deli Foods Co Ltd, Bharat Gluco Industries Pvt Ltd*List Not Exhaustive, Archer Daniels Midland Company, Suzanne's Specialties Inc, Pure Life Organic Foods Ltd, Associated British Foods PLC, Axiom Foods Inc, California Natural Products Inc, Gulshan Polyols Ltd.
3. What are the main segments of the Rice Syrup Market?
The market segments include Rice Type, Category , Application.
4. Can you provide details about the market size?
The market size is estimated to be USD 825.3 Million as of 2022.
5. What are some drivers contributing to market growth?
Increasing Demand For Convenience & Processed Food.
6. What are the notable trends driving market growth?
Rising Demand for Natural Sweetener.
7. Are there any restraints impacting market growth?
Increased Consumer Awareness On Side-Effects Of Chemical Additives.
8. Can you provide examples of recent developments in the market?
N/A
9. What pricing options are available for accessing the report?
Pricing options include single-user, multi-user, and enterprise licenses priced at USD 4750, USD 5250, and USD 8750 respectively.
10. Is the market size provided in terms of value or volume?
The market size is provided in terms of value, measured in Million and volume, measured in Liters.
11. Are there any specific market keywords associated with the report?
Yes, the market keyword associated with the report is "Rice Syrup Market," which aids in identifying and referencing the specific market segment covered.
12. How do I determine which pricing option suits my needs best?
The pricing options vary based on user requirements and access needs. Individual users may opt for single-user licenses, while businesses requiring broader access may choose multi-user or enterprise licenses for cost-effective access to the report.
13. Are there any additional resources or data provided in the Rice Syrup Market report?
While the report offers comprehensive insights, it's advisable to review the specific contents or supplementary materials provided to ascertain if additional resources or data are available.
14. How can I stay updated on further developments or reports in the Rice Syrup Market?
To stay informed about further developments, trends, and reports in the Rice Syrup Market, consider subscribing to industry newsletters, following relevant companies and organizations, or regularly checking reputable industry news sources and publications.
Methodology
Step 1 - Identification of Relevant Samples Size from Population Database


Step 2 - Approaches for Defining Global Market Size (Value, Volume* & Price*)

Note*: In applicable scenarios
Step 3 - Data Sources
Primary Research
- Web Analytics
- Survey Reports
- Research Institute
- Latest Research Reports
- Opinion Leaders
Secondary Research
- Annual Reports
- White Paper
- Latest Press Release
- Industry Association
- Paid Database
- Investor Presentations

Step 4 - Data Triangulation
Involves using different sources of information in order to increase the validity of a study
These sources are likely to be stakeholders in a program - participants, other researchers, program staff, other community members, and so on.
Then we put all data in single framework & apply various statistical tools to find out the dynamic on the market.
During the analysis stage, feedback from the stakeholder groups would be compared to determine areas of agreement as well as areas of divergence


