
Key Insights
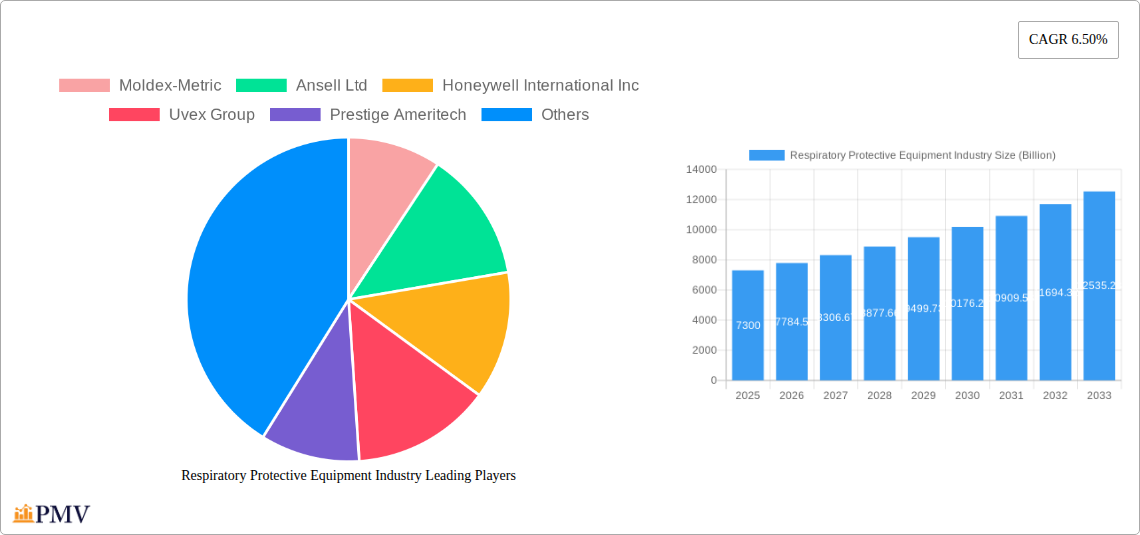
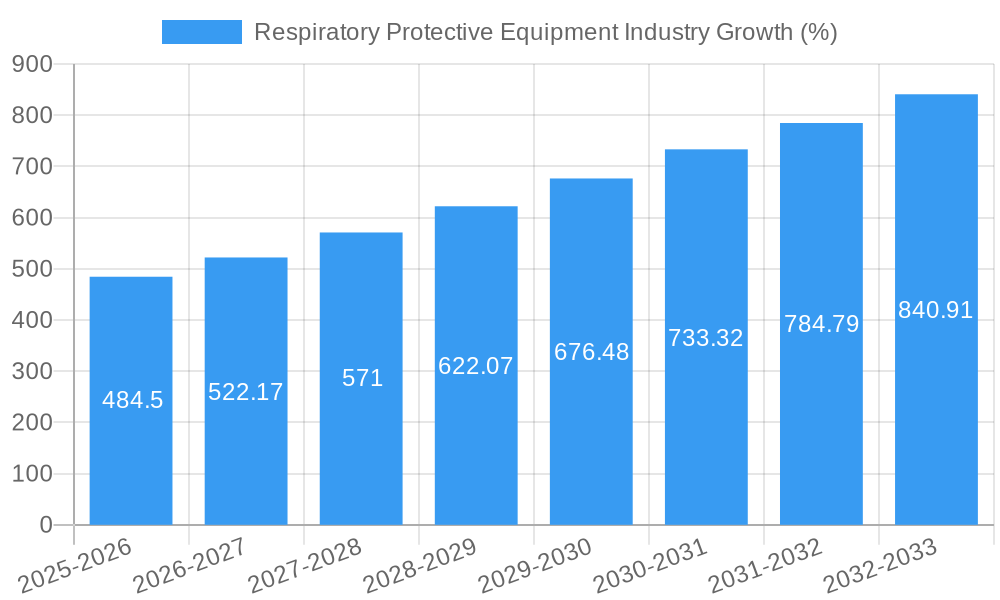
The Respiratory Protective Equipment (RPE) market, valued at $7.3 billion in 2025, is projected to experience robust growth, driven by a compound annual growth rate (CAGR) of 6.50% from 2025 to 2033. This expansion is fueled by several key factors. Increased awareness of occupational hazards and stringent government regulations mandating RPE use across various industries, particularly healthcare and manufacturing, are primary drivers. The rising prevalence of respiratory illnesses, including chronic obstructive pulmonary disease (COPD) and asthma, further contributes to demand. Furthermore, technological advancements leading to the development of lighter, more comfortable, and technologically advanced respirators, such as those incorporating smart sensor technology for improved monitoring and safety, are shaping market growth. Growth is also being propelled by the increasing adoption of respirators in emerging economies due to rising industrialization and urbanization.
However, the market faces some challenges. High initial investment costs associated with purchasing and maintaining high-quality RPE can be a barrier, especially for small and medium-sized enterprises (SMEs). Moreover, the effectiveness of RPE relies heavily on proper training and usage; inadequate training can limit the market's potential. Competitive pricing pressures from manufacturers in developing countries may also influence market dynamics. Nevertheless, the overall market outlook remains positive, with significant potential for growth across different segments, including air-purifying respirators (APRs) and atmosphere-supplying respirators (ASRs), catering to diverse end-user needs in medical, manufacturing, and other sectors. Market segmentation by region reveals strong growth potential in Asia-Pacific, driven by rapid industrialization and a large working-age population.
Respiratory Protective Equipment Industry Market Report: 2019-2033
This comprehensive report provides a detailed analysis of the Respiratory Protective Equipment (RPE) industry, offering invaluable insights for businesses, investors, and stakeholders. The report covers the period from 2019 to 2033, with a focus on the forecast period of 2025-2033 and a base year of 2025. The global market is estimated to be worth $XX Billion in 2025. This in-depth analysis examines market structure, competitive dynamics, key trends, leading players, and future growth prospects, incorporating crucial data points for informed decision-making.
Respiratory Protective Equipment Industry Market Structure & Competitive Dynamics
The Respiratory Protective Equipment market is characterized by a moderately concentrated landscape with several multinational corporations holding significant market share. Major players such as 3M, Honeywell International Inc, and Ansell Ltd. dominate the market, leveraging their established brand reputation, extensive distribution networks, and robust R&D capabilities. However, smaller specialized companies also play a role, particularly in niche segments. Market share analysis reveals that the top five players collectively account for approximately XX% of the global market. The industry witnesses considerable M&A activity, with deal values exceeding $XX Billion in the past five years, largely driven by strategic expansion and technological integration. Regulatory frameworks, such as those set by NIOSH and other international bodies, significantly influence product development and market access. Product substitution, mainly from emerging technologies such as advanced filtration materials and smart sensor integration, is continuously reshaping the market. End-user trends, including heightened awareness of occupational health and safety and increasing adoption of RPE across diverse industries, fuel market growth.
- Market Concentration: High, with top 5 players holding XX% market share.
- Innovation Ecosystems: Active, with ongoing R&D in filtration technology and smart sensors.
- Regulatory Frameworks: Stringent, impacting product development and market access.
- Product Substitutes: Emerging, driven by technological advancements.
- End-User Trends: Growing demand from healthcare, manufacturing, and other sectors.
- M&A Activity: Significant, with deal values exceeding $XX Billion in the past five years.
Respiratory Protective Equipment Industry Industry Trends & Insights
The Respiratory Protective Equipment industry is experiencing robust growth, driven by several key factors. The rising prevalence of respiratory illnesses, coupled with stringent occupational safety regulations globally, is a major catalyst. Technological advancements, such as the development of more efficient filtration materials and the integration of smart sensors in respirators, are enhancing product performance and user experience. Consumer preferences are shifting towards lightweight, comfortable, and technologically advanced respirators that offer superior protection and ease of use. The industry is witnessing increased competition, with companies focusing on product innovation, brand building, and strategic partnerships to gain market share. The Compound Annual Growth Rate (CAGR) for the RPE market is projected to be XX% during the forecast period (2025-2033). Market penetration is highest in developed countries with robust occupational safety standards, and is expected to increase rapidly in developing economies. Competitive dynamics are shaped by pricing strategies, product differentiation, and strategic alliances.
Dominant Markets & Segments in Respiratory Protective Equipment Industry
The global Respiratory Protective Equipment market is geographically diverse, with significant regional variations in demand and market dynamics. North America and Europe currently represent the largest markets, driven by strong regulatory frameworks and high awareness of respiratory health issues. However, Asia-Pacific is expected to experience the fastest growth rate during the forecast period due to rapid industrialization, rising disposable incomes, and increasing awareness of occupational safety.
By Product Type:
- Air-purifying Respirators (APRs): This segment holds the largest market share, driven by cost-effectiveness and suitability for various applications. Key drivers include increasing awareness of airborne hazards in various industries.
- Atmosphere-supplying Respirators (ASRs): This segment exhibits strong growth potential, particularly in hazardous environments requiring complete respiratory protection. Growth is driven by increasing demand in industries with high-risk environments.
By End User:
- Medical and Healthcare: This sector is a major consumer of RPE, driven by the need to protect healthcare workers from infectious diseases and airborne contaminants. Government initiatives supporting healthcare infrastructure are key drivers.
- Manufacturing Industry: Stringent safety regulations and exposure to various hazards in manufacturing settings fuel demand for RPE in this sector. Economic growth and industrial expansion are significant drivers.
- Other End Users: This segment encompasses various industries such as construction, mining, and agriculture, showing steady growth driven by increasing awareness of occupational safety and rising regulations.
Respiratory Protective Equipment Industry Product Innovations
Recent product innovations in the RPE industry focus on improving comfort, efficiency, and user experience. This includes the development of lighter weight materials, improved filtration technologies, and the incorporation of smart sensors for real-time monitoring of air quality and respirator performance. Several companies have introduced respirators with enhanced features such as transparent windows for improved visibility, adjustable head harnesses for better fit, and latex-free designs to minimize allergies. These innovations are driving market growth by catering to diverse user needs and enhancing workplace safety.
Report Segmentation & Scope
This report segments the Respiratory Protective Equipment market by product type (Air-purifying Respirators and Atmosphere-supplying Respirators) and by end-user (Medical and Healthcare, Manufacturing Industry, and Other End Users). Each segment’s analysis includes market size, growth projections, competitive landscape, and key drivers. The report covers the historical period (2019-2024), the base year (2025), and the forecast period (2025-2033). Growth projections are based on various factors, including market trends, technological advancements, regulatory changes, and economic conditions. The competitive dynamics within each segment are analyzed to identify key players and their strategies.
Key Drivers of Respiratory Protective Equipment Industry Growth
Several factors contribute to the growth of the Respiratory Protective Equipment industry. Stringent government regulations mandating the use of RPE in various industries are a major driver. Increased awareness of respiratory health risks among workers and the public is also contributing to higher demand. Technological advancements, such as the development of more comfortable and efficient respirators, are further boosting market growth. Furthermore, the growing prevalence of respiratory diseases and the expansion of industries like healthcare and manufacturing are creating significant opportunities for growth.
Challenges in the Respiratory Protective Equipment Industry Sector
The Respiratory Protective Equipment industry faces several challenges. Supply chain disruptions, particularly during periods of high demand, can impact product availability and pricing. Stringent regulatory requirements and compliance costs can increase production expenses. Furthermore, intense competition among established players and new entrants necessitates continuous innovation and cost optimization to maintain profitability and market share. These factors can potentially restrict market growth if not adequately addressed.
Leading Players in the Respiratory Protective Equipment Industry Market
- Moldex-Metric
- Ansell Ltd
- Honeywell International Inc
- Uvex Group
- Prestige Ameritech
- 3M
- Bullard
- DuPont
- Dragerwerk AG & Company KGaA
- ILC Dover LLP
Key Developments in Respiratory Protective Equipment Industry Sector
- August 2022: Optrel launched P.Air Clear, a NIOSH-approved N95 respirator with a transparent window, latex-free head harness, and adjustable nose clip. This launch broadened the availability of comfortable and effective N95 respirators.
- May 2022: Honeywell launched a new N95 respirator (DC365 Small Surgical N95 Respirator) and a new half-mask respirator (RU8500X series) to meet the needs of healthcare workers. These new product offerings improved product choices within the market.
Strategic Respiratory Protective Equipment Industry Market Outlook
The future of the Respiratory Protective Equipment market looks promising, with continued growth driven by technological advancements, increasing regulatory scrutiny, and a heightened focus on workplace safety. Strategic opportunities exist for companies that can innovate to develop more comfortable, efficient, and technologically advanced respirators. Expansion into emerging markets and strategic partnerships to broaden distribution networks will also play a crucial role in future success. Focusing on sustainable and eco-friendly materials will also be increasingly important in the future.
Respiratory Protective Equipment Industry Segmentation
-
1. Product Type
- 1.1. Air-purifying Respirators (APRs)
- 1.2. Atmosphere-supplying Respirators (ASRs)
-
2. End User
- 2.1. Medical and Healthcare
- 2.2. Manufacturing Industry
- 2.3. Other End Users
Respiratory Protective Equipment Industry Segmentation By Geography
-
1. North America
- 1.1. United States
- 1.2. Canada
- 1.3. Mexico
-
2. Europe
- 2.1. Germany
- 2.2. United Kingdom
- 2.3. France
- 2.4. Italy
- 2.5. Spain
- 2.6. Rest of Europe
-
3. Asia Pacific
- 3.1. China
- 3.2. Japan
- 3.3. India
- 3.4. Australia
- 3.5. South Korea
- 3.6. Rest of Asia Pacific
-
4. Middle East and Africa
- 4.1. GCC
- 4.2. South Africa
- 4.3. Rest of Middle East and Africa
-
5. South America
- 5.1. Brazil
- 5.2. Argentina
- 5.3. Rest of South America

Respiratory Protective Equipment Industry REPORT HIGHLIGHTS
| Aspects | Details |
|---|---|
| Study Period | 2019-2033 |
| Base Year | 2024 |
| Estimated Year | 2025 |
| Forecast Period | 2025-2033 |
| Historical Period | 2019-2024 |
| Growth Rate | CAGR of 6.50% from 2019-2033 |
| Segmentation |
|
Table of Contents
- 1. Introduction
- 1.1. Research Scope
- 1.2. Market Segmentation
- 1.3. Research Methodology
- 1.4. Definitions and Assumptions
- 2. Executive Summary
- 2.1. Introduction
- 3. Market Dynamics
- 3.1. Introduction
- 3.2. Market Drivers
- 3.2.1 Growing Burden of Pandemic and Epidemic Diseases; Increasing Demand for Surgical Procedures
- 3.2.2 Including Minimally Invasive; Increasing Importance Given to Workplace Safety
- 3.3. Market Restrains
- 3.3.1. High Cost of Respirators and Presence of Substandard Respirators; Issues Regarding Disposal and Reusability
- 3.4. Market Trends
- 3.4.1. Air-purifying Respirator is Expected to Hold a Significant Share in the Market During the Forecast Period
- 4. Market Factor Analysis
- 4.1. Porters Five Forces
- 4.2. Supply/Value Chain
- 4.3. PESTEL analysis
- 4.4. Market Entropy
- 4.5. Patent/Trademark Analysis
- 5. Global Respiratory Protective Equipment Industry Analysis, Insights and Forecast, 2019-2031
- 5.1. Market Analysis, Insights and Forecast - by Product Type
- 5.1.1. Air-purifying Respirators (APRs)
- 5.1.2. Atmosphere-supplying Respirators (ASRs)
- 5.2. Market Analysis, Insights and Forecast - by End User
- 5.2.1. Medical and Healthcare
- 5.2.2. Manufacturing Industry
- 5.2.3. Other End Users
- 5.3. Market Analysis, Insights and Forecast - by Region
- 5.3.1. North America
- 5.3.2. Europe
- 5.3.3. Asia Pacific
- 5.3.4. Middle East and Africa
- 5.3.5. South America
- 5.1. Market Analysis, Insights and Forecast - by Product Type
- 6. North America Respiratory Protective Equipment Industry Analysis, Insights and Forecast, 2019-2031
- 6.1. Market Analysis, Insights and Forecast - by Product Type
- 6.1.1. Air-purifying Respirators (APRs)
- 6.1.2. Atmosphere-supplying Respirators (ASRs)
- 6.2. Market Analysis, Insights and Forecast - by End User
- 6.2.1. Medical and Healthcare
- 6.2.2. Manufacturing Industry
- 6.2.3. Other End Users
- 6.1. Market Analysis, Insights and Forecast - by Product Type
- 7. Europe Respiratory Protective Equipment Industry Analysis, Insights and Forecast, 2019-2031
- 7.1. Market Analysis, Insights and Forecast - by Product Type
- 7.1.1. Air-purifying Respirators (APRs)
- 7.1.2. Atmosphere-supplying Respirators (ASRs)
- 7.2. Market Analysis, Insights and Forecast - by End User
- 7.2.1. Medical and Healthcare
- 7.2.2. Manufacturing Industry
- 7.2.3. Other End Users
- 7.1. Market Analysis, Insights and Forecast - by Product Type
- 8. Asia Pacific Respiratory Protective Equipment Industry Analysis, Insights and Forecast, 2019-2031
- 8.1. Market Analysis, Insights and Forecast - by Product Type
- 8.1.1. Air-purifying Respirators (APRs)
- 8.1.2. Atmosphere-supplying Respirators (ASRs)
- 8.2. Market Analysis, Insights and Forecast - by End User
- 8.2.1. Medical and Healthcare
- 8.2.2. Manufacturing Industry
- 8.2.3. Other End Users
- 8.1. Market Analysis, Insights and Forecast - by Product Type
- 9. Middle East and Africa Respiratory Protective Equipment Industry Analysis, Insights and Forecast, 2019-2031
- 9.1. Market Analysis, Insights and Forecast - by Product Type
- 9.1.1. Air-purifying Respirators (APRs)
- 9.1.2. Atmosphere-supplying Respirators (ASRs)
- 9.2. Market Analysis, Insights and Forecast - by End User
- 9.2.1. Medical and Healthcare
- 9.2.2. Manufacturing Industry
- 9.2.3. Other End Users
- 9.1. Market Analysis, Insights and Forecast - by Product Type
- 10. South America Respiratory Protective Equipment Industry Analysis, Insights and Forecast, 2019-2031
- 10.1. Market Analysis, Insights and Forecast - by Product Type
- 10.1.1. Air-purifying Respirators (APRs)
- 10.1.2. Atmosphere-supplying Respirators (ASRs)
- 10.2. Market Analysis, Insights and Forecast - by End User
- 10.2.1. Medical and Healthcare
- 10.2.2. Manufacturing Industry
- 10.2.3. Other End Users
- 10.1. Market Analysis, Insights and Forecast - by Product Type
- 11. North America Respiratory Protective Equipment Industry Analysis, Insights and Forecast, 2019-2031
- 11.1. Market Analysis, Insights and Forecast - By Country/Sub-region
- 11.1.1 United States
- 11.1.2 Canada
- 11.1.3 Mexico
- 12. South America Respiratory Protective Equipment Industry Analysis, Insights and Forecast, 2019-2031
- 12.1. Market Analysis, Insights and Forecast - By Country/Sub-region
- 12.1.1 Brazil
- 12.1.2 Mexico
- 12.1.3 Rest of South America
- 13. Europe Respiratory Protective Equipment Industry Analysis, Insights and Forecast, 2019-2031
- 13.1. Market Analysis, Insights and Forecast - By Country/Sub-region
- 13.1.1 United Kingdom
- 13.1.2 Germany
- 13.1.3 France
- 13.1.4 Italy
- 13.1.5 Spain
- 13.1.6 Russia
- 13.1.7 Rest of Europe
- 14. Asia Pacific Respiratory Protective Equipment Industry Analysis, Insights and Forecast, 2019-2031
- 14.1. Market Analysis, Insights and Forecast - By Country/Sub-region
- 14.1.1 China
- 14.1.2 Japan
- 14.1.3 India
- 14.1.4 South Korea
- 14.1.5 Taiwan
- 14.1.6 Australia
- 14.1.7 Rest of Asia-Pacific
- 15. MEA Respiratory Protective Equipment Industry Analysis, Insights and Forecast, 2019-2031
- 15.1. Market Analysis, Insights and Forecast - By Country/Sub-region
- 15.1.1 Middle East
- 15.1.2 Africa
- 16. Competitive Analysis
- 16.1. Global Market Share Analysis 2024
- 16.2. Company Profiles
- 16.2.1 Moldex-Metric
- 16.2.1.1. Overview
- 16.2.1.2. Products
- 16.2.1.3. SWOT Analysis
- 16.2.1.4. Recent Developments
- 16.2.1.5. Financials (Based on Availability)
- 16.2.2 Ansell Ltd
- 16.2.2.1. Overview
- 16.2.2.2. Products
- 16.2.2.3. SWOT Analysis
- 16.2.2.4. Recent Developments
- 16.2.2.5. Financials (Based on Availability)
- 16.2.3 Honeywell International Inc
- 16.2.3.1. Overview
- 16.2.3.2. Products
- 16.2.3.3. SWOT Analysis
- 16.2.3.4. Recent Developments
- 16.2.3.5. Financials (Based on Availability)
- 16.2.4 Uvex Group
- 16.2.4.1. Overview
- 16.2.4.2. Products
- 16.2.4.3. SWOT Analysis
- 16.2.4.4. Recent Developments
- 16.2.4.5. Financials (Based on Availability)
- 16.2.5 Prestige Ameritech
- 16.2.5.1. Overview
- 16.2.5.2. Products
- 16.2.5.3. SWOT Analysis
- 16.2.5.4. Recent Developments
- 16.2.5.5. Financials (Based on Availability)
- 16.2.6 3M
- 16.2.6.1. Overview
- 16.2.6.2. Products
- 16.2.6.3. SWOT Analysis
- 16.2.6.4. Recent Developments
- 16.2.6.5. Financials (Based on Availability)
- 16.2.7 Bullard
- 16.2.7.1. Overview
- 16.2.7.2. Products
- 16.2.7.3. SWOT Analysis
- 16.2.7.4. Recent Developments
- 16.2.7.5. Financials (Based on Availability)
- 16.2.8 DuPont
- 16.2.8.1. Overview
- 16.2.8.2. Products
- 16.2.8.3. SWOT Analysis
- 16.2.8.4. Recent Developments
- 16.2.8.5. Financials (Based on Availability)
- 16.2.9 Dragerwerk AG & Company KGaA
- 16.2.9.1. Overview
- 16.2.9.2. Products
- 16.2.9.3. SWOT Analysis
- 16.2.9.4. Recent Developments
- 16.2.9.5. Financials (Based on Availability)
- 16.2.10 ILC Dover LLP
- 16.2.10.1. Overview
- 16.2.10.2. Products
- 16.2.10.3. SWOT Analysis
- 16.2.10.4. Recent Developments
- 16.2.10.5. Financials (Based on Availability)
- 16.2.1 Moldex-Metric
List of Figures
- Figure 1: Global Respiratory Protective Equipment Industry Revenue Breakdown (Billion, %) by Region 2024 & 2032
- Figure 2: Global Respiratory Protective Equipment Industry Volume Breakdown (K Units, %) by Region 2024 & 2032
- Figure 3: North America Respiratory Protective Equipment Industry Revenue (Billion), by Country 2024 & 2032
- Figure 4: North America Respiratory Protective Equipment Industry Volume (K Units), by Country 2024 & 2032
- Figure 5: North America Respiratory Protective Equipment Industry Revenue Share (%), by Country 2024 & 2032
- Figure 6: North America Respiratory Protective Equipment Industry Volume Share (%), by Country 2024 & 2032
- Figure 7: South America Respiratory Protective Equipment Industry Revenue (Billion), by Country 2024 & 2032
- Figure 8: South America Respiratory Protective Equipment Industry Volume (K Units), by Country 2024 & 2032
- Figure 9: South America Respiratory Protective Equipment Industry Revenue Share (%), by Country 2024 & 2032
- Figure 10: South America Respiratory Protective Equipment Industry Volume Share (%), by Country 2024 & 2032
- Figure 11: Europe Respiratory Protective Equipment Industry Revenue (Billion), by Country 2024 & 2032
- Figure 12: Europe Respiratory Protective Equipment Industry Volume (K Units), by Country 2024 & 2032
- Figure 13: Europe Respiratory Protective Equipment Industry Revenue Share (%), by Country 2024 & 2032
- Figure 14: Europe Respiratory Protective Equipment Industry Volume Share (%), by Country 2024 & 2032
- Figure 15: Asia Pacific Respiratory Protective Equipment Industry Revenue (Billion), by Country 2024 & 2032
- Figure 16: Asia Pacific Respiratory Protective Equipment Industry Volume (K Units), by Country 2024 & 2032
- Figure 17: Asia Pacific Respiratory Protective Equipment Industry Revenue Share (%), by Country 2024 & 2032
- Figure 18: Asia Pacific Respiratory Protective Equipment Industry Volume Share (%), by Country 2024 & 2032
- Figure 19: MEA Respiratory Protective Equipment Industry Revenue (Billion), by Country 2024 & 2032
- Figure 20: MEA Respiratory Protective Equipment Industry Volume (K Units), by Country 2024 & 2032
- Figure 21: MEA Respiratory Protective Equipment Industry Revenue Share (%), by Country 2024 & 2032
- Figure 22: MEA Respiratory Protective Equipment Industry Volume Share (%), by Country 2024 & 2032
- Figure 23: North America Respiratory Protective Equipment Industry Revenue (Billion), by Product Type 2024 & 2032
- Figure 24: North America Respiratory Protective Equipment Industry Volume (K Units), by Product Type 2024 & 2032
- Figure 25: North America Respiratory Protective Equipment Industry Revenue Share (%), by Product Type 2024 & 2032
- Figure 26: North America Respiratory Protective Equipment Industry Volume Share (%), by Product Type 2024 & 2032
- Figure 27: North America Respiratory Protective Equipment Industry Revenue (Billion), by End User 2024 & 2032
- Figure 28: North America Respiratory Protective Equipment Industry Volume (K Units), by End User 2024 & 2032
- Figure 29: North America Respiratory Protective Equipment Industry Revenue Share (%), by End User 2024 & 2032
- Figure 30: North America Respiratory Protective Equipment Industry Volume Share (%), by End User 2024 & 2032
- Figure 31: North America Respiratory Protective Equipment Industry Revenue (Billion), by Country 2024 & 2032
- Figure 32: North America Respiratory Protective Equipment Industry Volume (K Units), by Country 2024 & 2032
- Figure 33: North America Respiratory Protective Equipment Industry Revenue Share (%), by Country 2024 & 2032
- Figure 34: North America Respiratory Protective Equipment Industry Volume Share (%), by Country 2024 & 2032
- Figure 35: Europe Respiratory Protective Equipment Industry Revenue (Billion), by Product Type 2024 & 2032
- Figure 36: Europe Respiratory Protective Equipment Industry Volume (K Units), by Product Type 2024 & 2032
- Figure 37: Europe Respiratory Protective Equipment Industry Revenue Share (%), by Product Type 2024 & 2032
- Figure 38: Europe Respiratory Protective Equipment Industry Volume Share (%), by Product Type 2024 & 2032
- Figure 39: Europe Respiratory Protective Equipment Industry Revenue (Billion), by End User 2024 & 2032
- Figure 40: Europe Respiratory Protective Equipment Industry Volume (K Units), by End User 2024 & 2032
- Figure 41: Europe Respiratory Protective Equipment Industry Revenue Share (%), by End User 2024 & 2032
- Figure 42: Europe Respiratory Protective Equipment Industry Volume Share (%), by End User 2024 & 2032
- Figure 43: Europe Respiratory Protective Equipment Industry Revenue (Billion), by Country 2024 & 2032
- Figure 44: Europe Respiratory Protective Equipment Industry Volume (K Units), by Country 2024 & 2032
- Figure 45: Europe Respiratory Protective Equipment Industry Revenue Share (%), by Country 2024 & 2032
- Figure 46: Europe Respiratory Protective Equipment Industry Volume Share (%), by Country 2024 & 2032
- Figure 47: Asia Pacific Respiratory Protective Equipment Industry Revenue (Billion), by Product Type 2024 & 2032
- Figure 48: Asia Pacific Respiratory Protective Equipment Industry Volume (K Units), by Product Type 2024 & 2032
- Figure 49: Asia Pacific Respiratory Protective Equipment Industry Revenue Share (%), by Product Type 2024 & 2032
- Figure 50: Asia Pacific Respiratory Protective Equipment Industry Volume Share (%), by Product Type 2024 & 2032
- Figure 51: Asia Pacific Respiratory Protective Equipment Industry Revenue (Billion), by End User 2024 & 2032
- Figure 52: Asia Pacific Respiratory Protective Equipment Industry Volume (K Units), by End User 2024 & 2032
- Figure 53: Asia Pacific Respiratory Protective Equipment Industry Revenue Share (%), by End User 2024 & 2032
- Figure 54: Asia Pacific Respiratory Protective Equipment Industry Volume Share (%), by End User 2024 & 2032
- Figure 55: Asia Pacific Respiratory Protective Equipment Industry Revenue (Billion), by Country 2024 & 2032
- Figure 56: Asia Pacific Respiratory Protective Equipment Industry Volume (K Units), by Country 2024 & 2032
- Figure 57: Asia Pacific Respiratory Protective Equipment Industry Revenue Share (%), by Country 2024 & 2032
- Figure 58: Asia Pacific Respiratory Protective Equipment Industry Volume Share (%), by Country 2024 & 2032
- Figure 59: Middle East and Africa Respiratory Protective Equipment Industry Revenue (Billion), by Product Type 2024 & 2032
- Figure 60: Middle East and Africa Respiratory Protective Equipment Industry Volume (K Units), by Product Type 2024 & 2032
- Figure 61: Middle East and Africa Respiratory Protective Equipment Industry Revenue Share (%), by Product Type 2024 & 2032
- Figure 62: Middle East and Africa Respiratory Protective Equipment Industry Volume Share (%), by Product Type 2024 & 2032
- Figure 63: Middle East and Africa Respiratory Protective Equipment Industry Revenue (Billion), by End User 2024 & 2032
- Figure 64: Middle East and Africa Respiratory Protective Equipment Industry Volume (K Units), by End User 2024 & 2032
- Figure 65: Middle East and Africa Respiratory Protective Equipment Industry Revenue Share (%), by End User 2024 & 2032
- Figure 66: Middle East and Africa Respiratory Protective Equipment Industry Volume Share (%), by End User 2024 & 2032
- Figure 67: Middle East and Africa Respiratory Protective Equipment Industry Revenue (Billion), by Country 2024 & 2032
- Figure 68: Middle East and Africa Respiratory Protective Equipment Industry Volume (K Units), by Country 2024 & 2032
- Figure 69: Middle East and Africa Respiratory Protective Equipment Industry Revenue Share (%), by Country 2024 & 2032
- Figure 70: Middle East and Africa Respiratory Protective Equipment Industry Volume Share (%), by Country 2024 & 2032
- Figure 71: South America Respiratory Protective Equipment Industry Revenue (Billion), by Product Type 2024 & 2032
- Figure 72: South America Respiratory Protective Equipment Industry Volume (K Units), by Product Type 2024 & 2032
- Figure 73: South America Respiratory Protective Equipment Industry Revenue Share (%), by Product Type 2024 & 2032
- Figure 74: South America Respiratory Protective Equipment Industry Volume Share (%), by Product Type 2024 & 2032
- Figure 75: South America Respiratory Protective Equipment Industry Revenue (Billion), by End User 2024 & 2032
- Figure 76: South America Respiratory Protective Equipment Industry Volume (K Units), by End User 2024 & 2032
- Figure 77: South America Respiratory Protective Equipment Industry Revenue Share (%), by End User 2024 & 2032
- Figure 78: South America Respiratory Protective Equipment Industry Volume Share (%), by End User 2024 & 2032
- Figure 79: South America Respiratory Protective Equipment Industry Revenue (Billion), by Country 2024 & 2032
- Figure 80: South America Respiratory Protective Equipment Industry Volume (K Units), by Country 2024 & 2032
- Figure 81: South America Respiratory Protective Equipment Industry Revenue Share (%), by Country 2024 & 2032
- Figure 82: South America Respiratory Protective Equipment Industry Volume Share (%), by Country 2024 & 2032
List of Tables
- Table 1: Global Respiratory Protective Equipment Industry Revenue Billion Forecast, by Region 2019 & 2032
- Table 2: Global Respiratory Protective Equipment Industry Volume K Units Forecast, by Region 2019 & 2032
- Table 3: Global Respiratory Protective Equipment Industry Revenue Billion Forecast, by Product Type 2019 & 2032
- Table 4: Global Respiratory Protective Equipment Industry Volume K Units Forecast, by Product Type 2019 & 2032
- Table 5: Global Respiratory Protective Equipment Industry Revenue Billion Forecast, by End User 2019 & 2032
- Table 6: Global Respiratory Protective Equipment Industry Volume K Units Forecast, by End User 2019 & 2032
- Table 7: Global Respiratory Protective Equipment Industry Revenue Billion Forecast, by Region 2019 & 2032
- Table 8: Global Respiratory Protective Equipment Industry Volume K Units Forecast, by Region 2019 & 2032
- Table 9: Global Respiratory Protective Equipment Industry Revenue Billion Forecast, by Country 2019 & 2032
- Table 10: Global Respiratory Protective Equipment Industry Volume K Units Forecast, by Country 2019 & 2032
- Table 11: United States Respiratory Protective Equipment Industry Revenue (Billion) Forecast, by Application 2019 & 2032
- Table 12: United States Respiratory Protective Equipment Industry Volume (K Units) Forecast, by Application 2019 & 2032
- Table 13: Canada Respiratory Protective Equipment Industry Revenue (Billion) Forecast, by Application 2019 & 2032
- Table 14: Canada Respiratory Protective Equipment Industry Volume (K Units) Forecast, by Application 2019 & 2032
- Table 15: Mexico Respiratory Protective Equipment Industry Revenue (Billion) Forecast, by Application 2019 & 2032
- Table 16: Mexico Respiratory Protective Equipment Industry Volume (K Units) Forecast, by Application 2019 & 2032
- Table 17: Global Respiratory Protective Equipment Industry Revenue Billion Forecast, by Country 2019 & 2032
- Table 18: Global Respiratory Protective Equipment Industry Volume K Units Forecast, by Country 2019 & 2032
- Table 19: Brazil Respiratory Protective Equipment Industry Revenue (Billion) Forecast, by Application 2019 & 2032
- Table 20: Brazil Respiratory Protective Equipment Industry Volume (K Units) Forecast, by Application 2019 & 2032
- Table 21: Mexico Respiratory Protective Equipment Industry Revenue (Billion) Forecast, by Application 2019 & 2032
- Table 22: Mexico Respiratory Protective Equipment Industry Volume (K Units) Forecast, by Application 2019 & 2032
- Table 23: Rest of South America Respiratory Protective Equipment Industry Revenue (Billion) Forecast, by Application 2019 & 2032
- Table 24: Rest of South America Respiratory Protective Equipment Industry Volume (K Units) Forecast, by Application 2019 & 2032
- Table 25: Global Respiratory Protective Equipment Industry Revenue Billion Forecast, by Country 2019 & 2032
- Table 26: Global Respiratory Protective Equipment Industry Volume K Units Forecast, by Country 2019 & 2032
- Table 27: United Kingdom Respiratory Protective Equipment Industry Revenue (Billion) Forecast, by Application 2019 & 2032
- Table 28: United Kingdom Respiratory Protective Equipment Industry Volume (K Units) Forecast, by Application 2019 & 2032
- Table 29: Germany Respiratory Protective Equipment Industry Revenue (Billion) Forecast, by Application 2019 & 2032
- Table 30: Germany Respiratory Protective Equipment Industry Volume (K Units) Forecast, by Application 2019 & 2032
- Table 31: France Respiratory Protective Equipment Industry Revenue (Billion) Forecast, by Application 2019 & 2032
- Table 32: France Respiratory Protective Equipment Industry Volume (K Units) Forecast, by Application 2019 & 2032
- Table 33: Italy Respiratory Protective Equipment Industry Revenue (Billion) Forecast, by Application 2019 & 2032
- Table 34: Italy Respiratory Protective Equipment Industry Volume (K Units) Forecast, by Application 2019 & 2032
- Table 35: Spain Respiratory Protective Equipment Industry Revenue (Billion) Forecast, by Application 2019 & 2032
- Table 36: Spain Respiratory Protective Equipment Industry Volume (K Units) Forecast, by Application 2019 & 2032
- Table 37: Russia Respiratory Protective Equipment Industry Revenue (Billion) Forecast, by Application 2019 & 2032
- Table 38: Russia Respiratory Protective Equipment Industry Volume (K Units) Forecast, by Application 2019 & 2032
- Table 39: Rest of Europe Respiratory Protective Equipment Industry Revenue (Billion) Forecast, by Application 2019 & 2032
- Table 40: Rest of Europe Respiratory Protective Equipment Industry Volume (K Units) Forecast, by Application 2019 & 2032
- Table 41: Global Respiratory Protective Equipment Industry Revenue Billion Forecast, by Country 2019 & 2032
- Table 42: Global Respiratory Protective Equipment Industry Volume K Units Forecast, by Country 2019 & 2032
- Table 43: China Respiratory Protective Equipment Industry Revenue (Billion) Forecast, by Application 2019 & 2032
- Table 44: China Respiratory Protective Equipment Industry Volume (K Units) Forecast, by Application 2019 & 2032
- Table 45: Japan Respiratory Protective Equipment Industry Revenue (Billion) Forecast, by Application 2019 & 2032
- Table 46: Japan Respiratory Protective Equipment Industry Volume (K Units) Forecast, by Application 2019 & 2032
- Table 47: India Respiratory Protective Equipment Industry Revenue (Billion) Forecast, by Application 2019 & 2032
- Table 48: India Respiratory Protective Equipment Industry Volume (K Units) Forecast, by Application 2019 & 2032
- Table 49: South Korea Respiratory Protective Equipment Industry Revenue (Billion) Forecast, by Application 2019 & 2032
- Table 50: South Korea Respiratory Protective Equipment Industry Volume (K Units) Forecast, by Application 2019 & 2032
- Table 51: Taiwan Respiratory Protective Equipment Industry Revenue (Billion) Forecast, by Application 2019 & 2032
- Table 52: Taiwan Respiratory Protective Equipment Industry Volume (K Units) Forecast, by Application 2019 & 2032
- Table 53: Australia Respiratory Protective Equipment Industry Revenue (Billion) Forecast, by Application 2019 & 2032
- Table 54: Australia Respiratory Protective Equipment Industry Volume (K Units) Forecast, by Application 2019 & 2032
- Table 55: Rest of Asia-Pacific Respiratory Protective Equipment Industry Revenue (Billion) Forecast, by Application 2019 & 2032
- Table 56: Rest of Asia-Pacific Respiratory Protective Equipment Industry Volume (K Units) Forecast, by Application 2019 & 2032
- Table 57: Global Respiratory Protective Equipment Industry Revenue Billion Forecast, by Country 2019 & 2032
- Table 58: Global Respiratory Protective Equipment Industry Volume K Units Forecast, by Country 2019 & 2032
- Table 59: Middle East Respiratory Protective Equipment Industry Revenue (Billion) Forecast, by Application 2019 & 2032
- Table 60: Middle East Respiratory Protective Equipment Industry Volume (K Units) Forecast, by Application 2019 & 2032
- Table 61: Africa Respiratory Protective Equipment Industry Revenue (Billion) Forecast, by Application 2019 & 2032
- Table 62: Africa Respiratory Protective Equipment Industry Volume (K Units) Forecast, by Application 2019 & 2032
- Table 63: Global Respiratory Protective Equipment Industry Revenue Billion Forecast, by Product Type 2019 & 2032
- Table 64: Global Respiratory Protective Equipment Industry Volume K Units Forecast, by Product Type 2019 & 2032
- Table 65: Global Respiratory Protective Equipment Industry Revenue Billion Forecast, by End User 2019 & 2032
- Table 66: Global Respiratory Protective Equipment Industry Volume K Units Forecast, by End User 2019 & 2032
- Table 67: Global Respiratory Protective Equipment Industry Revenue Billion Forecast, by Country 2019 & 2032
- Table 68: Global Respiratory Protective Equipment Industry Volume K Units Forecast, by Country 2019 & 2032
- Table 69: United States Respiratory Protective Equipment Industry Revenue (Billion) Forecast, by Application 2019 & 2032
- Table 70: United States Respiratory Protective Equipment Industry Volume (K Units) Forecast, by Application 2019 & 2032
- Table 71: Canada Respiratory Protective Equipment Industry Revenue (Billion) Forecast, by Application 2019 & 2032
- Table 72: Canada Respiratory Protective Equipment Industry Volume (K Units) Forecast, by Application 2019 & 2032
- Table 73: Mexico Respiratory Protective Equipment Industry Revenue (Billion) Forecast, by Application 2019 & 2032
- Table 74: Mexico Respiratory Protective Equipment Industry Volume (K Units) Forecast, by Application 2019 & 2032
- Table 75: Global Respiratory Protective Equipment Industry Revenue Billion Forecast, by Product Type 2019 & 2032
- Table 76: Global Respiratory Protective Equipment Industry Volume K Units Forecast, by Product Type 2019 & 2032
- Table 77: Global Respiratory Protective Equipment Industry Revenue Billion Forecast, by End User 2019 & 2032
- Table 78: Global Respiratory Protective Equipment Industry Volume K Units Forecast, by End User 2019 & 2032
- Table 79: Global Respiratory Protective Equipment Industry Revenue Billion Forecast, by Country 2019 & 2032
- Table 80: Global Respiratory Protective Equipment Industry Volume K Units Forecast, by Country 2019 & 2032
- Table 81: Germany Respiratory Protective Equipment Industry Revenue (Billion) Forecast, by Application 2019 & 2032
- Table 82: Germany Respiratory Protective Equipment Industry Volume (K Units) Forecast, by Application 2019 & 2032
- Table 83: United Kingdom Respiratory Protective Equipment Industry Revenue (Billion) Forecast, by Application 2019 & 2032
- Table 84: United Kingdom Respiratory Protective Equipment Industry Volume (K Units) Forecast, by Application 2019 & 2032
- Table 85: France Respiratory Protective Equipment Industry Revenue (Billion) Forecast, by Application 2019 & 2032
- Table 86: France Respiratory Protective Equipment Industry Volume (K Units) Forecast, by Application 2019 & 2032
- Table 87: Italy Respiratory Protective Equipment Industry Revenue (Billion) Forecast, by Application 2019 & 2032
- Table 88: Italy Respiratory Protective Equipment Industry Volume (K Units) Forecast, by Application 2019 & 2032
- Table 89: Spain Respiratory Protective Equipment Industry Revenue (Billion) Forecast, by Application 2019 & 2032
- Table 90: Spain Respiratory Protective Equipment Industry Volume (K Units) Forecast, by Application 2019 & 2032
- Table 91: Rest of Europe Respiratory Protective Equipment Industry Revenue (Billion) Forecast, by Application 2019 & 2032
- Table 92: Rest of Europe Respiratory Protective Equipment Industry Volume (K Units) Forecast, by Application 2019 & 2032
- Table 93: Global Respiratory Protective Equipment Industry Revenue Billion Forecast, by Product Type 2019 & 2032
- Table 94: Global Respiratory Protective Equipment Industry Volume K Units Forecast, by Product Type 2019 & 2032
- Table 95: Global Respiratory Protective Equipment Industry Revenue Billion Forecast, by End User 2019 & 2032
- Table 96: Global Respiratory Protective Equipment Industry Volume K Units Forecast, by End User 2019 & 2032
- Table 97: Global Respiratory Protective Equipment Industry Revenue Billion Forecast, by Country 2019 & 2032
- Table 98: Global Respiratory Protective Equipment Industry Volume K Units Forecast, by Country 2019 & 2032
- Table 99: China Respiratory Protective Equipment Industry Revenue (Billion) Forecast, by Application 2019 & 2032
- Table 100: China Respiratory Protective Equipment Industry Volume (K Units) Forecast, by Application 2019 & 2032
- Table 101: Japan Respiratory Protective Equipment Industry Revenue (Billion) Forecast, by Application 2019 & 2032
- Table 102: Japan Respiratory Protective Equipment Industry Volume (K Units) Forecast, by Application 2019 & 2032
- Table 103: India Respiratory Protective Equipment Industry Revenue (Billion) Forecast, by Application 2019 & 2032
- Table 104: India Respiratory Protective Equipment Industry Volume (K Units) Forecast, by Application 2019 & 2032
- Table 105: Australia Respiratory Protective Equipment Industry Revenue (Billion) Forecast, by Application 2019 & 2032
- Table 106: Australia Respiratory Protective Equipment Industry Volume (K Units) Forecast, by Application 2019 & 2032
- Table 107: South Korea Respiratory Protective Equipment Industry Revenue (Billion) Forecast, by Application 2019 & 2032
- Table 108: South Korea Respiratory Protective Equipment Industry Volume (K Units) Forecast, by Application 2019 & 2032
- Table 109: Rest of Asia Pacific Respiratory Protective Equipment Industry Revenue (Billion) Forecast, by Application 2019 & 2032
- Table 110: Rest of Asia Pacific Respiratory Protective Equipment Industry Volume (K Units) Forecast, by Application 2019 & 2032
- Table 111: Global Respiratory Protective Equipment Industry Revenue Billion Forecast, by Product Type 2019 & 2032
- Table 112: Global Respiratory Protective Equipment Industry Volume K Units Forecast, by Product Type 2019 & 2032
- Table 113: Global Respiratory Protective Equipment Industry Revenue Billion Forecast, by End User 2019 & 2032
- Table 114: Global Respiratory Protective Equipment Industry Volume K Units Forecast, by End User 2019 & 2032
- Table 115: Global Respiratory Protective Equipment Industry Revenue Billion Forecast, by Country 2019 & 2032
- Table 116: Global Respiratory Protective Equipment Industry Volume K Units Forecast, by Country 2019 & 2032
- Table 117: GCC Respiratory Protective Equipment Industry Revenue (Billion) Forecast, by Application 2019 & 2032
- Table 118: GCC Respiratory Protective Equipment Industry Volume (K Units) Forecast, by Application 2019 & 2032
- Table 119: South Africa Respiratory Protective Equipment Industry Revenue (Billion) Forecast, by Application 2019 & 2032
- Table 120: South Africa Respiratory Protective Equipment Industry Volume (K Units) Forecast, by Application 2019 & 2032
- Table 121: Rest of Middle East and Africa Respiratory Protective Equipment Industry Revenue (Billion) Forecast, by Application 2019 & 2032
- Table 122: Rest of Middle East and Africa Respiratory Protective Equipment Industry Volume (K Units) Forecast, by Application 2019 & 2032
- Table 123: Global Respiratory Protective Equipment Industry Revenue Billion Forecast, by Product Type 2019 & 2032
- Table 124: Global Respiratory Protective Equipment Industry Volume K Units Forecast, by Product Type 2019 & 2032
- Table 125: Global Respiratory Protective Equipment Industry Revenue Billion Forecast, by End User 2019 & 2032
- Table 126: Global Respiratory Protective Equipment Industry Volume K Units Forecast, by End User 2019 & 2032
- Table 127: Global Respiratory Protective Equipment Industry Revenue Billion Forecast, by Country 2019 & 2032
- Table 128: Global Respiratory Protective Equipment Industry Volume K Units Forecast, by Country 2019 & 2032
- Table 129: Brazil Respiratory Protective Equipment Industry Revenue (Billion) Forecast, by Application 2019 & 2032
- Table 130: Brazil Respiratory Protective Equipment Industry Volume (K Units) Forecast, by Application 2019 & 2032
- Table 131: Argentina Respiratory Protective Equipment Industry Revenue (Billion) Forecast, by Application 2019 & 2032
- Table 132: Argentina Respiratory Protective Equipment Industry Volume (K Units) Forecast, by Application 2019 & 2032
- Table 133: Rest of South America Respiratory Protective Equipment Industry Revenue (Billion) Forecast, by Application 2019 & 2032
- Table 134: Rest of South America Respiratory Protective Equipment Industry Volume (K Units) Forecast, by Application 2019 & 2032
Frequently Asked Questions
1. What is the projected Compound Annual Growth Rate (CAGR) of the Respiratory Protective Equipment Industry?
The projected CAGR is approximately 6.50%.
2. Which companies are prominent players in the Respiratory Protective Equipment Industry?
Key companies in the market include Moldex-Metric, Ansell Ltd, Honeywell International Inc, Uvex Group, Prestige Ameritech, 3M, Bullard, DuPont, Dragerwerk AG & Company KGaA, ILC Dover LLP.
3. What are the main segments of the Respiratory Protective Equipment Industry?
The market segments include Product Type, End User.
4. Can you provide details about the market size?
The market size is estimated to be USD 7.3 Billion as of 2022.
5. What are some drivers contributing to market growth?
Growing Burden of Pandemic and Epidemic Diseases; Increasing Demand for Surgical Procedures. Including Minimally Invasive; Increasing Importance Given to Workplace Safety.
6. What are the notable trends driving market growth?
Air-purifying Respirator is Expected to Hold a Significant Share in the Market During the Forecast Period.
7. Are there any restraints impacting market growth?
High Cost of Respirators and Presence of Substandard Respirators; Issues Regarding Disposal and Reusability.
8. Can you provide examples of recent developments in the market?
In August 2022, Optrel launched P.Air Clear, the NIOSH-approved N95 respirator with a transparent window, a latex-free head harness, and an adjustable nose clip.
9. What pricing options are available for accessing the report?
Pricing options include single-user, multi-user, and enterprise licenses priced at USD 4750, USD 5250, and USD 8750 respectively.
10. Is the market size provided in terms of value or volume?
The market size is provided in terms of value, measured in Billion and volume, measured in K Units.
11. Are there any specific market keywords associated with the report?
Yes, the market keyword associated with the report is "Respiratory Protective Equipment Industry," which aids in identifying and referencing the specific market segment covered.
12. How do I determine which pricing option suits my needs best?
The pricing options vary based on user requirements and access needs. Individual users may opt for single-user licenses, while businesses requiring broader access may choose multi-user or enterprise licenses for cost-effective access to the report.
13. Are there any additional resources or data provided in the Respiratory Protective Equipment Industry report?
While the report offers comprehensive insights, it's advisable to review the specific contents or supplementary materials provided to ascertain if additional resources or data are available.
14. How can I stay updated on further developments or reports in the Respiratory Protective Equipment Industry?
To stay informed about further developments, trends, and reports in the Respiratory Protective Equipment Industry, consider subscribing to industry newsletters, following relevant companies and organizations, or regularly checking reputable industry news sources and publications.
Methodology
Step 1 - Identification of Relevant Samples Size from Population Database


Step 2 - Approaches for Defining Global Market Size (Value, Volume* & Price*)

Note*: In applicable scenarios
Step 3 - Data Sources
Primary Research
- Web Analytics
- Survey Reports
- Research Institute
- Latest Research Reports
- Opinion Leaders
Secondary Research
- Annual Reports
- White Paper
- Latest Press Release
- Industry Association
- Paid Database
- Investor Presentations

Step 4 - Data Triangulation
Involves using different sources of information in order to increase the validity of a study
These sources are likely to be stakeholders in a program - participants, other researchers, program staff, other community members, and so on.
Then we put all data in single framework & apply various statistical tools to find out the dynamic on the market.
During the analysis stage, feedback from the stakeholder groups would be compared to determine areas of agreement as well as areas of divergence


