
Key Insights
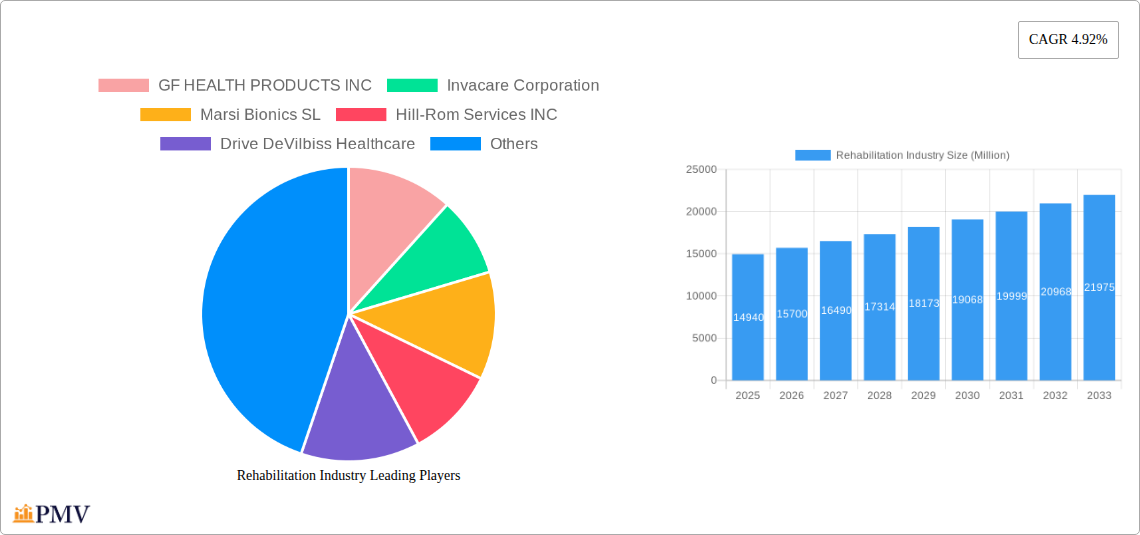
The global rehabilitation industry, valued at $14.94 billion in 2025, is projected to experience robust growth, driven by several key factors. An aging global population with increased prevalence of chronic diseases like stroke, spinal cord injuries, and arthritis significantly fuels the demand for rehabilitation services and assistive technologies. Technological advancements, such as the development of sophisticated robotic exoskeletons and virtual reality-based therapies, are enhancing rehabilitation outcomes and expanding treatment options. Furthermore, rising healthcare expenditure and increasing awareness about the benefits of early and comprehensive rehabilitation are contributing to market expansion. The industry is segmented by product type (daily living aids, mobility aids, etc.), application (physiotherapy, occupational therapy, speech therapy), and end-user (hospitals, rehabilitation centers, home care). Growth is expected to be particularly strong in regions with rapidly expanding healthcare infrastructure and increasing disposable incomes, such as Asia-Pacific. However, high costs associated with advanced rehabilitation technologies and a shortage of skilled therapists in certain regions pose challenges to market growth.
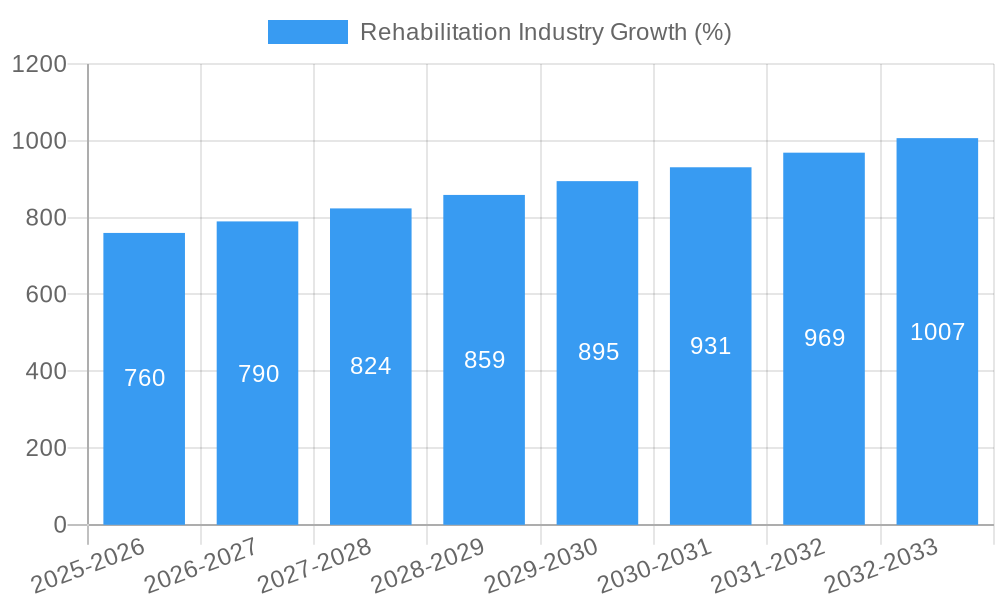
The forecast period (2025-2033) anticipates a continued upward trajectory, fueled by sustained technological innovation and increasing healthcare investments. The compound annual growth rate (CAGR) of 4.92% suggests a substantial market expansion. Specific segments, like robotic-assisted rehabilitation and home-based telehealth rehabilitation programs, are poised for accelerated growth due to their convenience and effectiveness. Competition among established players like GF Health Products Inc., Invacare Corporation, and emerging companies offering innovative solutions is likely to intensify. Strategic partnerships, mergers and acquisitions, and product diversification will be crucial for companies to maintain a competitive edge. Government initiatives promoting accessible and affordable rehabilitation services will play a vital role in shaping the industry’s future.
Rehabilitation Industry Market Report: 2019-2033
This comprehensive report provides a detailed analysis of the global rehabilitation industry, offering invaluable insights for stakeholders across the value chain. The study period spans from 2019 to 2033, with a base year of 2025 and a forecast period from 2025 to 2033. The report projects a market size of xx Million for 2025 and xx Million for 2033, signifying substantial growth potential. Key players such as GF HEALTH PRODUCTS INC, Invacare Corporation, and Medline Industries Inc., are profiled, alongside an examination of key segments like Daily Living Aids and Physiotherapy applications.
Rehabilitation Industry Market Structure & Competitive Dynamics
The rehabilitation industry exhibits a moderately consolidated market structure, with a few large players holding significant market share. Market concentration is driven by economies of scale, brand recognition, and established distribution networks. Innovation ecosystems are dynamic, with both established players and emerging startups contributing to technological advancements. Regulatory frameworks vary across geographies, impacting product approvals and market access. The industry faces competition from substitute therapies and alternative care models. End-user trends indicate a growing demand for personalized and technologically advanced rehabilitation solutions. Mergers and acquisitions (M&A) activities have been significant, with deal values exceeding xx Million in recent years, consolidating market presence and expanding product portfolios.
- Market Share: Top 5 players account for approximately xx% of the global market.
- M&A Activity: Over the past five years, xx major M&A deals have been recorded, averaging xx Million per transaction. These deals focused on expanding product portfolios and geographical reach.
- Regulatory Landscape: Stringent regulatory requirements in key markets such as the US and EU create barriers to entry but also ensure safety and efficacy standards.
Rehabilitation Industry Industry Trends & Insights
The rehabilitation industry is experiencing robust growth, driven by a number of factors. The aging global population, increasing prevalence of chronic diseases, advancements in medical technology, and rising healthcare expenditure are all contributing to market expansion. Technological disruptions, such as the integration of robotics, AI, and virtual reality (VR) in rehabilitation therapies, are revolutionizing treatment approaches and enhancing patient outcomes. Consumer preferences are shifting towards personalized, convenient, and technologically advanced rehabilitation solutions. This is further fueling the demand for home-based rehabilitation programs and remote monitoring technologies. Competitive dynamics are characterized by innovation, strategic partnerships, and the emergence of new market entrants. The compound annual growth rate (CAGR) is projected to be xx% during the forecast period (2025-2033), with significant market penetration anticipated in emerging economies.
Dominant Markets & Segments in Rehabilitation Industry
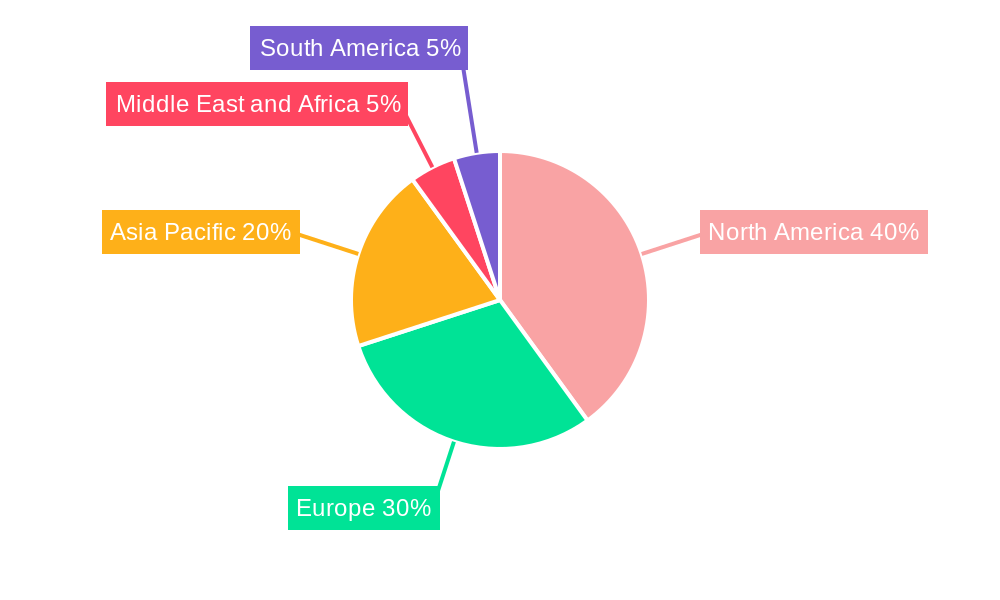
North America currently dominates the rehabilitation industry, driven by high healthcare expenditure, technological advancements, and a large aging population. However, the Asia-Pacific region is projected to experience the fastest growth, fueled by rising disposable incomes, increased awareness of rehabilitation therapies, and government initiatives to improve healthcare infrastructure.
- Leading Segment: Physiotherapy applications hold the largest market share within the application segment due to its widespread use across diverse conditions.
- Dominant End-User: Hospitals constitute the largest end-user segment, due to their concentration of patients requiring intensive rehabilitation services.
Key Drivers for Dominance:
- North America: High healthcare spending, strong regulatory framework, early adoption of new technologies.
- Asia-Pacific: Rapidly growing aging population, increasing healthcare investment, rising awareness of rehabilitation benefits.
Rehabilitation Industry Product Innovations
Recent years have witnessed significant product innovations in the rehabilitation industry. Wearable rehabilitation devices, such as LusioMATE, are gaining traction, offering remote monitoring and patient engagement features. The integration of AI and machine learning is enhancing the accuracy and effectiveness of rehabilitation therapies. Robotics-assisted rehabilitation is becoming increasingly sophisticated, offering personalized and adaptive treatment plans. These innovations are enhancing treatment outcomes, improving patient satisfaction, and driving market growth.
Report Segmentation & Scope
This report provides detailed segmentation analysis across the following key parameters:
Product Type: Daily Living Aids, which includes mobility aids and assistive devices, is experiencing steady growth, driven by the increasing elderly population and improved accessibility.
Application: Physiotherapy and Occupational Therapy segments are prominent, indicating a high demand for professional rehabilitation services. Other Applications, such as sports medicine and neurological rehabilitation are emerging segments with significant growth potential.
End-User: Hospitals and Rehab Centers remain the leading end-users, yet the Others End-Users segment representing home healthcare and individual patients is expanding rapidly due to increasing affordability and technological advancements.
Each segment's growth projection, market size, and competitive dynamics are analyzed in detail.
Key Drivers of Rehabilitation Industry Growth
The rehabilitation industry’s growth is fueled by several key factors: an aging global population necessitates increased rehabilitation services; the rising prevalence of chronic diseases like stroke and spinal cord injuries increases the demand for rehabilitation; technological advancements lead to more effective and efficient therapies; and increased government initiatives support the growth of the rehabilitation sector.
Challenges in the Rehabilitation Industry Sector
The rehabilitation industry faces several challenges: high costs of advanced technologies limit accessibility; stringent regulatory requirements create hurdles for new market entrants; supply chain disruptions can impact the availability of devices and equipment; and intense competition exists among established and emerging players.
Leading Players in the Rehabilitation Industry Market
- GF HEALTH PRODUCTS INC
- Invacare Corporation
- Marsi Bionics SL
- Hill-Rom Services INC
- Drive DeVilbiss Healthcare
- Dynatronics Corporation
- Ekso Bionics
- ReWalk Robotics
- Caremax Rehabilitation Equipment Co Ltd
- ULS Robotics Co Ltd
- Medline Industries Inc
- Roma Medical Aids Ltd
- Hospital Equipment Mfg Co
Key Developments in Rehabilitation Industry Sector
- February 2022: Lusio Rehab launched LusioMATE, a wearable rehabilitation device designed to increase patient engagement in physical therapy programs. This launch reflects the growing trend towards home-based and gamified rehabilitation solutions.
- January 2022: EVOSONICS showcased sleep tech, rehabilitation, and obesity management devices at CES2022. This highlights the convergence of technologies across different healthcare sectors and the potential for integrated solutions.
Strategic Rehabilitation Industry Market Outlook
The rehabilitation industry presents a promising outlook, driven by technological innovation, demographic shifts, and increasing healthcare spending. Strategic opportunities lie in developing personalized rehabilitation solutions, leveraging AI and VR technologies, and expanding into emerging markets. Focus on innovative business models, such as telehealth and remote monitoring, will further fuel market growth and improve patient access to rehabilitation services.
Rehabilitation Industry Segmentation
-
1. Product Type
-
1.1. Daily Living Aids
- 1.1.1. Medical Beds
- 1.1.2. Bathroom and Toilet Assist Devices
- 1.1.3. Reading Writing and Computer Aids
- 1.1.4. Other Daily Living Aids
-
1.2. Exercise Equipment
- 1.2.1. Upper Body Exercise Equipment
- 1.2.2. Lower Body Exercise Equipment
-
1.3. Body Support Devices
- 1.3.1. Patient Lifts
- 1.3.2. Medical Lifting Slings
-
1.4. Mobility Equipment
- 1.4.1. Walking Assist Devices
- 1.4.2. Wheelchairs and Scooters
-
1.1. Daily Living Aids
-
2. Application
- 2.1. Physiotherapy
- 2.2. Occupational Therapy
- 2.3. Other Applications
-
3. End-User
- 3.1. Hospitals
- 3.2. Rehab Centers
- 3.3. Others End-Users
Rehabilitation Industry Segmentation By Geography
-
1. North America
- 1.1. United States
- 1.2. Canada
- 1.3. Mexico
-
2. Europe
- 2.1. Germany
- 2.2. United Kingdom
- 2.3. France
- 2.4. Italy
- 2.5. Spain
- 2.6. Rest of Europe
-
3. Asia Pacific
- 3.1. China
- 3.2. Japan
- 3.3. India
- 3.4. Australia
- 3.5. South Korea
- 3.6. Rest of Asia Pacific
-
4. Middle East and Africa
- 4.1. GCC
- 4.2. South Africa
- 4.3. Rest of Middle East and Africa
-
5. South America
- 5.1. Brazil
- 5.2. Argentina
- 5.3. Rest of South America
Rehabilitation Industry REPORT HIGHLIGHTS
| Aspects | Details |
|---|---|
| Study Period | 2019-2033 |
| Base Year | 2024 |
| Estimated Year | 2025 |
| Forecast Period | 2025-2033 |
| Historical Period | 2019-2024 |
| Growth Rate | CAGR of 4.92% from 2019-2033 |
| Segmentation |
|
Table of Contents
- 1. Introduction
- 1.1. Research Scope
- 1.2. Market Segmentation
- 1.3. Research Methodology
- 1.4. Definitions and Assumptions
- 2. Executive Summary
- 2.1. Introduction
- 3. Market Dynamics
- 3.1. Introduction
- 3.2. Market Drivers
- 3.2.1. Increasing Burden of Chronic Diseases; Rising Demand for Rehabilitation Therapies; Rising Awareness Initiatives Regarding Rehabilitation Therapies
- 3.3. Market Restrains
- 3.3.1. Unfavorable Reimbursements and Lack of Awareness
- 3.4. Market Trends
- 3.4.1. Walking Assist Devices Segment Estimated to Witness a Healthy Growth Over the Forecast Period
- 4. Market Factor Analysis
- 4.1. Porters Five Forces
- 4.2. Supply/Value Chain
- 4.3. PESTEL analysis
- 4.4. Market Entropy
- 4.5. Patent/Trademark Analysis
- 5. Global Rehabilitation Industry Analysis, Insights and Forecast, 2019-2031
- 5.1. Market Analysis, Insights and Forecast - by Product Type
- 5.1.1. Daily Living Aids
- 5.1.1.1. Medical Beds
- 5.1.1.2. Bathroom and Toilet Assist Devices
- 5.1.1.3. Reading Writing and Computer Aids
- 5.1.1.4. Other Daily Living Aids
- 5.1.2. Exercise Equipment
- 5.1.2.1. Upper Body Exercise Equipment
- 5.1.2.2. Lower Body Exercise Equipment
- 5.1.3. Body Support Devices
- 5.1.3.1. Patient Lifts
- 5.1.3.2. Medical Lifting Slings
- 5.1.4. Mobility Equipment
- 5.1.4.1. Walking Assist Devices
- 5.1.4.2. Wheelchairs and Scooters
- 5.1.1. Daily Living Aids
- 5.2. Market Analysis, Insights and Forecast - by Application
- 5.2.1. Physiotherapy
- 5.2.2. Occupational Therapy
- 5.2.3. Other Applications
- 5.3. Market Analysis, Insights and Forecast - by End-User
- 5.3.1. Hospitals
- 5.3.2. Rehab Centers
- 5.3.3. Others End-Users
- 5.4. Market Analysis, Insights and Forecast - by Region
- 5.4.1. North America
- 5.4.2. Europe
- 5.4.3. Asia Pacific
- 5.4.4. Middle East and Africa
- 5.4.5. South America
- 5.1. Market Analysis, Insights and Forecast - by Product Type
- 6. North America Rehabilitation Industry Analysis, Insights and Forecast, 2019-2031
- 6.1. Market Analysis, Insights and Forecast - by Product Type
- 6.1.1. Daily Living Aids
- 6.1.1.1. Medical Beds
- 6.1.1.2. Bathroom and Toilet Assist Devices
- 6.1.1.3. Reading Writing and Computer Aids
- 6.1.1.4. Other Daily Living Aids
- 6.1.2. Exercise Equipment
- 6.1.2.1. Upper Body Exercise Equipment
- 6.1.2.2. Lower Body Exercise Equipment
- 6.1.3. Body Support Devices
- 6.1.3.1. Patient Lifts
- 6.1.3.2. Medical Lifting Slings
- 6.1.4. Mobility Equipment
- 6.1.4.1. Walking Assist Devices
- 6.1.4.2. Wheelchairs and Scooters
- 6.1.1. Daily Living Aids
- 6.2. Market Analysis, Insights and Forecast - by Application
- 6.2.1. Physiotherapy
- 6.2.2. Occupational Therapy
- 6.2.3. Other Applications
- 6.3. Market Analysis, Insights and Forecast - by End-User
- 6.3.1. Hospitals
- 6.3.2. Rehab Centers
- 6.3.3. Others End-Users
- 6.1. Market Analysis, Insights and Forecast - by Product Type
- 7. Europe Rehabilitation Industry Analysis, Insights and Forecast, 2019-2031
- 7.1. Market Analysis, Insights and Forecast - by Product Type
- 7.1.1. Daily Living Aids
- 7.1.1.1. Medical Beds
- 7.1.1.2. Bathroom and Toilet Assist Devices
- 7.1.1.3. Reading Writing and Computer Aids
- 7.1.1.4. Other Daily Living Aids
- 7.1.2. Exercise Equipment
- 7.1.2.1. Upper Body Exercise Equipment
- 7.1.2.2. Lower Body Exercise Equipment
- 7.1.3. Body Support Devices
- 7.1.3.1. Patient Lifts
- 7.1.3.2. Medical Lifting Slings
- 7.1.4. Mobility Equipment
- 7.1.4.1. Walking Assist Devices
- 7.1.4.2. Wheelchairs and Scooters
- 7.1.1. Daily Living Aids
- 7.2. Market Analysis, Insights and Forecast - by Application
- 7.2.1. Physiotherapy
- 7.2.2. Occupational Therapy
- 7.2.3. Other Applications
- 7.3. Market Analysis, Insights and Forecast - by End-User
- 7.3.1. Hospitals
- 7.3.2. Rehab Centers
- 7.3.3. Others End-Users
- 7.1. Market Analysis, Insights and Forecast - by Product Type
- 8. Asia Pacific Rehabilitation Industry Analysis, Insights and Forecast, 2019-2031
- 8.1. Market Analysis, Insights and Forecast - by Product Type
- 8.1.1. Daily Living Aids
- 8.1.1.1. Medical Beds
- 8.1.1.2. Bathroom and Toilet Assist Devices
- 8.1.1.3. Reading Writing and Computer Aids
- 8.1.1.4. Other Daily Living Aids
- 8.1.2. Exercise Equipment
- 8.1.2.1. Upper Body Exercise Equipment
- 8.1.2.2. Lower Body Exercise Equipment
- 8.1.3. Body Support Devices
- 8.1.3.1. Patient Lifts
- 8.1.3.2. Medical Lifting Slings
- 8.1.4. Mobility Equipment
- 8.1.4.1. Walking Assist Devices
- 8.1.4.2. Wheelchairs and Scooters
- 8.1.1. Daily Living Aids
- 8.2. Market Analysis, Insights and Forecast - by Application
- 8.2.1. Physiotherapy
- 8.2.2. Occupational Therapy
- 8.2.3. Other Applications
- 8.3. Market Analysis, Insights and Forecast - by End-User
- 8.3.1. Hospitals
- 8.3.2. Rehab Centers
- 8.3.3. Others End-Users
- 8.1. Market Analysis, Insights and Forecast - by Product Type
- 9. Middle East and Africa Rehabilitation Industry Analysis, Insights and Forecast, 2019-2031
- 9.1. Market Analysis, Insights and Forecast - by Product Type
- 9.1.1. Daily Living Aids
- 9.1.1.1. Medical Beds
- 9.1.1.2. Bathroom and Toilet Assist Devices
- 9.1.1.3. Reading Writing and Computer Aids
- 9.1.1.4. Other Daily Living Aids
- 9.1.2. Exercise Equipment
- 9.1.2.1. Upper Body Exercise Equipment
- 9.1.2.2. Lower Body Exercise Equipment
- 9.1.3. Body Support Devices
- 9.1.3.1. Patient Lifts
- 9.1.3.2. Medical Lifting Slings
- 9.1.4. Mobility Equipment
- 9.1.4.1. Walking Assist Devices
- 9.1.4.2. Wheelchairs and Scooters
- 9.1.1. Daily Living Aids
- 9.2. Market Analysis, Insights and Forecast - by Application
- 9.2.1. Physiotherapy
- 9.2.2. Occupational Therapy
- 9.2.3. Other Applications
- 9.3. Market Analysis, Insights and Forecast - by End-User
- 9.3.1. Hospitals
- 9.3.2. Rehab Centers
- 9.3.3. Others End-Users
- 9.1. Market Analysis, Insights and Forecast - by Product Type
- 10. South America Rehabilitation Industry Analysis, Insights and Forecast, 2019-2031
- 10.1. Market Analysis, Insights and Forecast - by Product Type
- 10.1.1. Daily Living Aids
- 10.1.1.1. Medical Beds
- 10.1.1.2. Bathroom and Toilet Assist Devices
- 10.1.1.3. Reading Writing and Computer Aids
- 10.1.1.4. Other Daily Living Aids
- 10.1.2. Exercise Equipment
- 10.1.2.1. Upper Body Exercise Equipment
- 10.1.2.2. Lower Body Exercise Equipment
- 10.1.3. Body Support Devices
- 10.1.3.1. Patient Lifts
- 10.1.3.2. Medical Lifting Slings
- 10.1.4. Mobility Equipment
- 10.1.4.1. Walking Assist Devices
- 10.1.4.2. Wheelchairs and Scooters
- 10.1.1. Daily Living Aids
- 10.2. Market Analysis, Insights and Forecast - by Application
- 10.2.1. Physiotherapy
- 10.2.2. Occupational Therapy
- 10.2.3. Other Applications
- 10.3. Market Analysis, Insights and Forecast - by End-User
- 10.3.1. Hospitals
- 10.3.2. Rehab Centers
- 10.3.3. Others End-Users
- 10.1. Market Analysis, Insights and Forecast - by Product Type
- 11. North America Rehabilitation Industry Analysis, Insights and Forecast, 2019-2031
- 11.1. Market Analysis, Insights and Forecast - By Country/Sub-region
- 11.1.1. undefined
- 12. Europe Rehabilitation Industry Analysis, Insights and Forecast, 2019-2031
- 12.1. Market Analysis, Insights and Forecast - By Country/Sub-region
- 12.1.1. undefined
- 13. Asia Pacific Rehabilitation Industry Analysis, Insights and Forecast, 2019-2031
- 13.1. Market Analysis, Insights and Forecast - By Country/Sub-region
- 13.1.1. undefined
- 14. Middle East and Africa Rehabilitation Industry Analysis, Insights and Forecast, 2019-2031
- 14.1. Market Analysis, Insights and Forecast - By Country/Sub-region
- 14.1.1. undefined
- 15. South America Rehabilitation Industry Analysis, Insights and Forecast, 2019-2031
- 15.1. Market Analysis, Insights and Forecast - By Country/Sub-region
- 15.1.1. undefined
- 16. Competitive Analysis
- 16.1. Global Market Share Analysis 2024
- 16.2. Company Profiles
- 16.2.1 GF HEALTH PRODUCTS INC
- 16.2.1.1. Overview
- 16.2.1.2. Products
- 16.2.1.3. SWOT Analysis
- 16.2.1.4. Recent Developments
- 16.2.1.5. Financials (Based on Availability)
- 16.2.2 Invacare Corporation
- 16.2.2.1. Overview
- 16.2.2.2. Products
- 16.2.2.3. SWOT Analysis
- 16.2.2.4. Recent Developments
- 16.2.2.5. Financials (Based on Availability)
- 16.2.3 Marsi Bionics SL
- 16.2.3.1. Overview
- 16.2.3.2. Products
- 16.2.3.3. SWOT Analysis
- 16.2.3.4. Recent Developments
- 16.2.3.5. Financials (Based on Availability)
- 16.2.4 Hill-Rom Services INC
- 16.2.4.1. Overview
- 16.2.4.2. Products
- 16.2.4.3. SWOT Analysis
- 16.2.4.4. Recent Developments
- 16.2.4.5. Financials (Based on Availability)
- 16.2.5 Drive DeVilbiss Healthcare
- 16.2.5.1. Overview
- 16.2.5.2. Products
- 16.2.5.3. SWOT Analysis
- 16.2.5.4. Recent Developments
- 16.2.5.5. Financials (Based on Availability)
- 16.2.6 Dynatronics Corporation
- 16.2.6.1. Overview
- 16.2.6.2. Products
- 16.2.6.3. SWOT Analysis
- 16.2.6.4. Recent Developments
- 16.2.6.5. Financials (Based on Availability)
- 16.2.7 Ekso Bionics
- 16.2.7.1. Overview
- 16.2.7.2. Products
- 16.2.7.3. SWOT Analysis
- 16.2.7.4. Recent Developments
- 16.2.7.5. Financials (Based on Availability)
- 16.2.8 ReWalk Robotics
- 16.2.8.1. Overview
- 16.2.8.2. Products
- 16.2.8.3. SWOT Analysis
- 16.2.8.4. Recent Developments
- 16.2.8.5. Financials (Based on Availability)
- 16.2.9 Caremax Rehabilitation Equipment Co Ltd
- 16.2.9.1. Overview
- 16.2.9.2. Products
- 16.2.9.3. SWOT Analysis
- 16.2.9.4. Recent Developments
- 16.2.9.5. Financials (Based on Availability)
- 16.2.10 ULS Robotics Co Ltd
- 16.2.10.1. Overview
- 16.2.10.2. Products
- 16.2.10.3. SWOT Analysis
- 16.2.10.4. Recent Developments
- 16.2.10.5. Financials (Based on Availability)
- 16.2.11 Medline Industries Inc
- 16.2.11.1. Overview
- 16.2.11.2. Products
- 16.2.11.3. SWOT Analysis
- 16.2.11.4. Recent Developments
- 16.2.11.5. Financials (Based on Availability)
- 16.2.12 Roma Medical Aids Ltd
- 16.2.12.1. Overview
- 16.2.12.2. Products
- 16.2.12.3. SWOT Analysis
- 16.2.12.4. Recent Developments
- 16.2.12.5. Financials (Based on Availability)
- 16.2.13 Hospital Equipment Mfg Co
- 16.2.13.1. Overview
- 16.2.13.2. Products
- 16.2.13.3. SWOT Analysis
- 16.2.13.4. Recent Developments
- 16.2.13.5. Financials (Based on Availability)
- 16.2.1 GF HEALTH PRODUCTS INC
List of Figures
- Figure 1: Global Rehabilitation Industry Revenue Breakdown (Million, %) by Region 2024 & 2032
- Figure 2: Global Rehabilitation Industry Volume Breakdown (K Unit, %) by Region 2024 & 2032
- Figure 3: North America Rehabilitation Industry Revenue (Million), by Country 2024 & 2032
- Figure 4: North America Rehabilitation Industry Volume (K Unit), by Country 2024 & 2032
- Figure 5: North America Rehabilitation Industry Revenue Share (%), by Country 2024 & 2032
- Figure 6: North America Rehabilitation Industry Volume Share (%), by Country 2024 & 2032
- Figure 7: Europe Rehabilitation Industry Revenue (Million), by Country 2024 & 2032
- Figure 8: Europe Rehabilitation Industry Volume (K Unit), by Country 2024 & 2032
- Figure 9: Europe Rehabilitation Industry Revenue Share (%), by Country 2024 & 2032
- Figure 10: Europe Rehabilitation Industry Volume Share (%), by Country 2024 & 2032
- Figure 11: Asia Pacific Rehabilitation Industry Revenue (Million), by Country 2024 & 2032
- Figure 12: Asia Pacific Rehabilitation Industry Volume (K Unit), by Country 2024 & 2032
- Figure 13: Asia Pacific Rehabilitation Industry Revenue Share (%), by Country 2024 & 2032
- Figure 14: Asia Pacific Rehabilitation Industry Volume Share (%), by Country 2024 & 2032
- Figure 15: Middle East and Africa Rehabilitation Industry Revenue (Million), by Country 2024 & 2032
- Figure 16: Middle East and Africa Rehabilitation Industry Volume (K Unit), by Country 2024 & 2032
- Figure 17: Middle East and Africa Rehabilitation Industry Revenue Share (%), by Country 2024 & 2032
- Figure 18: Middle East and Africa Rehabilitation Industry Volume Share (%), by Country 2024 & 2032
- Figure 19: South America Rehabilitation Industry Revenue (Million), by Country 2024 & 2032
- Figure 20: South America Rehabilitation Industry Volume (K Unit), by Country 2024 & 2032
- Figure 21: South America Rehabilitation Industry Revenue Share (%), by Country 2024 & 2032
- Figure 22: South America Rehabilitation Industry Volume Share (%), by Country 2024 & 2032
- Figure 23: North America Rehabilitation Industry Revenue (Million), by Product Type 2024 & 2032
- Figure 24: North America Rehabilitation Industry Volume (K Unit), by Product Type 2024 & 2032
- Figure 25: North America Rehabilitation Industry Revenue Share (%), by Product Type 2024 & 2032
- Figure 26: North America Rehabilitation Industry Volume Share (%), by Product Type 2024 & 2032
- Figure 27: North America Rehabilitation Industry Revenue (Million), by Application 2024 & 2032
- Figure 28: North America Rehabilitation Industry Volume (K Unit), by Application 2024 & 2032
- Figure 29: North America Rehabilitation Industry Revenue Share (%), by Application 2024 & 2032
- Figure 30: North America Rehabilitation Industry Volume Share (%), by Application 2024 & 2032
- Figure 31: North America Rehabilitation Industry Revenue (Million), by End-User 2024 & 2032
- Figure 32: North America Rehabilitation Industry Volume (K Unit), by End-User 2024 & 2032
- Figure 33: North America Rehabilitation Industry Revenue Share (%), by End-User 2024 & 2032
- Figure 34: North America Rehabilitation Industry Volume Share (%), by End-User 2024 & 2032
- Figure 35: North America Rehabilitation Industry Revenue (Million), by Country 2024 & 2032
- Figure 36: North America Rehabilitation Industry Volume (K Unit), by Country 2024 & 2032
- Figure 37: North America Rehabilitation Industry Revenue Share (%), by Country 2024 & 2032
- Figure 38: North America Rehabilitation Industry Volume Share (%), by Country 2024 & 2032
- Figure 39: Europe Rehabilitation Industry Revenue (Million), by Product Type 2024 & 2032
- Figure 40: Europe Rehabilitation Industry Volume (K Unit), by Product Type 2024 & 2032
- Figure 41: Europe Rehabilitation Industry Revenue Share (%), by Product Type 2024 & 2032
- Figure 42: Europe Rehabilitation Industry Volume Share (%), by Product Type 2024 & 2032
- Figure 43: Europe Rehabilitation Industry Revenue (Million), by Application 2024 & 2032
- Figure 44: Europe Rehabilitation Industry Volume (K Unit), by Application 2024 & 2032
- Figure 45: Europe Rehabilitation Industry Revenue Share (%), by Application 2024 & 2032
- Figure 46: Europe Rehabilitation Industry Volume Share (%), by Application 2024 & 2032
- Figure 47: Europe Rehabilitation Industry Revenue (Million), by End-User 2024 & 2032
- Figure 48: Europe Rehabilitation Industry Volume (K Unit), by End-User 2024 & 2032
- Figure 49: Europe Rehabilitation Industry Revenue Share (%), by End-User 2024 & 2032
- Figure 50: Europe Rehabilitation Industry Volume Share (%), by End-User 2024 & 2032
- Figure 51: Europe Rehabilitation Industry Revenue (Million), by Country 2024 & 2032
- Figure 52: Europe Rehabilitation Industry Volume (K Unit), by Country 2024 & 2032
- Figure 53: Europe Rehabilitation Industry Revenue Share (%), by Country 2024 & 2032
- Figure 54: Europe Rehabilitation Industry Volume Share (%), by Country 2024 & 2032
- Figure 55: Asia Pacific Rehabilitation Industry Revenue (Million), by Product Type 2024 & 2032
- Figure 56: Asia Pacific Rehabilitation Industry Volume (K Unit), by Product Type 2024 & 2032
- Figure 57: Asia Pacific Rehabilitation Industry Revenue Share (%), by Product Type 2024 & 2032
- Figure 58: Asia Pacific Rehabilitation Industry Volume Share (%), by Product Type 2024 & 2032
- Figure 59: Asia Pacific Rehabilitation Industry Revenue (Million), by Application 2024 & 2032
- Figure 60: Asia Pacific Rehabilitation Industry Volume (K Unit), by Application 2024 & 2032
- Figure 61: Asia Pacific Rehabilitation Industry Revenue Share (%), by Application 2024 & 2032
- Figure 62: Asia Pacific Rehabilitation Industry Volume Share (%), by Application 2024 & 2032
- Figure 63: Asia Pacific Rehabilitation Industry Revenue (Million), by End-User 2024 & 2032
- Figure 64: Asia Pacific Rehabilitation Industry Volume (K Unit), by End-User 2024 & 2032
- Figure 65: Asia Pacific Rehabilitation Industry Revenue Share (%), by End-User 2024 & 2032
- Figure 66: Asia Pacific Rehabilitation Industry Volume Share (%), by End-User 2024 & 2032
- Figure 67: Asia Pacific Rehabilitation Industry Revenue (Million), by Country 2024 & 2032
- Figure 68: Asia Pacific Rehabilitation Industry Volume (K Unit), by Country 2024 & 2032
- Figure 69: Asia Pacific Rehabilitation Industry Revenue Share (%), by Country 2024 & 2032
- Figure 70: Asia Pacific Rehabilitation Industry Volume Share (%), by Country 2024 & 2032
- Figure 71: Middle East and Africa Rehabilitation Industry Revenue (Million), by Product Type 2024 & 2032
- Figure 72: Middle East and Africa Rehabilitation Industry Volume (K Unit), by Product Type 2024 & 2032
- Figure 73: Middle East and Africa Rehabilitation Industry Revenue Share (%), by Product Type 2024 & 2032
- Figure 74: Middle East and Africa Rehabilitation Industry Volume Share (%), by Product Type 2024 & 2032
- Figure 75: Middle East and Africa Rehabilitation Industry Revenue (Million), by Application 2024 & 2032
- Figure 76: Middle East and Africa Rehabilitation Industry Volume (K Unit), by Application 2024 & 2032
- Figure 77: Middle East and Africa Rehabilitation Industry Revenue Share (%), by Application 2024 & 2032
- Figure 78: Middle East and Africa Rehabilitation Industry Volume Share (%), by Application 2024 & 2032
- Figure 79: Middle East and Africa Rehabilitation Industry Revenue (Million), by End-User 2024 & 2032
- Figure 80: Middle East and Africa Rehabilitation Industry Volume (K Unit), by End-User 2024 & 2032
- Figure 81: Middle East and Africa Rehabilitation Industry Revenue Share (%), by End-User 2024 & 2032
- Figure 82: Middle East and Africa Rehabilitation Industry Volume Share (%), by End-User 2024 & 2032
- Figure 83: Middle East and Africa Rehabilitation Industry Revenue (Million), by Country 2024 & 2032
- Figure 84: Middle East and Africa Rehabilitation Industry Volume (K Unit), by Country 2024 & 2032
- Figure 85: Middle East and Africa Rehabilitation Industry Revenue Share (%), by Country 2024 & 2032
- Figure 86: Middle East and Africa Rehabilitation Industry Volume Share (%), by Country 2024 & 2032
- Figure 87: South America Rehabilitation Industry Revenue (Million), by Product Type 2024 & 2032
- Figure 88: South America Rehabilitation Industry Volume (K Unit), by Product Type 2024 & 2032
- Figure 89: South America Rehabilitation Industry Revenue Share (%), by Product Type 2024 & 2032
- Figure 90: South America Rehabilitation Industry Volume Share (%), by Product Type 2024 & 2032
- Figure 91: South America Rehabilitation Industry Revenue (Million), by Application 2024 & 2032
- Figure 92: South America Rehabilitation Industry Volume (K Unit), by Application 2024 & 2032
- Figure 93: South America Rehabilitation Industry Revenue Share (%), by Application 2024 & 2032
- Figure 94: South America Rehabilitation Industry Volume Share (%), by Application 2024 & 2032
- Figure 95: South America Rehabilitation Industry Revenue (Million), by End-User 2024 & 2032
- Figure 96: South America Rehabilitation Industry Volume (K Unit), by End-User 2024 & 2032
- Figure 97: South America Rehabilitation Industry Revenue Share (%), by End-User 2024 & 2032
- Figure 98: South America Rehabilitation Industry Volume Share (%), by End-User 2024 & 2032
- Figure 99: South America Rehabilitation Industry Revenue (Million), by Country 2024 & 2032
- Figure 100: South America Rehabilitation Industry Volume (K Unit), by Country 2024 & 2032
- Figure 101: South America Rehabilitation Industry Revenue Share (%), by Country 2024 & 2032
- Figure 102: South America Rehabilitation Industry Volume Share (%), by Country 2024 & 2032
List of Tables
- Table 1: Global Rehabilitation Industry Revenue Million Forecast, by Region 2019 & 2032
- Table 2: Global Rehabilitation Industry Volume K Unit Forecast, by Region 2019 & 2032
- Table 3: Global Rehabilitation Industry Revenue Million Forecast, by Product Type 2019 & 2032
- Table 4: Global Rehabilitation Industry Volume K Unit Forecast, by Product Type 2019 & 2032
- Table 5: Global Rehabilitation Industry Revenue Million Forecast, by Application 2019 & 2032
- Table 6: Global Rehabilitation Industry Volume K Unit Forecast, by Application 2019 & 2032
- Table 7: Global Rehabilitation Industry Revenue Million Forecast, by End-User 2019 & 2032
- Table 8: Global Rehabilitation Industry Volume K Unit Forecast, by End-User 2019 & 2032
- Table 9: Global Rehabilitation Industry Revenue Million Forecast, by Region 2019 & 2032
- Table 10: Global Rehabilitation Industry Volume K Unit Forecast, by Region 2019 & 2032
- Table 11: Global Rehabilitation Industry Revenue Million Forecast, by Country 2019 & 2032
- Table 12: Global Rehabilitation Industry Volume K Unit Forecast, by Country 2019 & 2032
- Table 13: Global Rehabilitation Industry Revenue Million Forecast, by Country 2019 & 2032
- Table 14: Global Rehabilitation Industry Volume K Unit Forecast, by Country 2019 & 2032
- Table 15: Global Rehabilitation Industry Revenue Million Forecast, by Country 2019 & 2032
- Table 16: Global Rehabilitation Industry Volume K Unit Forecast, by Country 2019 & 2032
- Table 17: Global Rehabilitation Industry Revenue Million Forecast, by Country 2019 & 2032
- Table 18: Global Rehabilitation Industry Volume K Unit Forecast, by Country 2019 & 2032
- Table 19: Global Rehabilitation Industry Revenue Million Forecast, by Country 2019 & 2032
- Table 20: Global Rehabilitation Industry Volume K Unit Forecast, by Country 2019 & 2032
- Table 21: Global Rehabilitation Industry Revenue Million Forecast, by Product Type 2019 & 2032
- Table 22: Global Rehabilitation Industry Volume K Unit Forecast, by Product Type 2019 & 2032
- Table 23: Global Rehabilitation Industry Revenue Million Forecast, by Application 2019 & 2032
- Table 24: Global Rehabilitation Industry Volume K Unit Forecast, by Application 2019 & 2032
- Table 25: Global Rehabilitation Industry Revenue Million Forecast, by End-User 2019 & 2032
- Table 26: Global Rehabilitation Industry Volume K Unit Forecast, by End-User 2019 & 2032
- Table 27: Global Rehabilitation Industry Revenue Million Forecast, by Country 2019 & 2032
- Table 28: Global Rehabilitation Industry Volume K Unit Forecast, by Country 2019 & 2032
- Table 29: United States Rehabilitation Industry Revenue (Million) Forecast, by Application 2019 & 2032
- Table 30: United States Rehabilitation Industry Volume (K Unit) Forecast, by Application 2019 & 2032
- Table 31: Canada Rehabilitation Industry Revenue (Million) Forecast, by Application 2019 & 2032
- Table 32: Canada Rehabilitation Industry Volume (K Unit) Forecast, by Application 2019 & 2032
- Table 33: Mexico Rehabilitation Industry Revenue (Million) Forecast, by Application 2019 & 2032
- Table 34: Mexico Rehabilitation Industry Volume (K Unit) Forecast, by Application 2019 & 2032
- Table 35: Global Rehabilitation Industry Revenue Million Forecast, by Product Type 2019 & 2032
- Table 36: Global Rehabilitation Industry Volume K Unit Forecast, by Product Type 2019 & 2032
- Table 37: Global Rehabilitation Industry Revenue Million Forecast, by Application 2019 & 2032
- Table 38: Global Rehabilitation Industry Volume K Unit Forecast, by Application 2019 & 2032
- Table 39: Global Rehabilitation Industry Revenue Million Forecast, by End-User 2019 & 2032
- Table 40: Global Rehabilitation Industry Volume K Unit Forecast, by End-User 2019 & 2032
- Table 41: Global Rehabilitation Industry Revenue Million Forecast, by Country 2019 & 2032
- Table 42: Global Rehabilitation Industry Volume K Unit Forecast, by Country 2019 & 2032
- Table 43: Germany Rehabilitation Industry Revenue (Million) Forecast, by Application 2019 & 2032
- Table 44: Germany Rehabilitation Industry Volume (K Unit) Forecast, by Application 2019 & 2032
- Table 45: United Kingdom Rehabilitation Industry Revenue (Million) Forecast, by Application 2019 & 2032
- Table 46: United Kingdom Rehabilitation Industry Volume (K Unit) Forecast, by Application 2019 & 2032
- Table 47: France Rehabilitation Industry Revenue (Million) Forecast, by Application 2019 & 2032
- Table 48: France Rehabilitation Industry Volume (K Unit) Forecast, by Application 2019 & 2032
- Table 49: Italy Rehabilitation Industry Revenue (Million) Forecast, by Application 2019 & 2032
- Table 50: Italy Rehabilitation Industry Volume (K Unit) Forecast, by Application 2019 & 2032
- Table 51: Spain Rehabilitation Industry Revenue (Million) Forecast, by Application 2019 & 2032
- Table 52: Spain Rehabilitation Industry Volume (K Unit) Forecast, by Application 2019 & 2032
- Table 53: Rest of Europe Rehabilitation Industry Revenue (Million) Forecast, by Application 2019 & 2032
- Table 54: Rest of Europe Rehabilitation Industry Volume (K Unit) Forecast, by Application 2019 & 2032
- Table 55: Global Rehabilitation Industry Revenue Million Forecast, by Product Type 2019 & 2032
- Table 56: Global Rehabilitation Industry Volume K Unit Forecast, by Product Type 2019 & 2032
- Table 57: Global Rehabilitation Industry Revenue Million Forecast, by Application 2019 & 2032
- Table 58: Global Rehabilitation Industry Volume K Unit Forecast, by Application 2019 & 2032
- Table 59: Global Rehabilitation Industry Revenue Million Forecast, by End-User 2019 & 2032
- Table 60: Global Rehabilitation Industry Volume K Unit Forecast, by End-User 2019 & 2032
- Table 61: Global Rehabilitation Industry Revenue Million Forecast, by Country 2019 & 2032
- Table 62: Global Rehabilitation Industry Volume K Unit Forecast, by Country 2019 & 2032
- Table 63: China Rehabilitation Industry Revenue (Million) Forecast, by Application 2019 & 2032
- Table 64: China Rehabilitation Industry Volume (K Unit) Forecast, by Application 2019 & 2032
- Table 65: Japan Rehabilitation Industry Revenue (Million) Forecast, by Application 2019 & 2032
- Table 66: Japan Rehabilitation Industry Volume (K Unit) Forecast, by Application 2019 & 2032
- Table 67: India Rehabilitation Industry Revenue (Million) Forecast, by Application 2019 & 2032
- Table 68: India Rehabilitation Industry Volume (K Unit) Forecast, by Application 2019 & 2032
- Table 69: Australia Rehabilitation Industry Revenue (Million) Forecast, by Application 2019 & 2032
- Table 70: Australia Rehabilitation Industry Volume (K Unit) Forecast, by Application 2019 & 2032
- Table 71: South Korea Rehabilitation Industry Revenue (Million) Forecast, by Application 2019 & 2032
- Table 72: South Korea Rehabilitation Industry Volume (K Unit) Forecast, by Application 2019 & 2032
- Table 73: Rest of Asia Pacific Rehabilitation Industry Revenue (Million) Forecast, by Application 2019 & 2032
- Table 74: Rest of Asia Pacific Rehabilitation Industry Volume (K Unit) Forecast, by Application 2019 & 2032
- Table 75: Global Rehabilitation Industry Revenue Million Forecast, by Product Type 2019 & 2032
- Table 76: Global Rehabilitation Industry Volume K Unit Forecast, by Product Type 2019 & 2032
- Table 77: Global Rehabilitation Industry Revenue Million Forecast, by Application 2019 & 2032
- Table 78: Global Rehabilitation Industry Volume K Unit Forecast, by Application 2019 & 2032
- Table 79: Global Rehabilitation Industry Revenue Million Forecast, by End-User 2019 & 2032
- Table 80: Global Rehabilitation Industry Volume K Unit Forecast, by End-User 2019 & 2032
- Table 81: Global Rehabilitation Industry Revenue Million Forecast, by Country 2019 & 2032
- Table 82: Global Rehabilitation Industry Volume K Unit Forecast, by Country 2019 & 2032
- Table 83: GCC Rehabilitation Industry Revenue (Million) Forecast, by Application 2019 & 2032
- Table 84: GCC Rehabilitation Industry Volume (K Unit) Forecast, by Application 2019 & 2032
- Table 85: South Africa Rehabilitation Industry Revenue (Million) Forecast, by Application 2019 & 2032
- Table 86: South Africa Rehabilitation Industry Volume (K Unit) Forecast, by Application 2019 & 2032
- Table 87: Rest of Middle East and Africa Rehabilitation Industry Revenue (Million) Forecast, by Application 2019 & 2032
- Table 88: Rest of Middle East and Africa Rehabilitation Industry Volume (K Unit) Forecast, by Application 2019 & 2032
- Table 89: Global Rehabilitation Industry Revenue Million Forecast, by Product Type 2019 & 2032
- Table 90: Global Rehabilitation Industry Volume K Unit Forecast, by Product Type 2019 & 2032
- Table 91: Global Rehabilitation Industry Revenue Million Forecast, by Application 2019 & 2032
- Table 92: Global Rehabilitation Industry Volume K Unit Forecast, by Application 2019 & 2032
- Table 93: Global Rehabilitation Industry Revenue Million Forecast, by End-User 2019 & 2032
- Table 94: Global Rehabilitation Industry Volume K Unit Forecast, by End-User 2019 & 2032
- Table 95: Global Rehabilitation Industry Revenue Million Forecast, by Country 2019 & 2032
- Table 96: Global Rehabilitation Industry Volume K Unit Forecast, by Country 2019 & 2032
- Table 97: Brazil Rehabilitation Industry Revenue (Million) Forecast, by Application 2019 & 2032
- Table 98: Brazil Rehabilitation Industry Volume (K Unit) Forecast, by Application 2019 & 2032
- Table 99: Argentina Rehabilitation Industry Revenue (Million) Forecast, by Application 2019 & 2032
- Table 100: Argentina Rehabilitation Industry Volume (K Unit) Forecast, by Application 2019 & 2032
- Table 101: Rest of South America Rehabilitation Industry Revenue (Million) Forecast, by Application 2019 & 2032
- Table 102: Rest of South America Rehabilitation Industry Volume (K Unit) Forecast, by Application 2019 & 2032
Frequently Asked Questions
1. What is the projected Compound Annual Growth Rate (CAGR) of the Rehabilitation Industry?
The projected CAGR is approximately 4.92%.
2. Which companies are prominent players in the Rehabilitation Industry?
Key companies in the market include GF HEALTH PRODUCTS INC, Invacare Corporation, Marsi Bionics SL, Hill-Rom Services INC, Drive DeVilbiss Healthcare, Dynatronics Corporation, Ekso Bionics, ReWalk Robotics, Caremax Rehabilitation Equipment Co Ltd, ULS Robotics Co Ltd, Medline Industries Inc, Roma Medical Aids Ltd, Hospital Equipment Mfg Co.
3. What are the main segments of the Rehabilitation Industry?
The market segments include Product Type, Application, End-User.
4. Can you provide details about the market size?
The market size is estimated to be USD 14.94 Million as of 2022.
5. What are some drivers contributing to market growth?
Increasing Burden of Chronic Diseases; Rising Demand for Rehabilitation Therapies; Rising Awareness Initiatives Regarding Rehabilitation Therapies.
6. What are the notable trends driving market growth?
Walking Assist Devices Segment Estimated to Witness a Healthy Growth Over the Forecast Period.
7. Are there any restraints impacting market growth?
Unfavorable Reimbursements and Lack of Awareness.
8. Can you provide examples of recent developments in the market?
February 2022- Lusio Rehab launched a wearable rehabilitation device called LusioMATE that motivates patients to engage more with their physical therapy and rehab programs at Arab Health 2022.
9. What pricing options are available for accessing the report?
Pricing options include single-user, multi-user, and enterprise licenses priced at USD 4750, USD 5250, and USD 8750 respectively.
10. Is the market size provided in terms of value or volume?
The market size is provided in terms of value, measured in Million and volume, measured in K Unit.
11. Are there any specific market keywords associated with the report?
Yes, the market keyword associated with the report is "Rehabilitation Industry," which aids in identifying and referencing the specific market segment covered.
12. How do I determine which pricing option suits my needs best?
The pricing options vary based on user requirements and access needs. Individual users may opt for single-user licenses, while businesses requiring broader access may choose multi-user or enterprise licenses for cost-effective access to the report.
13. Are there any additional resources or data provided in the Rehabilitation Industry report?
While the report offers comprehensive insights, it's advisable to review the specific contents or supplementary materials provided to ascertain if additional resources or data are available.
14. How can I stay updated on further developments or reports in the Rehabilitation Industry?
To stay informed about further developments, trends, and reports in the Rehabilitation Industry, consider subscribing to industry newsletters, following relevant companies and organizations, or regularly checking reputable industry news sources and publications.
Methodology
Step 1 - Identification of Relevant Samples Size from Population Database


Step 2 - Approaches for Defining Global Market Size (Value, Volume* & Price*)

Note*: In applicable scenarios
Step 3 - Data Sources
Primary Research
- Web Analytics
- Survey Reports
- Research Institute
- Latest Research Reports
- Opinion Leaders
Secondary Research
- Annual Reports
- White Paper
- Latest Press Release
- Industry Association
- Paid Database
- Investor Presentations

Step 4 - Data Triangulation
Involves using different sources of information in order to increase the validity of a study
These sources are likely to be stakeholders in a program - participants, other researchers, program staff, other community members, and so on.
Then we put all data in single framework & apply various statistical tools to find out the dynamic on the market.
During the analysis stage, feedback from the stakeholder groups would be compared to determine areas of agreement as well as areas of divergence


