
Key Insights
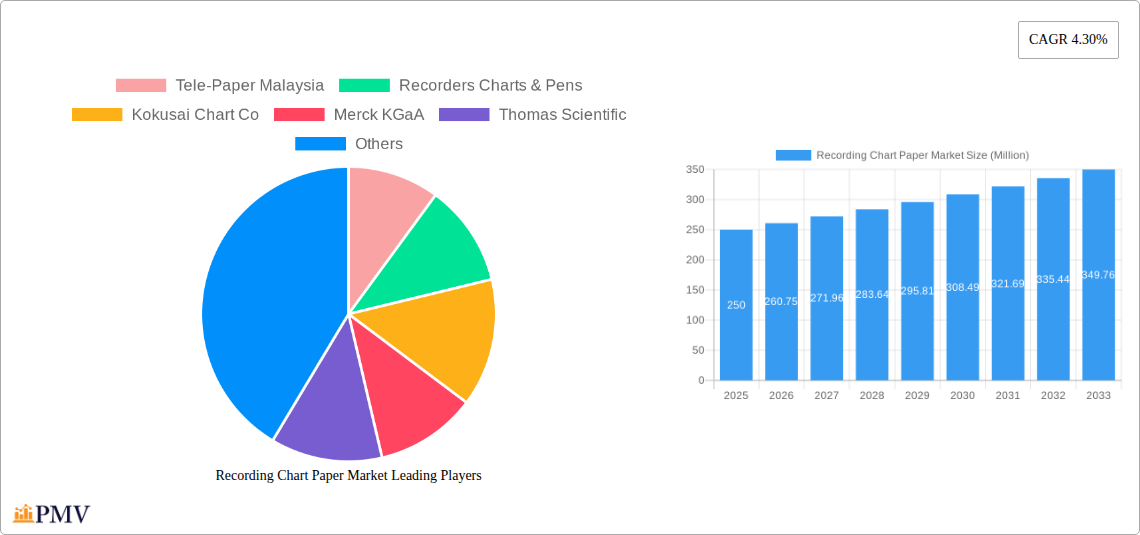
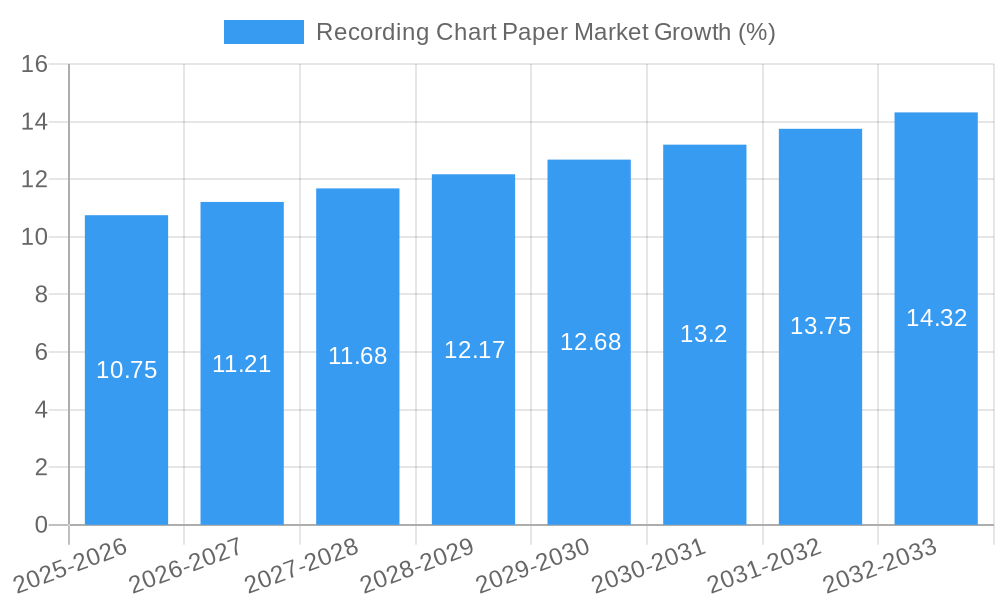
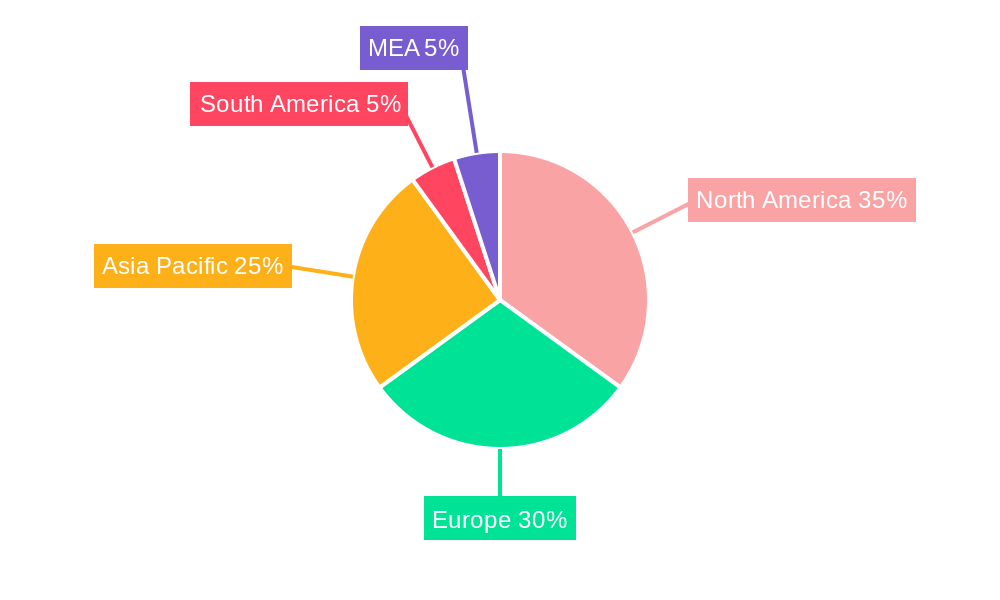
The global Recording Chart Paper Market, valued at approximately $250 million in 2025, is projected to experience steady growth, exhibiting a Compound Annual Growth Rate (CAGR) of 4.30% from 2025 to 2033. This growth is primarily driven by the increasing prevalence of chronic diseases requiring extensive monitoring, the rising number of hospitals and diagnostic centers globally, and technological advancements leading to improved paper quality and patient data accuracy. The Cardiology Monitoring Recording Chart Papers segment currently holds the largest market share due to the high volume of cardiac procedures and the critical need for precise record-keeping. However, the Fetal Monitoring Recording Chart Papers segment is expected to witness significant growth driven by increasing focus on maternal and child healthcare globally. Geographic growth is anticipated across all regions, with North America and Europe maintaining a substantial market share due to established healthcare infrastructure and high healthcare spending. However, the Asia Pacific region is projected to experience the fastest growth rate fueled by increasing healthcare investments and rising disposable incomes. Market restraints include the rising adoption of electronic health records (EHRs) and digital monitoring systems, posing a long-term challenge to the traditional chart paper market. However, the continued need for physical records in certain settings and situations, coupled with the cost-effectiveness of chart paper in resource-constrained environments, will ensure sustained market demand for the foreseeable future.
The competitive landscape is relatively fragmented, with key players such as Tele-Paper Malaysia, Recorders Charts & Pens, and Kokusai Chart Co. focusing on product differentiation and geographic expansion to maintain market share. Strategic alliances, product innovations (e.g., specialized papers for specific monitoring needs), and a focus on sustainable and environmentally friendly options will be critical for success in this evolving market. The market's future hinges on the balance between digital transformation in healthcare and the persistent requirement for physical records, demanding adaptability and strategic foresight from market participants. The forecast period anticipates a gradual yet consistent expansion in market size driven by the factors outlined above, with a projected value significantly exceeding $350 million by 2033.
Recording Chart Paper Market: A Comprehensive Report (2019-2033)
This comprehensive report provides a detailed analysis of the global Recording Chart Paper Market, offering invaluable insights for industry stakeholders, investors, and researchers. The study covers the period from 2019 to 2033, with 2025 serving as the base and estimated year. The forecast period spans from 2025 to 2033, while the historical period encompasses 2019-2024. The market is segmented by product type (Cardiology Monitoring Recording Chart Papers, Fetal Monitoring Recording Chart Papers, OBGYN Recording Chart Paper, Other Product Types) and end-user (Hospitals, Diagnostic Centers, Clinics). Key players analyzed include Tele-Paper Malaysia, Recorders Charts & Pens, Kokusai Chart Co, Merck KGaA, Thomas Scientific, Precision Charts Inc, Pirrone srl, Cardinal Health, GlobalSpec, and DART TECHNOLOGIES. The report projects a market value of xx Million by 2033.
Recording Chart Paper Market Market Structure & Competitive Dynamics
The Recording Chart Paper Market exhibits a moderately concentrated structure, with a few major players holding significant market share. The market share of the top five players is estimated at xx%, indicating some level of competition. Innovation within the sector is primarily focused on improving paper quality, enhancing recording capabilities, and exploring eco-friendly alternatives. Regulatory frameworks, particularly those related to healthcare and medical device manufacturing, significantly impact market dynamics. The market sees limited product substitution, with digital alternatives like electronic health records gaining traction but not fully replacing chart paper in certain applications. End-user trends towards improved healthcare infrastructure and rising diagnostic procedures drive market growth. M&A activity has been moderate, with xx Million in deal value recorded in the last five years. Key strategic activities include partnerships to expand distribution networks and technological collaborations to improve product offerings.
- Market Concentration: Moderately concentrated, with top 5 players holding xx% market share.
- Innovation: Focus on improved paper quality, enhanced recording features, and eco-friendly materials.
- Regulatory Landscape: Stringent regulations governing medical devices and healthcare products.
- Product Substitution: Limited substitution, with digital records gaining some market share.
- M&A Activity: Moderate activity, with an estimated xx Million in deal value over the past five years.
Recording Chart Paper Market Industry Trends & Insights
The Recording Chart Paper Market is projected to experience a CAGR of xx% during the forecast period (2025-2033). Several factors contribute to this growth. The increasing prevalence of chronic diseases necessitates more frequent diagnostic procedures, fueling demand for recording chart papers. Technological advancements, while introducing digital alternatives, haven't fully replaced the need for physical records in certain healthcare settings. Consumer preferences for clear, reliable, and easily accessible medical records maintain a steady demand for high-quality chart paper. However, competitive pressures from digital solutions and the rising cost of raw materials pose challenges. Market penetration of digital recording solutions is currently at xx%, but traditional chart paper maintains a dominant share due to its reliability, cost-effectiveness, and ease of use in certain applications.
Dominant Markets & Segments in Recording Chart Paper Market
North America currently dominates the Recording Chart Paper Market, driven by well-established healthcare infrastructure and high healthcare expenditure.
- Leading Region: North America
- Leading Product Type: Cardiology Monitoring Recording Chart Papers (Driven by the high prevalence of cardiovascular diseases).
- Leading End-User: Hospitals (Due to the large volume of patient records and procedures conducted).
Key Drivers for North American Dominance:
- Robust healthcare infrastructure and high adoption of advanced medical technologies.
- High healthcare expenditure and a large aging population.
- Stringent regulatory frameworks ensuring high-quality medical devices.
The European market is also a significant contributor, exhibiting steady growth propelled by improving healthcare access and increased focus on patient care. Asia-Pacific demonstrates high growth potential, driven by expanding healthcare infrastructure, rising disposable incomes, and a growing population.
Recording Chart Paper Market Product Innovations
Recent innovations in the recording chart paper market focus on enhancing paper quality for improved clarity and durability, incorporating water-resistant properties, and exploring sustainable and eco-friendly materials to reduce environmental impact. New applications include specialized chart papers tailored for specific diagnostic procedures, offering improved functionalities like better ink adhesion and resistance to smudging. Competitive advantages stem from offering superior paper quality, optimized printing properties, tailored solutions for specific medical applications, and environmentally sustainable production processes.
Report Segmentation & Scope
Product Type:
- Cardiology Monitoring Recording Chart Papers: This segment is expected to grow at a CAGR of xx% due to the rising prevalence of cardiovascular diseases. The segment is characterized by high competition among manufacturers focusing on quality and specialized features.
- Fetal Monitoring Recording Chart Papers: This segment is projected to grow at a CAGR of xx%, driven by advancements in prenatal care and increasing birth rates. The market is relatively niche, but competition is present among specialized manufacturers.
- OBGYN Recording Chart Paper: This segment shows a projected CAGR of xx%, influenced by improved access to women's healthcare. The market structure is similar to fetal monitoring papers, with specialized players competing for market share.
- Other Product Types: This segment encompasses a range of applications and has a projected CAGR of xx%. Competition varies widely across sub-segments.
End-User:
- Hospitals: The largest segment, representing xx% of the market, driven by high volume patient care. Competitive intensity is high among manufacturers vying for hospital contracts.
- Diagnostic Centers: This segment is characterized by moderate growth and competition, driven by increasing outsourcing of diagnostic services.
- Clinics: This segment is smaller but shows potential growth, propelled by expansion in private healthcare and specialized clinics.
Key Drivers of Recording Chart Paper Market Growth
The Recording Chart Paper Market's growth is propelled by several factors: the rising prevalence of chronic diseases, necessitating increased diagnostic testing and record-keeping; the continued importance of physical medical records alongside digital solutions, especially in situations demanding immediate documentation; and advancements in paper manufacturing technology, offering improved quality, durability, and specialized functionalities. Furthermore, expanding healthcare infrastructure globally contributes to higher demand for medical chart papers.
Challenges in the Recording Chart Paper Market Sector
The market faces challenges including increasing adoption of digital health records, which potentially reduces the demand for chart papers; fluctuations in raw material prices, affecting production costs; and stringent regulatory requirements for medical devices, requiring compliance and certification processes. Competition from both established and new market entrants further complicates the market landscape. These factors impose constraints on market growth and profitability.
Leading Players in the Recording Chart Paper Market Market
- Tele-Paper Malaysia
- Recorders Charts & Pens
- Kokusai Chart Co
- Merck KGaA
- Thomas Scientific
- Precision Charts Inc
- Pirrone srl
- Cardinal Health
- GlobalSpec
- DART TECHNOLOGIES
Key Developments in Recording Chart Paper Market Sector
- 2022-Q4: Precision Charts Inc. launched a new line of eco-friendly chart papers.
- 2023-Q1: Merck KGaA invested in research and development for improved paper coatings.
- 2023-Q3: A merger between two smaller chart paper manufacturers resulted in increased market consolidation. (Further details on merger would be included in the full report)
Strategic Recording Chart Paper Market Market Outlook
The Recording Chart Paper Market presents considerable opportunities for growth, driven by continued demand for reliable medical records and advancements in sustainable manufacturing practices. Strategic focus should be placed on innovation, such as developing specialized papers for niche applications, and adopting sustainable manufacturing processes. Expansion into emerging markets with growing healthcare sectors also presents significant potential. Partnerships and collaborations to leverage technological advancements and expand distribution networks will be crucial for market success.
Recording Chart Paper Market Segmentation
-
1. Product Type
- 1.1. Cardiology Monitoring Recording Chart Papers
- 1.2. Fetal Monitoring Recording Chart Papers
- 1.3. OBGYN Recording Chart Paper
- 1.4. Other Product Types
-
2. End User
- 2.1. Hospitals
- 2.2. Diagnostic Centers
- 2.3. Clinics
Recording Chart Paper Market Segmentation By Geography
-
1. North America
- 1.1. United States
- 1.2. Canada
- 1.3. Mexico
-
2. Europe
- 2.1. Germany
- 2.2. United Kingdom
- 2.3. France
- 2.4. Italy
- 2.5. Spain
- 2.6. Rest of Europe
-
3. Asia Pacific
- 3.1. China
- 3.2. Japan
- 3.3. India
- 3.4. Australia
- 3.5. South Korea
- 3.6. Rest of Asia Pacific
- 4. Middle East
-
5. GCC
- 5.1. South Africa
- 5.2. Rest of Middle East
-
6. South America
- 6.1. Brazil
- 6.2. Argentina
- 6.3. Rest of South America
Recording Chart Paper Market REPORT HIGHLIGHTS
| Aspects | Details |
|---|---|
| Study Period | 2019-2033 |
| Base Year | 2024 |
| Estimated Year | 2025 |
| Forecast Period | 2025-2033 |
| Historical Period | 2019-2024 |
| Growth Rate | CAGR of 4.30% from 2019-2033 |
| Segmentation |
|
Table of Contents
- 1. Introduction
- 1.1. Research Scope
- 1.2. Market Segmentation
- 1.3. Research Methodology
- 1.4. Definitions and Assumptions
- 2. Executive Summary
- 2.1. Introduction
- 3. Market Dynamics
- 3.1. Introduction
- 3.2. Market Drivers
- 3.2.1. ; Increasing Prevalence of Cardiovascular Diseases; Increasing Geriatric Population and Births
- 3.3. Market Restrains
- 3.3.1. ; Growing Usage of Alternative Digital Instruments
- 3.4. Market Trends
- 3.4.1. Fetal Monitoring Recording Chart Papers Segment is Expected to be the Fastest Growing Segment.
- 4. Market Factor Analysis
- 4.1. Porters Five Forces
- 4.2. Supply/Value Chain
- 4.3. PESTEL analysis
- 4.4. Market Entropy
- 4.5. Patent/Trademark Analysis
- 5. Global Recording Chart Paper Market Analysis, Insights and Forecast, 2019-2031
- 5.1. Market Analysis, Insights and Forecast - by Product Type
- 5.1.1. Cardiology Monitoring Recording Chart Papers
- 5.1.2. Fetal Monitoring Recording Chart Papers
- 5.1.3. OBGYN Recording Chart Paper
- 5.1.4. Other Product Types
- 5.2. Market Analysis, Insights and Forecast - by End User
- 5.2.1. Hospitals
- 5.2.2. Diagnostic Centers
- 5.2.3. Clinics
- 5.3. Market Analysis, Insights and Forecast - by Region
- 5.3.1. North America
- 5.3.2. Europe
- 5.3.3. Asia Pacific
- 5.3.4. Middle East
- 5.3.5. GCC
- 5.3.6. South America
- 5.1. Market Analysis, Insights and Forecast - by Product Type
- 6. North America Recording Chart Paper Market Analysis, Insights and Forecast, 2019-2031
- 6.1. Market Analysis, Insights and Forecast - by Product Type
- 6.1.1. Cardiology Monitoring Recording Chart Papers
- 6.1.2. Fetal Monitoring Recording Chart Papers
- 6.1.3. OBGYN Recording Chart Paper
- 6.1.4. Other Product Types
- 6.2. Market Analysis, Insights and Forecast - by End User
- 6.2.1. Hospitals
- 6.2.2. Diagnostic Centers
- 6.2.3. Clinics
- 6.1. Market Analysis, Insights and Forecast - by Product Type
- 7. Europe Recording Chart Paper Market Analysis, Insights and Forecast, 2019-2031
- 7.1. Market Analysis, Insights and Forecast - by Product Type
- 7.1.1. Cardiology Monitoring Recording Chart Papers
- 7.1.2. Fetal Monitoring Recording Chart Papers
- 7.1.3. OBGYN Recording Chart Paper
- 7.1.4. Other Product Types
- 7.2. Market Analysis, Insights and Forecast - by End User
- 7.2.1. Hospitals
- 7.2.2. Diagnostic Centers
- 7.2.3. Clinics
- 7.1. Market Analysis, Insights and Forecast - by Product Type
- 8. Asia Pacific Recording Chart Paper Market Analysis, Insights and Forecast, 2019-2031
- 8.1. Market Analysis, Insights and Forecast - by Product Type
- 8.1.1. Cardiology Monitoring Recording Chart Papers
- 8.1.2. Fetal Monitoring Recording Chart Papers
- 8.1.3. OBGYN Recording Chart Paper
- 8.1.4. Other Product Types
- 8.2. Market Analysis, Insights and Forecast - by End User
- 8.2.1. Hospitals
- 8.2.2. Diagnostic Centers
- 8.2.3. Clinics
- 8.1. Market Analysis, Insights and Forecast - by Product Type
- 9. Middle East Recording Chart Paper Market Analysis, Insights and Forecast, 2019-2031
- 9.1. Market Analysis, Insights and Forecast - by Product Type
- 9.1.1. Cardiology Monitoring Recording Chart Papers
- 9.1.2. Fetal Monitoring Recording Chart Papers
- 9.1.3. OBGYN Recording Chart Paper
- 9.1.4. Other Product Types
- 9.2. Market Analysis, Insights and Forecast - by End User
- 9.2.1. Hospitals
- 9.2.2. Diagnostic Centers
- 9.2.3. Clinics
- 9.1. Market Analysis, Insights and Forecast - by Product Type
- 10. GCC Recording Chart Paper Market Analysis, Insights and Forecast, 2019-2031
- 10.1. Market Analysis, Insights and Forecast - by Product Type
- 10.1.1. Cardiology Monitoring Recording Chart Papers
- 10.1.2. Fetal Monitoring Recording Chart Papers
- 10.1.3. OBGYN Recording Chart Paper
- 10.1.4. Other Product Types
- 10.2. Market Analysis, Insights and Forecast - by End User
- 10.2.1. Hospitals
- 10.2.2. Diagnostic Centers
- 10.2.3. Clinics
- 10.1. Market Analysis, Insights and Forecast - by Product Type
- 11. South America Recording Chart Paper Market Analysis, Insights and Forecast, 2019-2031
- 11.1. Market Analysis, Insights and Forecast - by Product Type
- 11.1.1. Cardiology Monitoring Recording Chart Papers
- 11.1.2. Fetal Monitoring Recording Chart Papers
- 11.1.3. OBGYN Recording Chart Paper
- 11.1.4. Other Product Types
- 11.2. Market Analysis, Insights and Forecast - by End User
- 11.2.1. Hospitals
- 11.2.2. Diagnostic Centers
- 11.2.3. Clinics
- 11.1. Market Analysis, Insights and Forecast - by Product Type
- 12. North America Recording Chart Paper Market Analysis, Insights and Forecast, 2019-2031
- 12.1. Market Analysis, Insights and Forecast - By Country/Sub-region
- 12.1.1 United States
- 12.1.2 Canada
- 12.1.3 Mexico
- 13. Europe Recording Chart Paper Market Analysis, Insights and Forecast, 2019-2031
- 13.1. Market Analysis, Insights and Forecast - By Country/Sub-region
- 13.1.1 Germany
- 13.1.2 United Kingdom
- 13.1.3 France
- 13.1.4 Italy
- 13.1.5 Spain
- 13.1.6 Rest of Europe
- 14. Asia Pacific Recording Chart Paper Market Analysis, Insights and Forecast, 2019-2031
- 14.1. Market Analysis, Insights and Forecast - By Country/Sub-region
- 14.1.1 China
- 14.1.2 Japan
- 14.1.3 India
- 14.1.4 Australia
- 14.1.5 South Korea
- 14.1.6 Rest of Asia Pacific
- 15. South America Recording Chart Paper Market Analysis, Insights and Forecast, 2019-2031
- 15.1. Market Analysis, Insights and Forecast - By Country/Sub-region
- 15.1.1 Brazil
- 15.1.2 Argentina
- 15.1.3 Rest of South America
- 16. MEA Recording Chart Paper Market Analysis, Insights and Forecast, 2019-2031
- 16.1. Market Analysis, Insights and Forecast - By Country/Sub-region
- 16.1.1 United Arab Emirates
- 16.1.2 Saudi Arabia
- 16.1.3 South Africa
- 16.1.4 Rest of Middle East and Africa
- 17. Competitive Analysis
- 17.1. Global Market Share Analysis 2024
- 17.2. Company Profiles
- 17.2.1 Tele-Paper Malaysia
- 17.2.1.1. Overview
- 17.2.1.2. Products
- 17.2.1.3. SWOT Analysis
- 17.2.1.4. Recent Developments
- 17.2.1.5. Financials (Based on Availability)
- 17.2.2 Recorders Charts & Pens
- 17.2.2.1. Overview
- 17.2.2.2. Products
- 17.2.2.3. SWOT Analysis
- 17.2.2.4. Recent Developments
- 17.2.2.5. Financials (Based on Availability)
- 17.2.3 Kokusai Chart Co
- 17.2.3.1. Overview
- 17.2.3.2. Products
- 17.2.3.3. SWOT Analysis
- 17.2.3.4. Recent Developments
- 17.2.3.5. Financials (Based on Availability)
- 17.2.4 Merck KGaA
- 17.2.4.1. Overview
- 17.2.4.2. Products
- 17.2.4.3. SWOT Analysis
- 17.2.4.4. Recent Developments
- 17.2.4.5. Financials (Based on Availability)
- 17.2.5 Thomas Scientific
- 17.2.5.1. Overview
- 17.2.5.2. Products
- 17.2.5.3. SWOT Analysis
- 17.2.5.4. Recent Developments
- 17.2.5.5. Financials (Based on Availability)
- 17.2.6 Precision Charts Inc
- 17.2.6.1. Overview
- 17.2.6.2. Products
- 17.2.6.3. SWOT Analysis
- 17.2.6.4. Recent Developments
- 17.2.6.5. Financials (Based on Availability)
- 17.2.7 Pirrone srl
- 17.2.7.1. Overview
- 17.2.7.2. Products
- 17.2.7.3. SWOT Analysis
- 17.2.7.4. Recent Developments
- 17.2.7.5. Financials (Based on Availability)
- 17.2.8 Cardinal Health
- 17.2.8.1. Overview
- 17.2.8.2. Products
- 17.2.8.3. SWOT Analysis
- 17.2.8.4. Recent Developments
- 17.2.8.5. Financials (Based on Availability)
- 17.2.9 GlobalSpec
- 17.2.9.1. Overview
- 17.2.9.2. Products
- 17.2.9.3. SWOT Analysis
- 17.2.9.4. Recent Developments
- 17.2.9.5. Financials (Based on Availability)
- 17.2.10 DART TECHNOLOGIES
- 17.2.10.1. Overview
- 17.2.10.2. Products
- 17.2.10.3. SWOT Analysis
- 17.2.10.4. Recent Developments
- 17.2.10.5. Financials (Based on Availability)
- 17.2.1 Tele-Paper Malaysia
List of Figures
- Figure 1: Global Recording Chart Paper Market Revenue Breakdown (Million, %) by Region 2024 & 2032
- Figure 2: Global Recording Chart Paper Market Volume Breakdown (Units, %) by Region 2024 & 2032
- Figure 3: North America Recording Chart Paper Market Revenue (Million), by Country 2024 & 2032
- Figure 4: North America Recording Chart Paper Market Volume (Units), by Country 2024 & 2032
- Figure 5: North America Recording Chart Paper Market Revenue Share (%), by Country 2024 & 2032
- Figure 6: North America Recording Chart Paper Market Volume Share (%), by Country 2024 & 2032
- Figure 7: Europe Recording Chart Paper Market Revenue (Million), by Country 2024 & 2032
- Figure 8: Europe Recording Chart Paper Market Volume (Units), by Country 2024 & 2032
- Figure 9: Europe Recording Chart Paper Market Revenue Share (%), by Country 2024 & 2032
- Figure 10: Europe Recording Chart Paper Market Volume Share (%), by Country 2024 & 2032
- Figure 11: Asia Pacific Recording Chart Paper Market Revenue (Million), by Country 2024 & 2032
- Figure 12: Asia Pacific Recording Chart Paper Market Volume (Units), by Country 2024 & 2032
- Figure 13: Asia Pacific Recording Chart Paper Market Revenue Share (%), by Country 2024 & 2032
- Figure 14: Asia Pacific Recording Chart Paper Market Volume Share (%), by Country 2024 & 2032
- Figure 15: South America Recording Chart Paper Market Revenue (Million), by Country 2024 & 2032
- Figure 16: South America Recording Chart Paper Market Volume (Units), by Country 2024 & 2032
- Figure 17: South America Recording Chart Paper Market Revenue Share (%), by Country 2024 & 2032
- Figure 18: South America Recording Chart Paper Market Volume Share (%), by Country 2024 & 2032
- Figure 19: MEA Recording Chart Paper Market Revenue (Million), by Country 2024 & 2032
- Figure 20: MEA Recording Chart Paper Market Volume (Units), by Country 2024 & 2032
- Figure 21: MEA Recording Chart Paper Market Revenue Share (%), by Country 2024 & 2032
- Figure 22: MEA Recording Chart Paper Market Volume Share (%), by Country 2024 & 2032
- Figure 23: North America Recording Chart Paper Market Revenue (Million), by Product Type 2024 & 2032
- Figure 24: North America Recording Chart Paper Market Volume (Units), by Product Type 2024 & 2032
- Figure 25: North America Recording Chart Paper Market Revenue Share (%), by Product Type 2024 & 2032
- Figure 26: North America Recording Chart Paper Market Volume Share (%), by Product Type 2024 & 2032
- Figure 27: North America Recording Chart Paper Market Revenue (Million), by End User 2024 & 2032
- Figure 28: North America Recording Chart Paper Market Volume (Units), by End User 2024 & 2032
- Figure 29: North America Recording Chart Paper Market Revenue Share (%), by End User 2024 & 2032
- Figure 30: North America Recording Chart Paper Market Volume Share (%), by End User 2024 & 2032
- Figure 31: North America Recording Chart Paper Market Revenue (Million), by Country 2024 & 2032
- Figure 32: North America Recording Chart Paper Market Volume (Units), by Country 2024 & 2032
- Figure 33: North America Recording Chart Paper Market Revenue Share (%), by Country 2024 & 2032
- Figure 34: North America Recording Chart Paper Market Volume Share (%), by Country 2024 & 2032
- Figure 35: Europe Recording Chart Paper Market Revenue (Million), by Product Type 2024 & 2032
- Figure 36: Europe Recording Chart Paper Market Volume (Units), by Product Type 2024 & 2032
- Figure 37: Europe Recording Chart Paper Market Revenue Share (%), by Product Type 2024 & 2032
- Figure 38: Europe Recording Chart Paper Market Volume Share (%), by Product Type 2024 & 2032
- Figure 39: Europe Recording Chart Paper Market Revenue (Million), by End User 2024 & 2032
- Figure 40: Europe Recording Chart Paper Market Volume (Units), by End User 2024 & 2032
- Figure 41: Europe Recording Chart Paper Market Revenue Share (%), by End User 2024 & 2032
- Figure 42: Europe Recording Chart Paper Market Volume Share (%), by End User 2024 & 2032
- Figure 43: Europe Recording Chart Paper Market Revenue (Million), by Country 2024 & 2032
- Figure 44: Europe Recording Chart Paper Market Volume (Units), by Country 2024 & 2032
- Figure 45: Europe Recording Chart Paper Market Revenue Share (%), by Country 2024 & 2032
- Figure 46: Europe Recording Chart Paper Market Volume Share (%), by Country 2024 & 2032
- Figure 47: Asia Pacific Recording Chart Paper Market Revenue (Million), by Product Type 2024 & 2032
- Figure 48: Asia Pacific Recording Chart Paper Market Volume (Units), by Product Type 2024 & 2032
- Figure 49: Asia Pacific Recording Chart Paper Market Revenue Share (%), by Product Type 2024 & 2032
- Figure 50: Asia Pacific Recording Chart Paper Market Volume Share (%), by Product Type 2024 & 2032
- Figure 51: Asia Pacific Recording Chart Paper Market Revenue (Million), by End User 2024 & 2032
- Figure 52: Asia Pacific Recording Chart Paper Market Volume (Units), by End User 2024 & 2032
- Figure 53: Asia Pacific Recording Chart Paper Market Revenue Share (%), by End User 2024 & 2032
- Figure 54: Asia Pacific Recording Chart Paper Market Volume Share (%), by End User 2024 & 2032
- Figure 55: Asia Pacific Recording Chart Paper Market Revenue (Million), by Country 2024 & 2032
- Figure 56: Asia Pacific Recording Chart Paper Market Volume (Units), by Country 2024 & 2032
- Figure 57: Asia Pacific Recording Chart Paper Market Revenue Share (%), by Country 2024 & 2032
- Figure 58: Asia Pacific Recording Chart Paper Market Volume Share (%), by Country 2024 & 2032
- Figure 59: Middle East Recording Chart Paper Market Revenue (Million), by Product Type 2024 & 2032
- Figure 60: Middle East Recording Chart Paper Market Volume (Units), by Product Type 2024 & 2032
- Figure 61: Middle East Recording Chart Paper Market Revenue Share (%), by Product Type 2024 & 2032
- Figure 62: Middle East Recording Chart Paper Market Volume Share (%), by Product Type 2024 & 2032
- Figure 63: Middle East Recording Chart Paper Market Revenue (Million), by End User 2024 & 2032
- Figure 64: Middle East Recording Chart Paper Market Volume (Units), by End User 2024 & 2032
- Figure 65: Middle East Recording Chart Paper Market Revenue Share (%), by End User 2024 & 2032
- Figure 66: Middle East Recording Chart Paper Market Volume Share (%), by End User 2024 & 2032
- Figure 67: Middle East Recording Chart Paper Market Revenue (Million), by Country 2024 & 2032
- Figure 68: Middle East Recording Chart Paper Market Volume (Units), by Country 2024 & 2032
- Figure 69: Middle East Recording Chart Paper Market Revenue Share (%), by Country 2024 & 2032
- Figure 70: Middle East Recording Chart Paper Market Volume Share (%), by Country 2024 & 2032
- Figure 71: GCC Recording Chart Paper Market Revenue (Million), by Product Type 2024 & 2032
- Figure 72: GCC Recording Chart Paper Market Volume (Units), by Product Type 2024 & 2032
- Figure 73: GCC Recording Chart Paper Market Revenue Share (%), by Product Type 2024 & 2032
- Figure 74: GCC Recording Chart Paper Market Volume Share (%), by Product Type 2024 & 2032
- Figure 75: GCC Recording Chart Paper Market Revenue (Million), by End User 2024 & 2032
- Figure 76: GCC Recording Chart Paper Market Volume (Units), by End User 2024 & 2032
- Figure 77: GCC Recording Chart Paper Market Revenue Share (%), by End User 2024 & 2032
- Figure 78: GCC Recording Chart Paper Market Volume Share (%), by End User 2024 & 2032
- Figure 79: GCC Recording Chart Paper Market Revenue (Million), by Country 2024 & 2032
- Figure 80: GCC Recording Chart Paper Market Volume (Units), by Country 2024 & 2032
- Figure 81: GCC Recording Chart Paper Market Revenue Share (%), by Country 2024 & 2032
- Figure 82: GCC Recording Chart Paper Market Volume Share (%), by Country 2024 & 2032
- Figure 83: South America Recording Chart Paper Market Revenue (Million), by Product Type 2024 & 2032
- Figure 84: South America Recording Chart Paper Market Volume (Units), by Product Type 2024 & 2032
- Figure 85: South America Recording Chart Paper Market Revenue Share (%), by Product Type 2024 & 2032
- Figure 86: South America Recording Chart Paper Market Volume Share (%), by Product Type 2024 & 2032
- Figure 87: South America Recording Chart Paper Market Revenue (Million), by End User 2024 & 2032
- Figure 88: South America Recording Chart Paper Market Volume (Units), by End User 2024 & 2032
- Figure 89: South America Recording Chart Paper Market Revenue Share (%), by End User 2024 & 2032
- Figure 90: South America Recording Chart Paper Market Volume Share (%), by End User 2024 & 2032
- Figure 91: South America Recording Chart Paper Market Revenue (Million), by Country 2024 & 2032
- Figure 92: South America Recording Chart Paper Market Volume (Units), by Country 2024 & 2032
- Figure 93: South America Recording Chart Paper Market Revenue Share (%), by Country 2024 & 2032
- Figure 94: South America Recording Chart Paper Market Volume Share (%), by Country 2024 & 2032
List of Tables
- Table 1: Global Recording Chart Paper Market Revenue Million Forecast, by Region 2019 & 2032
- Table 2: Global Recording Chart Paper Market Volume Units Forecast, by Region 2019 & 2032
- Table 3: Global Recording Chart Paper Market Revenue Million Forecast, by Product Type 2019 & 2032
- Table 4: Global Recording Chart Paper Market Volume Units Forecast, by Product Type 2019 & 2032
- Table 5: Global Recording Chart Paper Market Revenue Million Forecast, by End User 2019 & 2032
- Table 6: Global Recording Chart Paper Market Volume Units Forecast, by End User 2019 & 2032
- Table 7: Global Recording Chart Paper Market Revenue Million Forecast, by Region 2019 & 2032
- Table 8: Global Recording Chart Paper Market Volume Units Forecast, by Region 2019 & 2032
- Table 9: Global Recording Chart Paper Market Revenue Million Forecast, by Country 2019 & 2032
- Table 10: Global Recording Chart Paper Market Volume Units Forecast, by Country 2019 & 2032
- Table 11: United States Recording Chart Paper Market Revenue (Million) Forecast, by Application 2019 & 2032
- Table 12: United States Recording Chart Paper Market Volume (Units) Forecast, by Application 2019 & 2032
- Table 13: Canada Recording Chart Paper Market Revenue (Million) Forecast, by Application 2019 & 2032
- Table 14: Canada Recording Chart Paper Market Volume (Units) Forecast, by Application 2019 & 2032
- Table 15: Mexico Recording Chart Paper Market Revenue (Million) Forecast, by Application 2019 & 2032
- Table 16: Mexico Recording Chart Paper Market Volume (Units) Forecast, by Application 2019 & 2032
- Table 17: Global Recording Chart Paper Market Revenue Million Forecast, by Country 2019 & 2032
- Table 18: Global Recording Chart Paper Market Volume Units Forecast, by Country 2019 & 2032
- Table 19: Germany Recording Chart Paper Market Revenue (Million) Forecast, by Application 2019 & 2032
- Table 20: Germany Recording Chart Paper Market Volume (Units) Forecast, by Application 2019 & 2032
- Table 21: United Kingdom Recording Chart Paper Market Revenue (Million) Forecast, by Application 2019 & 2032
- Table 22: United Kingdom Recording Chart Paper Market Volume (Units) Forecast, by Application 2019 & 2032
- Table 23: France Recording Chart Paper Market Revenue (Million) Forecast, by Application 2019 & 2032
- Table 24: France Recording Chart Paper Market Volume (Units) Forecast, by Application 2019 & 2032
- Table 25: Italy Recording Chart Paper Market Revenue (Million) Forecast, by Application 2019 & 2032
- Table 26: Italy Recording Chart Paper Market Volume (Units) Forecast, by Application 2019 & 2032
- Table 27: Spain Recording Chart Paper Market Revenue (Million) Forecast, by Application 2019 & 2032
- Table 28: Spain Recording Chart Paper Market Volume (Units) Forecast, by Application 2019 & 2032
- Table 29: Rest of Europe Recording Chart Paper Market Revenue (Million) Forecast, by Application 2019 & 2032
- Table 30: Rest of Europe Recording Chart Paper Market Volume (Units) Forecast, by Application 2019 & 2032
- Table 31: Global Recording Chart Paper Market Revenue Million Forecast, by Country 2019 & 2032
- Table 32: Global Recording Chart Paper Market Volume Units Forecast, by Country 2019 & 2032
- Table 33: China Recording Chart Paper Market Revenue (Million) Forecast, by Application 2019 & 2032
- Table 34: China Recording Chart Paper Market Volume (Units) Forecast, by Application 2019 & 2032
- Table 35: Japan Recording Chart Paper Market Revenue (Million) Forecast, by Application 2019 & 2032
- Table 36: Japan Recording Chart Paper Market Volume (Units) Forecast, by Application 2019 & 2032
- Table 37: India Recording Chart Paper Market Revenue (Million) Forecast, by Application 2019 & 2032
- Table 38: India Recording Chart Paper Market Volume (Units) Forecast, by Application 2019 & 2032
- Table 39: Australia Recording Chart Paper Market Revenue (Million) Forecast, by Application 2019 & 2032
- Table 40: Australia Recording Chart Paper Market Volume (Units) Forecast, by Application 2019 & 2032
- Table 41: South Korea Recording Chart Paper Market Revenue (Million) Forecast, by Application 2019 & 2032
- Table 42: South Korea Recording Chart Paper Market Volume (Units) Forecast, by Application 2019 & 2032
- Table 43: Rest of Asia Pacific Recording Chart Paper Market Revenue (Million) Forecast, by Application 2019 & 2032
- Table 44: Rest of Asia Pacific Recording Chart Paper Market Volume (Units) Forecast, by Application 2019 & 2032
- Table 45: Global Recording Chart Paper Market Revenue Million Forecast, by Country 2019 & 2032
- Table 46: Global Recording Chart Paper Market Volume Units Forecast, by Country 2019 & 2032
- Table 47: Brazil Recording Chart Paper Market Revenue (Million) Forecast, by Application 2019 & 2032
- Table 48: Brazil Recording Chart Paper Market Volume (Units) Forecast, by Application 2019 & 2032
- Table 49: Argentina Recording Chart Paper Market Revenue (Million) Forecast, by Application 2019 & 2032
- Table 50: Argentina Recording Chart Paper Market Volume (Units) Forecast, by Application 2019 & 2032
- Table 51: Rest of South America Recording Chart Paper Market Revenue (Million) Forecast, by Application 2019 & 2032
- Table 52: Rest of South America Recording Chart Paper Market Volume (Units) Forecast, by Application 2019 & 2032
- Table 53: Global Recording Chart Paper Market Revenue Million Forecast, by Country 2019 & 2032
- Table 54: Global Recording Chart Paper Market Volume Units Forecast, by Country 2019 & 2032
- Table 55: United Arab Emirates Recording Chart Paper Market Revenue (Million) Forecast, by Application 2019 & 2032
- Table 56: United Arab Emirates Recording Chart Paper Market Volume (Units) Forecast, by Application 2019 & 2032
- Table 57: Saudi Arabia Recording Chart Paper Market Revenue (Million) Forecast, by Application 2019 & 2032
- Table 58: Saudi Arabia Recording Chart Paper Market Volume (Units) Forecast, by Application 2019 & 2032
- Table 59: South Africa Recording Chart Paper Market Revenue (Million) Forecast, by Application 2019 & 2032
- Table 60: South Africa Recording Chart Paper Market Volume (Units) Forecast, by Application 2019 & 2032
- Table 61: Rest of Middle East and Africa Recording Chart Paper Market Revenue (Million) Forecast, by Application 2019 & 2032
- Table 62: Rest of Middle East and Africa Recording Chart Paper Market Volume (Units) Forecast, by Application 2019 & 2032
- Table 63: Global Recording Chart Paper Market Revenue Million Forecast, by Product Type 2019 & 2032
- Table 64: Global Recording Chart Paper Market Volume Units Forecast, by Product Type 2019 & 2032
- Table 65: Global Recording Chart Paper Market Revenue Million Forecast, by End User 2019 & 2032
- Table 66: Global Recording Chart Paper Market Volume Units Forecast, by End User 2019 & 2032
- Table 67: Global Recording Chart Paper Market Revenue Million Forecast, by Country 2019 & 2032
- Table 68: Global Recording Chart Paper Market Volume Units Forecast, by Country 2019 & 2032
- Table 69: United States Recording Chart Paper Market Revenue (Million) Forecast, by Application 2019 & 2032
- Table 70: United States Recording Chart Paper Market Volume (Units) Forecast, by Application 2019 & 2032
- Table 71: Canada Recording Chart Paper Market Revenue (Million) Forecast, by Application 2019 & 2032
- Table 72: Canada Recording Chart Paper Market Volume (Units) Forecast, by Application 2019 & 2032
- Table 73: Mexico Recording Chart Paper Market Revenue (Million) Forecast, by Application 2019 & 2032
- Table 74: Mexico Recording Chart Paper Market Volume (Units) Forecast, by Application 2019 & 2032
- Table 75: Global Recording Chart Paper Market Revenue Million Forecast, by Product Type 2019 & 2032
- Table 76: Global Recording Chart Paper Market Volume Units Forecast, by Product Type 2019 & 2032
- Table 77: Global Recording Chart Paper Market Revenue Million Forecast, by End User 2019 & 2032
- Table 78: Global Recording Chart Paper Market Volume Units Forecast, by End User 2019 & 2032
- Table 79: Global Recording Chart Paper Market Revenue Million Forecast, by Country 2019 & 2032
- Table 80: Global Recording Chart Paper Market Volume Units Forecast, by Country 2019 & 2032
- Table 81: Germany Recording Chart Paper Market Revenue (Million) Forecast, by Application 2019 & 2032
- Table 82: Germany Recording Chart Paper Market Volume (Units) Forecast, by Application 2019 & 2032
- Table 83: United Kingdom Recording Chart Paper Market Revenue (Million) Forecast, by Application 2019 & 2032
- Table 84: United Kingdom Recording Chart Paper Market Volume (Units) Forecast, by Application 2019 & 2032
- Table 85: France Recording Chart Paper Market Revenue (Million) Forecast, by Application 2019 & 2032
- Table 86: France Recording Chart Paper Market Volume (Units) Forecast, by Application 2019 & 2032
- Table 87: Italy Recording Chart Paper Market Revenue (Million) Forecast, by Application 2019 & 2032
- Table 88: Italy Recording Chart Paper Market Volume (Units) Forecast, by Application 2019 & 2032
- Table 89: Spain Recording Chart Paper Market Revenue (Million) Forecast, by Application 2019 & 2032
- Table 90: Spain Recording Chart Paper Market Volume (Units) Forecast, by Application 2019 & 2032
- Table 91: Rest of Europe Recording Chart Paper Market Revenue (Million) Forecast, by Application 2019 & 2032
- Table 92: Rest of Europe Recording Chart Paper Market Volume (Units) Forecast, by Application 2019 & 2032
- Table 93: Global Recording Chart Paper Market Revenue Million Forecast, by Product Type 2019 & 2032
- Table 94: Global Recording Chart Paper Market Volume Units Forecast, by Product Type 2019 & 2032
- Table 95: Global Recording Chart Paper Market Revenue Million Forecast, by End User 2019 & 2032
- Table 96: Global Recording Chart Paper Market Volume Units Forecast, by End User 2019 & 2032
- Table 97: Global Recording Chart Paper Market Revenue Million Forecast, by Country 2019 & 2032
- Table 98: Global Recording Chart Paper Market Volume Units Forecast, by Country 2019 & 2032
- Table 99: China Recording Chart Paper Market Revenue (Million) Forecast, by Application 2019 & 2032
- Table 100: China Recording Chart Paper Market Volume (Units) Forecast, by Application 2019 & 2032
- Table 101: Japan Recording Chart Paper Market Revenue (Million) Forecast, by Application 2019 & 2032
- Table 102: Japan Recording Chart Paper Market Volume (Units) Forecast, by Application 2019 & 2032
- Table 103: India Recording Chart Paper Market Revenue (Million) Forecast, by Application 2019 & 2032
- Table 104: India Recording Chart Paper Market Volume (Units) Forecast, by Application 2019 & 2032
- Table 105: Australia Recording Chart Paper Market Revenue (Million) Forecast, by Application 2019 & 2032
- Table 106: Australia Recording Chart Paper Market Volume (Units) Forecast, by Application 2019 & 2032
- Table 107: South Korea Recording Chart Paper Market Revenue (Million) Forecast, by Application 2019 & 2032
- Table 108: South Korea Recording Chart Paper Market Volume (Units) Forecast, by Application 2019 & 2032
- Table 109: Rest of Asia Pacific Recording Chart Paper Market Revenue (Million) Forecast, by Application 2019 & 2032
- Table 110: Rest of Asia Pacific Recording Chart Paper Market Volume (Units) Forecast, by Application 2019 & 2032
- Table 111: Global Recording Chart Paper Market Revenue Million Forecast, by Product Type 2019 & 2032
- Table 112: Global Recording Chart Paper Market Volume Units Forecast, by Product Type 2019 & 2032
- Table 113: Global Recording Chart Paper Market Revenue Million Forecast, by End User 2019 & 2032
- Table 114: Global Recording Chart Paper Market Volume Units Forecast, by End User 2019 & 2032
- Table 115: Global Recording Chart Paper Market Revenue Million Forecast, by Country 2019 & 2032
- Table 116: Global Recording Chart Paper Market Volume Units Forecast, by Country 2019 & 2032
- Table 117: Global Recording Chart Paper Market Revenue Million Forecast, by Product Type 2019 & 2032
- Table 118: Global Recording Chart Paper Market Volume Units Forecast, by Product Type 2019 & 2032
- Table 119: Global Recording Chart Paper Market Revenue Million Forecast, by End User 2019 & 2032
- Table 120: Global Recording Chart Paper Market Volume Units Forecast, by End User 2019 & 2032
- Table 121: Global Recording Chart Paper Market Revenue Million Forecast, by Country 2019 & 2032
- Table 122: Global Recording Chart Paper Market Volume Units Forecast, by Country 2019 & 2032
- Table 123: South Africa Recording Chart Paper Market Revenue (Million) Forecast, by Application 2019 & 2032
- Table 124: South Africa Recording Chart Paper Market Volume (Units) Forecast, by Application 2019 & 2032
- Table 125: Rest of Middle East Recording Chart Paper Market Revenue (Million) Forecast, by Application 2019 & 2032
- Table 126: Rest of Middle East Recording Chart Paper Market Volume (Units) Forecast, by Application 2019 & 2032
- Table 127: Global Recording Chart Paper Market Revenue Million Forecast, by Product Type 2019 & 2032
- Table 128: Global Recording Chart Paper Market Volume Units Forecast, by Product Type 2019 & 2032
- Table 129: Global Recording Chart Paper Market Revenue Million Forecast, by End User 2019 & 2032
- Table 130: Global Recording Chart Paper Market Volume Units Forecast, by End User 2019 & 2032
- Table 131: Global Recording Chart Paper Market Revenue Million Forecast, by Country 2019 & 2032
- Table 132: Global Recording Chart Paper Market Volume Units Forecast, by Country 2019 & 2032
- Table 133: Brazil Recording Chart Paper Market Revenue (Million) Forecast, by Application 2019 & 2032
- Table 134: Brazil Recording Chart Paper Market Volume (Units) Forecast, by Application 2019 & 2032
- Table 135: Argentina Recording Chart Paper Market Revenue (Million) Forecast, by Application 2019 & 2032
- Table 136: Argentina Recording Chart Paper Market Volume (Units) Forecast, by Application 2019 & 2032
- Table 137: Rest of South America Recording Chart Paper Market Revenue (Million) Forecast, by Application 2019 & 2032
- Table 138: Rest of South America Recording Chart Paper Market Volume (Units) Forecast, by Application 2019 & 2032
Frequently Asked Questions
1. What is the projected Compound Annual Growth Rate (CAGR) of the Recording Chart Paper Market?
The projected CAGR is approximately 4.30%.
2. Which companies are prominent players in the Recording Chart Paper Market?
Key companies in the market include Tele-Paper Malaysia, Recorders Charts & Pens, Kokusai Chart Co, Merck KGaA, Thomas Scientific, Precision Charts Inc, Pirrone srl, Cardinal Health, GlobalSpec, DART TECHNOLOGIES.
3. What are the main segments of the Recording Chart Paper Market?
The market segments include Product Type, End User.
4. Can you provide details about the market size?
The market size is estimated to be USD XX Million as of 2022.
5. What are some drivers contributing to market growth?
; Increasing Prevalence of Cardiovascular Diseases; Increasing Geriatric Population and Births.
6. What are the notable trends driving market growth?
Fetal Monitoring Recording Chart Papers Segment is Expected to be the Fastest Growing Segment..
7. Are there any restraints impacting market growth?
; Growing Usage of Alternative Digital Instruments.
8. Can you provide examples of recent developments in the market?
N/A
9. What pricing options are available for accessing the report?
Pricing options include single-user, multi-user, and enterprise licenses priced at USD 4750, USD 5250, and USD 8750 respectively.
10. Is the market size provided in terms of value or volume?
The market size is provided in terms of value, measured in Million and volume, measured in Units.
11. Are there any specific market keywords associated with the report?
Yes, the market keyword associated with the report is "Recording Chart Paper Market," which aids in identifying and referencing the specific market segment covered.
12. How do I determine which pricing option suits my needs best?
The pricing options vary based on user requirements and access needs. Individual users may opt for single-user licenses, while businesses requiring broader access may choose multi-user or enterprise licenses for cost-effective access to the report.
13. Are there any additional resources or data provided in the Recording Chart Paper Market report?
While the report offers comprehensive insights, it's advisable to review the specific contents or supplementary materials provided to ascertain if additional resources or data are available.
14. How can I stay updated on further developments or reports in the Recording Chart Paper Market?
To stay informed about further developments, trends, and reports in the Recording Chart Paper Market, consider subscribing to industry newsletters, following relevant companies and organizations, or regularly checking reputable industry news sources and publications.
Methodology
Step 1 - Identification of Relevant Samples Size from Population Database


Step 2 - Approaches for Defining Global Market Size (Value, Volume* & Price*)

Note*: In applicable scenarios
Step 3 - Data Sources
Primary Research
- Web Analytics
- Survey Reports
- Research Institute
- Latest Research Reports
- Opinion Leaders
Secondary Research
- Annual Reports
- White Paper
- Latest Press Release
- Industry Association
- Paid Database
- Investor Presentations

Step 4 - Data Triangulation
Involves using different sources of information in order to increase the validity of a study
These sources are likely to be stakeholders in a program - participants, other researchers, program staff, other community members, and so on.
Then we put all data in single framework & apply various statistical tools to find out the dynamic on the market.
During the analysis stage, feedback from the stakeholder groups would be compared to determine areas of agreement as well as areas of divergence


