
Key Insights
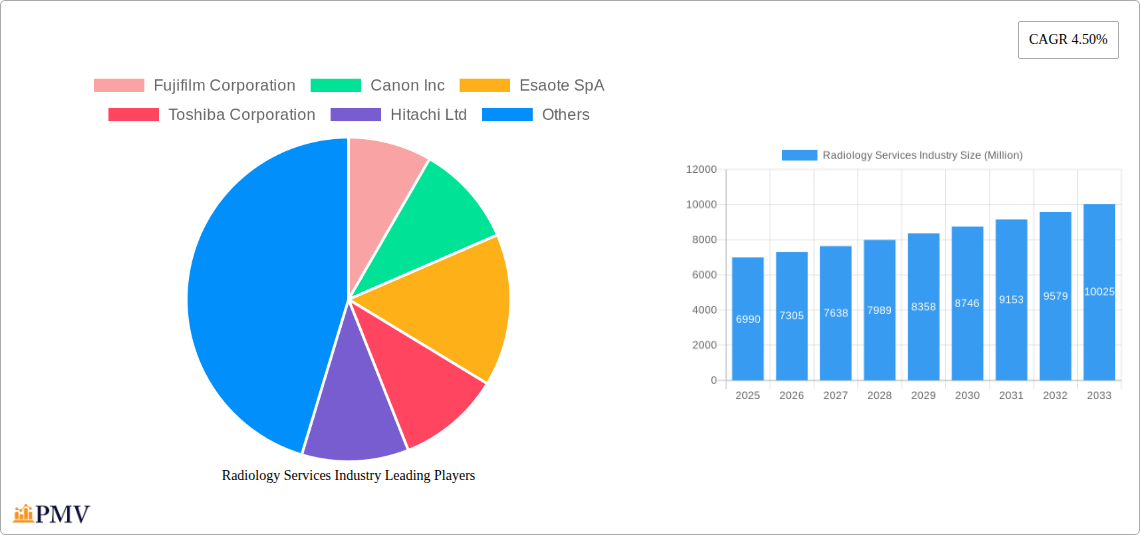
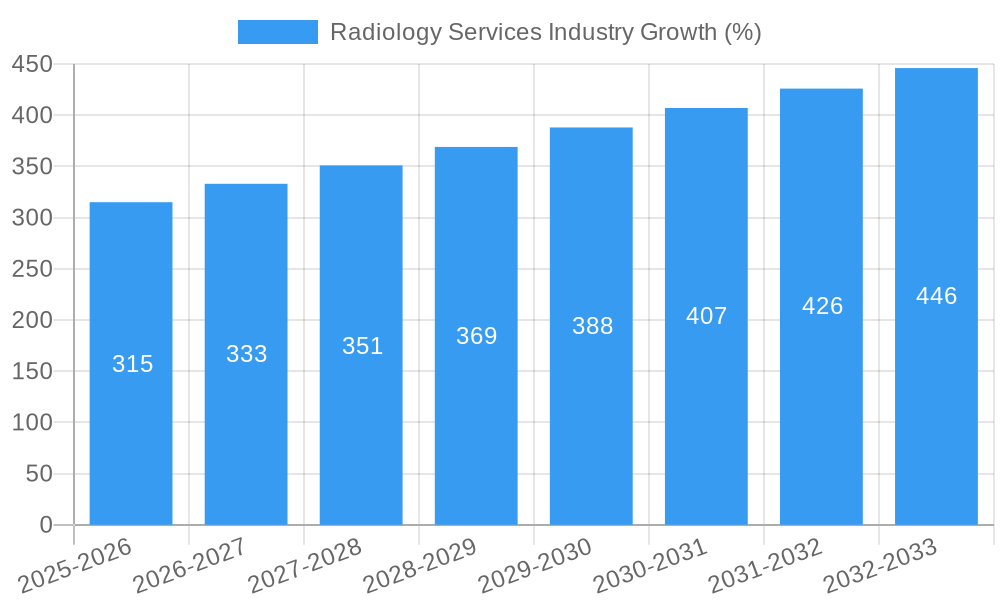
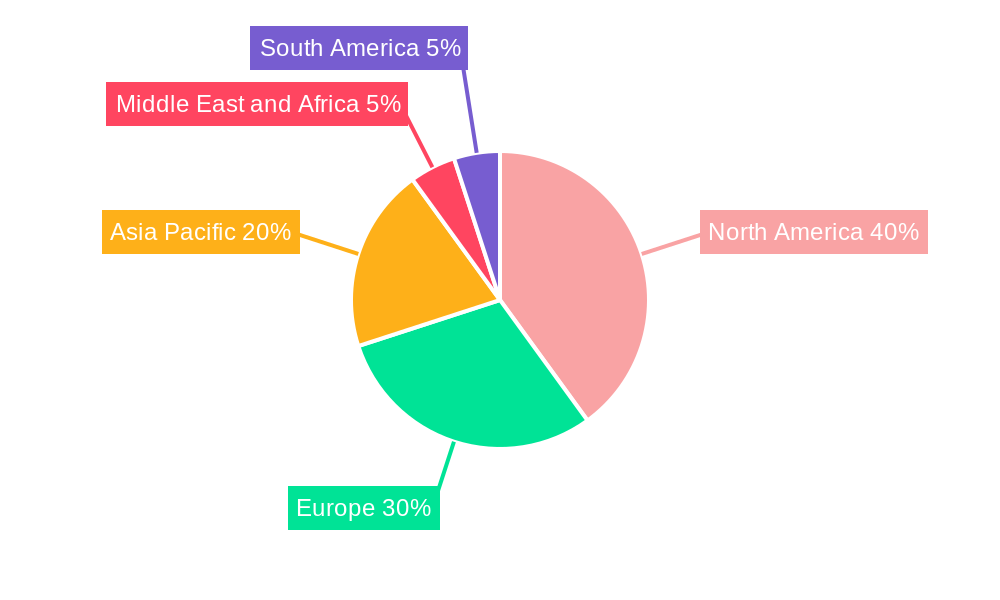
The global radiology services market, valued at $6.99 billion in 2025, is projected to experience robust growth, driven by a Compound Annual Growth Rate (CAGR) of 4.50% from 2025 to 2033. This expansion is fueled by several key factors. Technological advancements in medical imaging, such as the development of AI-powered diagnostic tools and portable imaging devices, are significantly improving diagnostic accuracy and efficiency. The aging global population, coupled with rising prevalence of chronic diseases like cancer and cardiovascular conditions requiring frequent radiological examinations, is also bolstering market demand. Furthermore, increasing healthcare expenditure and improving healthcare infrastructure in emerging economies are contributing to market growth. The market is segmented by product type (Ultrasound, MRI, X-Ray, Computed Tomography Scanner, Other), modality (Standalone, Table-top, Portable), and end-user (Pediatric Clinics, Diagnostic Centers, Hospitals, Other). While the North American market currently holds a significant share, Asia-Pacific is anticipated to witness substantial growth due to rapid economic development and rising healthcare awareness. However, high costs associated with advanced imaging technologies and stringent regulatory approvals pose challenges to market expansion.
Competitive dynamics are shaped by the presence of established players like Fujifilm, Canon, Esaote, Toshiba, Hitachi, Philips, Samsung Medison, Analogic, Siemens, and General Electric. These companies are focusing on strategic collaborations, product innovation, and geographical expansion to maintain their market position. The future trajectory of the radiology services market is promising, with continued advancements in technology and increasing demand for precise and timely diagnostics expected to drive further growth. The market's segmentation offers opportunities for specialized service providers and niche technology developers to capitalize on specific needs within the healthcare sector. The ongoing integration of artificial intelligence and machine learning into radiology workflows promises to further enhance efficiency and accuracy, ultimately impacting patient outcomes and market expansion.
Radiology Services Industry Market Report: 2019-2033
This comprehensive report provides a detailed analysis of the Radiology Services Industry, offering invaluable insights for stakeholders seeking to understand market dynamics, competitive landscapes, and future growth opportunities. The report covers the period from 2019 to 2033, with a base year of 2025 and a forecast period from 2025 to 2033. The global market size is projected to reach xx Million by 2033, exhibiting a CAGR of xx% during the forecast period.
Radiology Services Industry Market Structure & Competitive Dynamics
The global radiology services market is characterized by a moderately concentrated structure, with key players holding significant market share. The top ten companies—Fujifilm Corporation, Canon Inc, Esaote SpA, Toshiba Corporation, Hitachi Ltd, Koninklijke Philips N V, Samsung Medison Co Ltd, Analogic Corporation, Siemens AG, and General Electric Company—collectively account for approximately xx% of the global market in 2025. Market share is influenced by factors such as technological innovation, brand reputation, distribution networks, and strategic partnerships. The industry's innovation ecosystem is highly dynamic, driven by continuous advancements in imaging technology, software development, and data analytics. Regulatory frameworks, varying across different geographies, significantly impact market access and product approvals. The market witnesses considerable M&A activity, with deal values exceeding xx Million in the historical period (2019-2024). Substitutes, such as alternative diagnostic techniques, pose a competitive threat, while evolving end-user preferences towards minimally invasive procedures and personalized medicine influence market trends.
- Market Concentration: High, with top 10 players controlling xx% of the market (2025).
- M&A Activity: Deal values exceeded xx Million (2019-2024).
- Regulatory Landscape: Varies significantly across geographies, impacting market access.
- Innovation Ecosystem: Highly dynamic, driven by advancements in imaging technology and AI.
Radiology Services Industry Industry Trends & Insights
The radiology services market is experiencing robust growth, fueled by several key factors. Technological advancements, such as the integration of artificial intelligence (AI) and machine learning (ML) in image analysis, are significantly enhancing diagnostic accuracy and efficiency. The rising prevalence of chronic diseases, an aging global population, and increasing healthcare expenditure are contributing to higher demand for radiology services. Consumer preferences are shifting towards faster, more convenient, and less invasive diagnostic procedures. Competitive dynamics are intense, with companies investing heavily in R&D, strategic partnerships, and market expansion strategies. The market is witnessing increased adoption of advanced imaging modalities like MRI and CT scans, driving market growth. Market penetration of advanced imaging technologies continues to rise, with a projected xx% increase by 2033. The overall market is expected to grow at a CAGR of xx% from 2025 to 2033.
Dominant Markets & Segments in Radiology Services Industry
The North American region holds the largest market share, driven by factors such as high healthcare expenditure, technological advancements, and a strong regulatory framework. Within the product type segment, Computed Tomography (CT) scanners dominate due to their widespread application in various medical specialties. Hospitals remain the largest end-user segment, accounting for the majority of radiology service demand. However, the diagnostic centers segment is projected to exhibit faster growth due to the increasing preference for specialized imaging services outside of traditional hospital settings.
- Key Drivers for North American Dominance: High healthcare expenditure, advanced technology adoption, robust regulatory framework.
- Product Type: CT Scanners hold the largest market share.
- End-User: Hospitals dominate, with Diagnostic Centers showing faster growth.
- Modality: Standalone devices hold the largest market share.
The growth in each segment is influenced by various factors, such as economic policies, healthcare infrastructure, and technological advancements. For instance, government initiatives promoting preventive healthcare and investments in healthcare infrastructure boost demand in emerging economies.
Radiology Services Industry Product Innovations
Recent innovations focus on improving image quality, reducing radiation exposure, and enhancing workflow efficiency. The integration of AI and ML is revolutionizing image analysis, leading to faster and more accurate diagnoses. Portable and table-top devices are gaining traction due to their ease of use and mobility, expanding access to radiology services in remote areas and improving patient care. These advancements cater to the growing need for efficient and precise diagnostics, leading to better patient outcomes.
Report Segmentation & Scope
This report segments the radiology services market based on Product Type (Ultrasound, MRI, X-Ray, Computed Tomography Scanner, Other Product Types), Modality (Standalone Devices, Table-top Devices, Portable Devices), and End-User (Pediatric Clinics, Diagnostic Centers, Hospitals, Other End-Users). Each segment's growth trajectory is analyzed, considering factors such as market size, competitive landscape, and technological advancements. Specific growth projections and market size estimations are provided for each segment for the forecast period (2025-2033).
Key Drivers of Radiology Services Industry Growth
Several factors drive market growth: technological advancements (AI, ML integration), increasing prevalence of chronic diseases, aging population, rising healthcare spending, and favorable government regulations promoting preventive healthcare. These factors collectively contribute to an expanding demand for advanced and efficient radiology services.
Challenges in the Radiology Services Industry Sector
The industry faces challenges such as stringent regulatory approvals, high equipment costs, cybersecurity concerns for medical image data, and skilled radiologist shortages. These factors can impede market growth and require strategic planning and investment by industry players. Supply chain disruptions also pose a risk to equipment availability and timely service delivery.
Leading Players in the Radiology Services Industry Market
- Fujifilm Corporation
- Canon Inc
- Esaote SpA
- Toshiba Corporation
- Hitachi Ltd
- Koninklijke Philips N V
- Samsung Medison Co Ltd
- Analogic Corporation
- Siemens AG
- General Electric Company
Key Developments in Radiology Services Industry Sector
- August 2022: Children's Hospital New Orleans and Cleveland Clinic announced a new affiliation, expanding access to pediatric radiology expertise. This development highlights the growing need for specialized radiology services and potential for strategic partnerships.
- February 2022: The LEGO Foundation donated 600 LEGO MRI scanners to hospitals worldwide, aiming to alleviate children's anxiety during MRI scans. This initiative underscores the industry's focus on patient experience and innovative approaches to improve healthcare accessibility.
Strategic Radiology Services Industry Market Outlook
The radiology services market exhibits strong future potential, driven by technological innovation, expanding healthcare infrastructure, and increasing demand for advanced diagnostic imaging. Strategic opportunities lie in developing AI-powered diagnostic tools, expanding into emerging markets, and forging strategic alliances to enhance market reach and service offerings. Companies focusing on innovation, patient-centric solutions, and efficient operational models are poised for significant growth in the coming years.
Radiology Services Industry Segmentation
-
1. Product Type
- 1.1. Ultrasound
- 1.2. MRI
- 1.3. X-ray
- 1.4. Computed Tomography Scanner
- 1.5. Other Product Types
-
2. Modality
- 2.1. Standalone Devices
- 2.2. Table-top Devices
- 2.3. Portable Devices
-
3. End User
- 3.1. Pediatric Clinics
- 3.2. Diagnostic Centers
- 3.3. Hospitals
- 3.4. Other End Users
Radiology Services Industry Segmentation By Geography
-
1. North America
- 1.1. United States
- 1.2. Canada
- 1.3. Mexico
-
2. Europe
- 2.1. Germany
- 2.2. United Kingdom
- 2.3. France
- 2.4. Italy
- 2.5. Spain
- 2.6. Rest of Europe
-
3. Asia Pacific
- 3.1. China
- 3.2. Japan
- 3.3. India
- 3.4. Australia
- 3.5. South Korea
- 3.6. Rest of Asia Pacific
-
4. Middle East and Africa
- 4.1. GCC
- 4.2. South Africa
- 4.3. Rest of Middle East and Africa
-
5. South America
- 5.1. Brazil
- 5.2. Argentina
- 5.3. Rest of South America
Radiology Services Industry REPORT HIGHLIGHTS
| Aspects | Details |
|---|---|
| Study Period | 2019-2033 |
| Base Year | 2024 |
| Estimated Year | 2025 |
| Forecast Period | 2025-2033 |
| Historical Period | 2019-2024 |
| Growth Rate | CAGR of 4.50% from 2019-2033 |
| Segmentation |
|
Table of Contents
- 1. Introduction
- 1.1. Research Scope
- 1.2. Market Segmentation
- 1.3. Research Methodology
- 1.4. Definitions and Assumptions
- 2. Executive Summary
- 2.1. Introduction
- 3. Market Dynamics
- 3.1. Introduction
- 3.2. Market Drivers
- 3.2.1 Increasing Burden of Pediatric Diseases
- 3.2.2 such as Coronary Heart Failures
- 3.2.3 Pneumonia
- 3.2.4 and Rise in Affordability; Increased Government Initiatives and R&D Activities to Develop Advanced Pediatric Radiology Devices
- 3.3. Market Restrains
- 3.3.1. Ethical Issues in Pediatric Research; Lack of Skilled Healthcare Professionals
- 3.4. Market Trends
- 3.4.1. Magnetic Resonance Imaging (MRI) Segment is Expected to Hold the Major Market Share in the Pediatric Radiology Market
- 4. Market Factor Analysis
- 4.1. Porters Five Forces
- 4.2. Supply/Value Chain
- 4.3. PESTEL analysis
- 4.4. Market Entropy
- 4.5. Patent/Trademark Analysis
- 5. Global Radiology Services Industry Analysis, Insights and Forecast, 2019-2031
- 5.1. Market Analysis, Insights and Forecast - by Product Type
- 5.1.1. Ultrasound
- 5.1.2. MRI
- 5.1.3. X-ray
- 5.1.4. Computed Tomography Scanner
- 5.1.5. Other Product Types
- 5.2. Market Analysis, Insights and Forecast - by Modality
- 5.2.1. Standalone Devices
- 5.2.2. Table-top Devices
- 5.2.3. Portable Devices
- 5.3. Market Analysis, Insights and Forecast - by End User
- 5.3.1. Pediatric Clinics
- 5.3.2. Diagnostic Centers
- 5.3.3. Hospitals
- 5.3.4. Other End Users
- 5.4. Market Analysis, Insights and Forecast - by Region
- 5.4.1. North America
- 5.4.2. Europe
- 5.4.3. Asia Pacific
- 5.4.4. Middle East and Africa
- 5.4.5. South America
- 5.1. Market Analysis, Insights and Forecast - by Product Type
- 6. North America Radiology Services Industry Analysis, Insights and Forecast, 2019-2031
- 6.1. Market Analysis, Insights and Forecast - by Product Type
- 6.1.1. Ultrasound
- 6.1.2. MRI
- 6.1.3. X-ray
- 6.1.4. Computed Tomography Scanner
- 6.1.5. Other Product Types
- 6.2. Market Analysis, Insights and Forecast - by Modality
- 6.2.1. Standalone Devices
- 6.2.2. Table-top Devices
- 6.2.3. Portable Devices
- 6.3. Market Analysis, Insights and Forecast - by End User
- 6.3.1. Pediatric Clinics
- 6.3.2. Diagnostic Centers
- 6.3.3. Hospitals
- 6.3.4. Other End Users
- 6.1. Market Analysis, Insights and Forecast - by Product Type
- 7. Europe Radiology Services Industry Analysis, Insights and Forecast, 2019-2031
- 7.1. Market Analysis, Insights and Forecast - by Product Type
- 7.1.1. Ultrasound
- 7.1.2. MRI
- 7.1.3. X-ray
- 7.1.4. Computed Tomography Scanner
- 7.1.5. Other Product Types
- 7.2. Market Analysis, Insights and Forecast - by Modality
- 7.2.1. Standalone Devices
- 7.2.2. Table-top Devices
- 7.2.3. Portable Devices
- 7.3. Market Analysis, Insights and Forecast - by End User
- 7.3.1. Pediatric Clinics
- 7.3.2. Diagnostic Centers
- 7.3.3. Hospitals
- 7.3.4. Other End Users
- 7.1. Market Analysis, Insights and Forecast - by Product Type
- 8. Asia Pacific Radiology Services Industry Analysis, Insights and Forecast, 2019-2031
- 8.1. Market Analysis, Insights and Forecast - by Product Type
- 8.1.1. Ultrasound
- 8.1.2. MRI
- 8.1.3. X-ray
- 8.1.4. Computed Tomography Scanner
- 8.1.5. Other Product Types
- 8.2. Market Analysis, Insights and Forecast - by Modality
- 8.2.1. Standalone Devices
- 8.2.2. Table-top Devices
- 8.2.3. Portable Devices
- 8.3. Market Analysis, Insights and Forecast - by End User
- 8.3.1. Pediatric Clinics
- 8.3.2. Diagnostic Centers
- 8.3.3. Hospitals
- 8.3.4. Other End Users
- 8.1. Market Analysis, Insights and Forecast - by Product Type
- 9. Middle East and Africa Radiology Services Industry Analysis, Insights and Forecast, 2019-2031
- 9.1. Market Analysis, Insights and Forecast - by Product Type
- 9.1.1. Ultrasound
- 9.1.2. MRI
- 9.1.3. X-ray
- 9.1.4. Computed Tomography Scanner
- 9.1.5. Other Product Types
- 9.2. Market Analysis, Insights and Forecast - by Modality
- 9.2.1. Standalone Devices
- 9.2.2. Table-top Devices
- 9.2.3. Portable Devices
- 9.3. Market Analysis, Insights and Forecast - by End User
- 9.3.1. Pediatric Clinics
- 9.3.2. Diagnostic Centers
- 9.3.3. Hospitals
- 9.3.4. Other End Users
- 9.1. Market Analysis, Insights and Forecast - by Product Type
- 10. South America Radiology Services Industry Analysis, Insights and Forecast, 2019-2031
- 10.1. Market Analysis, Insights and Forecast - by Product Type
- 10.1.1. Ultrasound
- 10.1.2. MRI
- 10.1.3. X-ray
- 10.1.4. Computed Tomography Scanner
- 10.1.5. Other Product Types
- 10.2. Market Analysis, Insights and Forecast - by Modality
- 10.2.1. Standalone Devices
- 10.2.2. Table-top Devices
- 10.2.3. Portable Devices
- 10.3. Market Analysis, Insights and Forecast - by End User
- 10.3.1. Pediatric Clinics
- 10.3.2. Diagnostic Centers
- 10.3.3. Hospitals
- 10.3.4. Other End Users
- 10.1. Market Analysis, Insights and Forecast - by Product Type
- 11. North America Radiology Services Industry Analysis, Insights and Forecast, 2019-2031
- 11.1. Market Analysis, Insights and Forecast - By Country/Sub-region
- 11.1.1 United States
- 11.1.2 Canada
- 11.1.3 Mexico
- 12. Europe Radiology Services Industry Analysis, Insights and Forecast, 2019-2031
- 12.1. Market Analysis, Insights and Forecast - By Country/Sub-region
- 12.1.1 Germany
- 12.1.2 United Kingdom
- 12.1.3 France
- 12.1.4 Italy
- 12.1.5 Spain
- 12.1.6 Rest of Europe
- 13. Asia Pacific Radiology Services Industry Analysis, Insights and Forecast, 2019-2031
- 13.1. Market Analysis, Insights and Forecast - By Country/Sub-region
- 13.1.1 China
- 13.1.2 Japan
- 13.1.3 India
- 13.1.4 Australia
- 13.1.5 South Korea
- 13.1.6 Rest of Asia Pacific
- 14. Middle East and Africa Radiology Services Industry Analysis, Insights and Forecast, 2019-2031
- 14.1. Market Analysis, Insights and Forecast - By Country/Sub-region
- 14.1.1 GCC
- 14.1.2 South Africa
- 14.1.3 Rest of Middle East and Africa
- 15. South America Radiology Services Industry Analysis, Insights and Forecast, 2019-2031
- 15.1. Market Analysis, Insights and Forecast - By Country/Sub-region
- 15.1.1 Brazil
- 15.1.2 Argentina
- 15.1.3 Rest of South America
- 16. Competitive Analysis
- 16.1. Global Market Share Analysis 2024
- 16.2. Company Profiles
- 16.2.1 Fujifilm Corporation
- 16.2.1.1. Overview
- 16.2.1.2. Products
- 16.2.1.3. SWOT Analysis
- 16.2.1.4. Recent Developments
- 16.2.1.5. Financials (Based on Availability)
- 16.2.2 Canon Inc
- 16.2.2.1. Overview
- 16.2.2.2. Products
- 16.2.2.3. SWOT Analysis
- 16.2.2.4. Recent Developments
- 16.2.2.5. Financials (Based on Availability)
- 16.2.3 Esaote SpA
- 16.2.3.1. Overview
- 16.2.3.2. Products
- 16.2.3.3. SWOT Analysis
- 16.2.3.4. Recent Developments
- 16.2.3.5. Financials (Based on Availability)
- 16.2.4 Toshiba Corporation
- 16.2.4.1. Overview
- 16.2.4.2. Products
- 16.2.4.3. SWOT Analysis
- 16.2.4.4. Recent Developments
- 16.2.4.5. Financials (Based on Availability)
- 16.2.5 Hitachi Ltd
- 16.2.5.1. Overview
- 16.2.5.2. Products
- 16.2.5.3. SWOT Analysis
- 16.2.5.4. Recent Developments
- 16.2.5.5. Financials (Based on Availability)
- 16.2.6 Koninklijke Philips N V
- 16.2.6.1. Overview
- 16.2.6.2. Products
- 16.2.6.3. SWOT Analysis
- 16.2.6.4. Recent Developments
- 16.2.6.5. Financials (Based on Availability)
- 16.2.7 Samsung Medison Co Ltd
- 16.2.7.1. Overview
- 16.2.7.2. Products
- 16.2.7.3. SWOT Analysis
- 16.2.7.4. Recent Developments
- 16.2.7.5. Financials (Based on Availability)
- 16.2.8 Analogic Corporation
- 16.2.8.1. Overview
- 16.2.8.2. Products
- 16.2.8.3. SWOT Analysis
- 16.2.8.4. Recent Developments
- 16.2.8.5. Financials (Based on Availability)
- 16.2.9 Siemens AG
- 16.2.9.1. Overview
- 16.2.9.2. Products
- 16.2.9.3. SWOT Analysis
- 16.2.9.4. Recent Developments
- 16.2.9.5. Financials (Based on Availability)
- 16.2.10 General Electric Company
- 16.2.10.1. Overview
- 16.2.10.2. Products
- 16.2.10.3. SWOT Analysis
- 16.2.10.4. Recent Developments
- 16.2.10.5. Financials (Based on Availability)
- 16.2.1 Fujifilm Corporation
List of Figures
- Figure 1: Global Radiology Services Industry Revenue Breakdown (Million, %) by Region 2024 & 2032
- Figure 2: North America Radiology Services Industry Revenue (Million), by Country 2024 & 2032
- Figure 3: North America Radiology Services Industry Revenue Share (%), by Country 2024 & 2032
- Figure 4: Europe Radiology Services Industry Revenue (Million), by Country 2024 & 2032
- Figure 5: Europe Radiology Services Industry Revenue Share (%), by Country 2024 & 2032
- Figure 6: Asia Pacific Radiology Services Industry Revenue (Million), by Country 2024 & 2032
- Figure 7: Asia Pacific Radiology Services Industry Revenue Share (%), by Country 2024 & 2032
- Figure 8: Middle East and Africa Radiology Services Industry Revenue (Million), by Country 2024 & 2032
- Figure 9: Middle East and Africa Radiology Services Industry Revenue Share (%), by Country 2024 & 2032
- Figure 10: South America Radiology Services Industry Revenue (Million), by Country 2024 & 2032
- Figure 11: South America Radiology Services Industry Revenue Share (%), by Country 2024 & 2032
- Figure 12: North America Radiology Services Industry Revenue (Million), by Product Type 2024 & 2032
- Figure 13: North America Radiology Services Industry Revenue Share (%), by Product Type 2024 & 2032
- Figure 14: North America Radiology Services Industry Revenue (Million), by Modality 2024 & 2032
- Figure 15: North America Radiology Services Industry Revenue Share (%), by Modality 2024 & 2032
- Figure 16: North America Radiology Services Industry Revenue (Million), by End User 2024 & 2032
- Figure 17: North America Radiology Services Industry Revenue Share (%), by End User 2024 & 2032
- Figure 18: North America Radiology Services Industry Revenue (Million), by Country 2024 & 2032
- Figure 19: North America Radiology Services Industry Revenue Share (%), by Country 2024 & 2032
- Figure 20: Europe Radiology Services Industry Revenue (Million), by Product Type 2024 & 2032
- Figure 21: Europe Radiology Services Industry Revenue Share (%), by Product Type 2024 & 2032
- Figure 22: Europe Radiology Services Industry Revenue (Million), by Modality 2024 & 2032
- Figure 23: Europe Radiology Services Industry Revenue Share (%), by Modality 2024 & 2032
- Figure 24: Europe Radiology Services Industry Revenue (Million), by End User 2024 & 2032
- Figure 25: Europe Radiology Services Industry Revenue Share (%), by End User 2024 & 2032
- Figure 26: Europe Radiology Services Industry Revenue (Million), by Country 2024 & 2032
- Figure 27: Europe Radiology Services Industry Revenue Share (%), by Country 2024 & 2032
- Figure 28: Asia Pacific Radiology Services Industry Revenue (Million), by Product Type 2024 & 2032
- Figure 29: Asia Pacific Radiology Services Industry Revenue Share (%), by Product Type 2024 & 2032
- Figure 30: Asia Pacific Radiology Services Industry Revenue (Million), by Modality 2024 & 2032
- Figure 31: Asia Pacific Radiology Services Industry Revenue Share (%), by Modality 2024 & 2032
- Figure 32: Asia Pacific Radiology Services Industry Revenue (Million), by End User 2024 & 2032
- Figure 33: Asia Pacific Radiology Services Industry Revenue Share (%), by End User 2024 & 2032
- Figure 34: Asia Pacific Radiology Services Industry Revenue (Million), by Country 2024 & 2032
- Figure 35: Asia Pacific Radiology Services Industry Revenue Share (%), by Country 2024 & 2032
- Figure 36: Middle East and Africa Radiology Services Industry Revenue (Million), by Product Type 2024 & 2032
- Figure 37: Middle East and Africa Radiology Services Industry Revenue Share (%), by Product Type 2024 & 2032
- Figure 38: Middle East and Africa Radiology Services Industry Revenue (Million), by Modality 2024 & 2032
- Figure 39: Middle East and Africa Radiology Services Industry Revenue Share (%), by Modality 2024 & 2032
- Figure 40: Middle East and Africa Radiology Services Industry Revenue (Million), by End User 2024 & 2032
- Figure 41: Middle East and Africa Radiology Services Industry Revenue Share (%), by End User 2024 & 2032
- Figure 42: Middle East and Africa Radiology Services Industry Revenue (Million), by Country 2024 & 2032
- Figure 43: Middle East and Africa Radiology Services Industry Revenue Share (%), by Country 2024 & 2032
- Figure 44: South America Radiology Services Industry Revenue (Million), by Product Type 2024 & 2032
- Figure 45: South America Radiology Services Industry Revenue Share (%), by Product Type 2024 & 2032
- Figure 46: South America Radiology Services Industry Revenue (Million), by Modality 2024 & 2032
- Figure 47: South America Radiology Services Industry Revenue Share (%), by Modality 2024 & 2032
- Figure 48: South America Radiology Services Industry Revenue (Million), by End User 2024 & 2032
- Figure 49: South America Radiology Services Industry Revenue Share (%), by End User 2024 & 2032
- Figure 50: South America Radiology Services Industry Revenue (Million), by Country 2024 & 2032
- Figure 51: South America Radiology Services Industry Revenue Share (%), by Country 2024 & 2032
List of Tables
- Table 1: Global Radiology Services Industry Revenue Million Forecast, by Region 2019 & 2032
- Table 2: Global Radiology Services Industry Revenue Million Forecast, by Product Type 2019 & 2032
- Table 3: Global Radiology Services Industry Revenue Million Forecast, by Modality 2019 & 2032
- Table 4: Global Radiology Services Industry Revenue Million Forecast, by End User 2019 & 2032
- Table 5: Global Radiology Services Industry Revenue Million Forecast, by Region 2019 & 2032
- Table 6: Global Radiology Services Industry Revenue Million Forecast, by Country 2019 & 2032
- Table 7: United States Radiology Services Industry Revenue (Million) Forecast, by Application 2019 & 2032
- Table 8: Canada Radiology Services Industry Revenue (Million) Forecast, by Application 2019 & 2032
- Table 9: Mexico Radiology Services Industry Revenue (Million) Forecast, by Application 2019 & 2032
- Table 10: Global Radiology Services Industry Revenue Million Forecast, by Country 2019 & 2032
- Table 11: Germany Radiology Services Industry Revenue (Million) Forecast, by Application 2019 & 2032
- Table 12: United Kingdom Radiology Services Industry Revenue (Million) Forecast, by Application 2019 & 2032
- Table 13: France Radiology Services Industry Revenue (Million) Forecast, by Application 2019 & 2032
- Table 14: Italy Radiology Services Industry Revenue (Million) Forecast, by Application 2019 & 2032
- Table 15: Spain Radiology Services Industry Revenue (Million) Forecast, by Application 2019 & 2032
- Table 16: Rest of Europe Radiology Services Industry Revenue (Million) Forecast, by Application 2019 & 2032
- Table 17: Global Radiology Services Industry Revenue Million Forecast, by Country 2019 & 2032
- Table 18: China Radiology Services Industry Revenue (Million) Forecast, by Application 2019 & 2032
- Table 19: Japan Radiology Services Industry Revenue (Million) Forecast, by Application 2019 & 2032
- Table 20: India Radiology Services Industry Revenue (Million) Forecast, by Application 2019 & 2032
- Table 21: Australia Radiology Services Industry Revenue (Million) Forecast, by Application 2019 & 2032
- Table 22: South Korea Radiology Services Industry Revenue (Million) Forecast, by Application 2019 & 2032
- Table 23: Rest of Asia Pacific Radiology Services Industry Revenue (Million) Forecast, by Application 2019 & 2032
- Table 24: Global Radiology Services Industry Revenue Million Forecast, by Country 2019 & 2032
- Table 25: GCC Radiology Services Industry Revenue (Million) Forecast, by Application 2019 & 2032
- Table 26: South Africa Radiology Services Industry Revenue (Million) Forecast, by Application 2019 & 2032
- Table 27: Rest of Middle East and Africa Radiology Services Industry Revenue (Million) Forecast, by Application 2019 & 2032
- Table 28: Global Radiology Services Industry Revenue Million Forecast, by Country 2019 & 2032
- Table 29: Brazil Radiology Services Industry Revenue (Million) Forecast, by Application 2019 & 2032
- Table 30: Argentina Radiology Services Industry Revenue (Million) Forecast, by Application 2019 & 2032
- Table 31: Rest of South America Radiology Services Industry Revenue (Million) Forecast, by Application 2019 & 2032
- Table 32: Global Radiology Services Industry Revenue Million Forecast, by Product Type 2019 & 2032
- Table 33: Global Radiology Services Industry Revenue Million Forecast, by Modality 2019 & 2032
- Table 34: Global Radiology Services Industry Revenue Million Forecast, by End User 2019 & 2032
- Table 35: Global Radiology Services Industry Revenue Million Forecast, by Country 2019 & 2032
- Table 36: United States Radiology Services Industry Revenue (Million) Forecast, by Application 2019 & 2032
- Table 37: Canada Radiology Services Industry Revenue (Million) Forecast, by Application 2019 & 2032
- Table 38: Mexico Radiology Services Industry Revenue (Million) Forecast, by Application 2019 & 2032
- Table 39: Global Radiology Services Industry Revenue Million Forecast, by Product Type 2019 & 2032
- Table 40: Global Radiology Services Industry Revenue Million Forecast, by Modality 2019 & 2032
- Table 41: Global Radiology Services Industry Revenue Million Forecast, by End User 2019 & 2032
- Table 42: Global Radiology Services Industry Revenue Million Forecast, by Country 2019 & 2032
- Table 43: Germany Radiology Services Industry Revenue (Million) Forecast, by Application 2019 & 2032
- Table 44: United Kingdom Radiology Services Industry Revenue (Million) Forecast, by Application 2019 & 2032
- Table 45: France Radiology Services Industry Revenue (Million) Forecast, by Application 2019 & 2032
- Table 46: Italy Radiology Services Industry Revenue (Million) Forecast, by Application 2019 & 2032
- Table 47: Spain Radiology Services Industry Revenue (Million) Forecast, by Application 2019 & 2032
- Table 48: Rest of Europe Radiology Services Industry Revenue (Million) Forecast, by Application 2019 & 2032
- Table 49: Global Radiology Services Industry Revenue Million Forecast, by Product Type 2019 & 2032
- Table 50: Global Radiology Services Industry Revenue Million Forecast, by Modality 2019 & 2032
- Table 51: Global Radiology Services Industry Revenue Million Forecast, by End User 2019 & 2032
- Table 52: Global Radiology Services Industry Revenue Million Forecast, by Country 2019 & 2032
- Table 53: China Radiology Services Industry Revenue (Million) Forecast, by Application 2019 & 2032
- Table 54: Japan Radiology Services Industry Revenue (Million) Forecast, by Application 2019 & 2032
- Table 55: India Radiology Services Industry Revenue (Million) Forecast, by Application 2019 & 2032
- Table 56: Australia Radiology Services Industry Revenue (Million) Forecast, by Application 2019 & 2032
- Table 57: South Korea Radiology Services Industry Revenue (Million) Forecast, by Application 2019 & 2032
- Table 58: Rest of Asia Pacific Radiology Services Industry Revenue (Million) Forecast, by Application 2019 & 2032
- Table 59: Global Radiology Services Industry Revenue Million Forecast, by Product Type 2019 & 2032
- Table 60: Global Radiology Services Industry Revenue Million Forecast, by Modality 2019 & 2032
- Table 61: Global Radiology Services Industry Revenue Million Forecast, by End User 2019 & 2032
- Table 62: Global Radiology Services Industry Revenue Million Forecast, by Country 2019 & 2032
- Table 63: GCC Radiology Services Industry Revenue (Million) Forecast, by Application 2019 & 2032
- Table 64: South Africa Radiology Services Industry Revenue (Million) Forecast, by Application 2019 & 2032
- Table 65: Rest of Middle East and Africa Radiology Services Industry Revenue (Million) Forecast, by Application 2019 & 2032
- Table 66: Global Radiology Services Industry Revenue Million Forecast, by Product Type 2019 & 2032
- Table 67: Global Radiology Services Industry Revenue Million Forecast, by Modality 2019 & 2032
- Table 68: Global Radiology Services Industry Revenue Million Forecast, by End User 2019 & 2032
- Table 69: Global Radiology Services Industry Revenue Million Forecast, by Country 2019 & 2032
- Table 70: Brazil Radiology Services Industry Revenue (Million) Forecast, by Application 2019 & 2032
- Table 71: Argentina Radiology Services Industry Revenue (Million) Forecast, by Application 2019 & 2032
- Table 72: Rest of South America Radiology Services Industry Revenue (Million) Forecast, by Application 2019 & 2032
Frequently Asked Questions
1. What is the projected Compound Annual Growth Rate (CAGR) of the Radiology Services Industry?
The projected CAGR is approximately 4.50%.
2. Which companies are prominent players in the Radiology Services Industry?
Key companies in the market include Fujifilm Corporation, Canon Inc, Esaote SpA, Toshiba Corporation, Hitachi Ltd, Koninklijke Philips N V, Samsung Medison Co Ltd, Analogic Corporation, Siemens AG, General Electric Company.
3. What are the main segments of the Radiology Services Industry?
The market segments include Product Type, Modality, End User.
4. Can you provide details about the market size?
The market size is estimated to be USD 6.99 Million as of 2022.
5. What are some drivers contributing to market growth?
Increasing Burden of Pediatric Diseases. such as Coronary Heart Failures. Pneumonia. and Rise in Affordability; Increased Government Initiatives and R&D Activities to Develop Advanced Pediatric Radiology Devices.
6. What are the notable trends driving market growth?
Magnetic Resonance Imaging (MRI) Segment is Expected to Hold the Major Market Share in the Pediatric Radiology Market.
7. Are there any restraints impacting market growth?
Ethical Issues in Pediatric Research; Lack of Skilled Healthcare Professionals.
8. Can you provide examples of recent developments in the market?
August 2022: Children's Hospital New Orleans and Cleveland Clinic announced a new affiliation to expand access to board-certified pediatric radiology experts for children and families in New Orleans and Louisiana.
9. What pricing options are available for accessing the report?
Pricing options include single-user, multi-user, and enterprise licenses priced at USD 4750, USD 5250, and USD 8750 respectively.
10. Is the market size provided in terms of value or volume?
The market size is provided in terms of value, measured in Million.
11. Are there any specific market keywords associated with the report?
Yes, the market keyword associated with the report is "Radiology Services Industry," which aids in identifying and referencing the specific market segment covered.
12. How do I determine which pricing option suits my needs best?
The pricing options vary based on user requirements and access needs. Individual users may opt for single-user licenses, while businesses requiring broader access may choose multi-user or enterprise licenses for cost-effective access to the report.
13. Are there any additional resources or data provided in the Radiology Services Industry report?
While the report offers comprehensive insights, it's advisable to review the specific contents or supplementary materials provided to ascertain if additional resources or data are available.
14. How can I stay updated on further developments or reports in the Radiology Services Industry?
To stay informed about further developments, trends, and reports in the Radiology Services Industry, consider subscribing to industry newsletters, following relevant companies and organizations, or regularly checking reputable industry news sources and publications.
Methodology
Step 1 - Identification of Relevant Samples Size from Population Database


Step 2 - Approaches for Defining Global Market Size (Value, Volume* & Price*)

Note*: In applicable scenarios
Step 3 - Data Sources
Primary Research
- Web Analytics
- Survey Reports
- Research Institute
- Latest Research Reports
- Opinion Leaders
Secondary Research
- Annual Reports
- White Paper
- Latest Press Release
- Industry Association
- Paid Database
- Investor Presentations

Step 4 - Data Triangulation
Involves using different sources of information in order to increase the validity of a study
These sources are likely to be stakeholders in a program - participants, other researchers, program staff, other community members, and so on.
Then we put all data in single framework & apply various statistical tools to find out the dynamic on the market.
During the analysis stage, feedback from the stakeholder groups would be compared to determine areas of agreement as well as areas of divergence


