


Key Insights
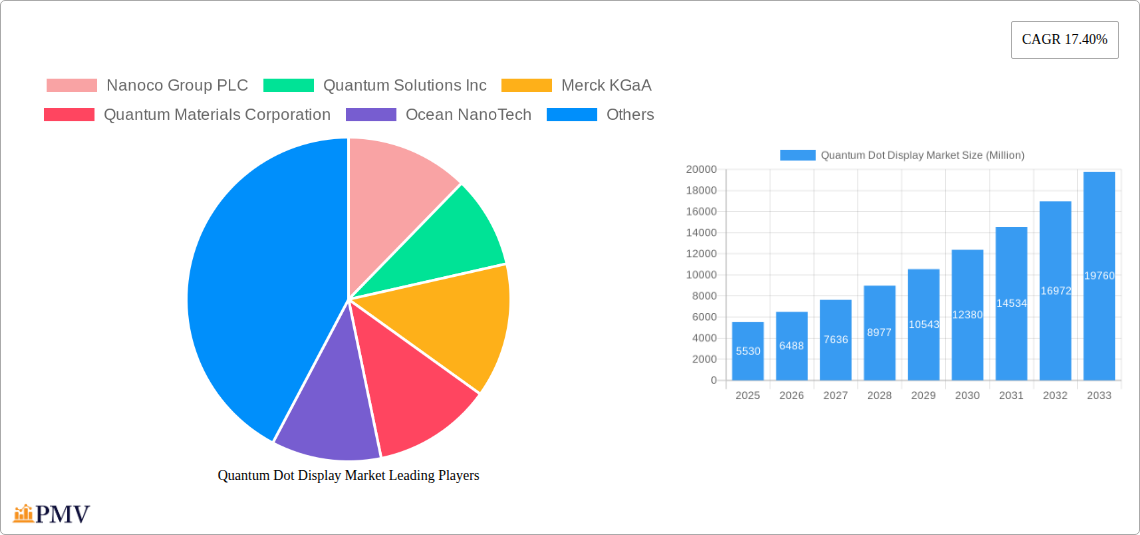
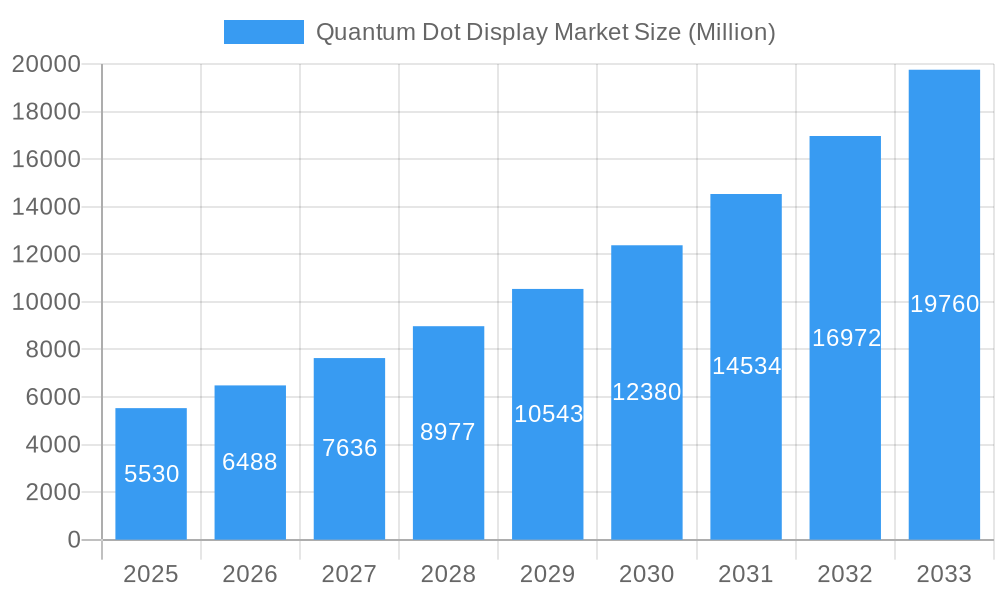
The Quantum Dot Display market is experiencing robust growth, projected to reach a market size of $5.53 billion in 2025 and maintain a Compound Annual Growth Rate (CAGR) of 17.40% from 2025 to 2033. This significant expansion is driven by several key factors. The increasing demand for high-resolution, vibrant displays in consumer electronics, particularly televisions and smartphones, is a primary driver. Furthermore, advancements in quantum dot technology, leading to improved color gamut, brightness, and energy efficiency, are fueling market adoption. The growing popularity of HDR (High Dynamic Range) content further strengthens the demand for superior display technologies like quantum dots. The diverse applications across optoelectronics, medical imaging, agriculture (precision farming technologies), and renewable energy sectors also contribute to the market's growth trajectory. Competition among key players like Nanoco Group PLC, Quantum Materials Corporation, and Merck KGaA is fostering innovation and driving down costs, making quantum dot displays more accessible to a wider consumer base.
Quantum Dot Display Market Market Size (In Billion)

However, certain challenges hinder widespread adoption. High manufacturing costs compared to traditional LCD technologies remain a constraint. Concerns about the long-term stability and potential environmental impact of quantum dots need to be addressed to ensure sustainable market growth. The market is segmented by type (III-V semiconductors, II-VI semiconductors, Silicon) and application (optoelectronics, medicine, agriculture, alternative energy). While optoelectronics and optical components currently dominate the application segment, the expanding use of quantum dots in emerging sectors like medical imaging and precision agriculture presents substantial opportunities for future growth. Geographic distribution shows significant market potential in North America (United States, Canada), Europe (United Kingdom, Germany, France), and Asia (China, Japan, India, Australia, and New Zealand), with variations in growth rates reflecting regional economic conditions and technology adoption rates. The historical period (2019-2024) data, while not explicitly provided, likely shows a steadily increasing trend that underpins the projected CAGR.
Quantum Dot Display Market Company Market Share
Quantum Dot Display Market: A Comprehensive Report (2019-2033)
This in-depth report provides a comprehensive analysis of the Quantum Dot Display Market, offering invaluable insights for industry stakeholders, investors, and researchers. Covering the period from 2019 to 2033, with a focus on 2025, this report meticulously examines market structure, competitive dynamics, technological advancements, and future growth potential. The report utilizes data-driven analysis and forecasts to provide a clear understanding of this rapidly evolving market, valued at xx Million in 2025 and projected to reach xx Million by 2033.
Quantum Dot Display Market Market Structure & Competitive Dynamics
The Quantum Dot Display market exhibits a moderately concentrated structure, with several key players vying for market share. Market concentration is influenced by factors such as technological capabilities, R&D investments, and strategic partnerships. The competitive landscape is dynamic, characterized by intense innovation, mergers and acquisitions (M&A), and the introduction of new products. Regulatory frameworks, particularly those concerning material safety and environmental regulations, play a crucial role in shaping market dynamics. The presence of substitute technologies, such as OLEDs, also exerts competitive pressure. End-user trends, particularly in consumer electronics and display technology, heavily influence market demand.
- Market Share: The top five players hold an estimated xx% of the global market share in 2025.
- M&A Activity: The past five years have witnessed xx M&A deals in the quantum dot display market, with a total deal value exceeding xx Million. These transactions often involve the acquisition of smaller, specialized companies by larger players to enhance technological capabilities or expand market reach.
- Innovation Ecosystems: Strong collaborations between research institutions, material suppliers, and display manufacturers drive innovation.
- Product Substitutes: OLED technology remains a primary substitute, although Quantum Dots offer advantages in terms of color gamut and efficiency.
Quantum Dot Display Market Industry Trends & Insights
The Quantum Dot Display market is experiencing significant growth, driven by factors such as the increasing demand for high-resolution displays, the need for improved color reproduction, and advancements in quantum dot material synthesis. The market is characterized by a compound annual growth rate (CAGR) of xx% during the forecast period (2025-2033). Technological disruptions, such as the development of more efficient and cost-effective quantum dot materials, continue to shape market dynamics. Consumer preferences toward premium display quality and sustainability considerations are driving adoption. Competitive dynamics are marked by ongoing innovation, cost reduction strategies, and the pursuit of enhanced product differentiation. Market penetration is expected to reach xx% by 2033 in key consumer electronics markets.
Dominant Markets & Segments in Quantum Dot Display Market
The Optoelectronics and Optical Components segment dominates the Quantum Dot Display market application landscape, driven by the increasing demand for high-quality displays in consumer electronics (smartphones, TVs) and other areas. Geographically, North America currently holds a leading position due to strong technological advancements and high consumer spending.
- By Type: II-VI-Semiconductors currently holds the largest market share by type due to its superior performance characteristics.
- Key Drivers (II-VI-Semiconductors): Advanced manufacturing processes and improved cost-effectiveness.
- Key Drivers (III-V-Semiconductors): Potential for higher brightness and efficiency, ongoing research and development.
- Key Drivers (Silicon): Cost-effective manufacturing, potential for integration with existing silicon technologies.
- By Application:
- Optoelectronics and Optical Components: High demand for enhanced displays in consumer electronics and other applications.
- Medicine: Growing use in biomedical imaging and diagnostics.
- Agriculture: Emerging applications in precision agriculture and crop monitoring.
- Alternative Energy: Potential applications in solar cells and energy-efficient lighting.
Quantum Dot Display Market Product Innovations
Recent advancements in quantum dot technology focus on improving brightness, color gamut, and cost-effectiveness. The development of perovskite-based quantum dots offers a potential pathway to enhance performance and reduce production costs. New applications are emerging in diverse sectors, including healthcare and agriculture. The competitive advantage lies in the ability to produce higher-quality, more efficient quantum dot materials and integrate them into commercially viable display technologies.
Report Segmentation & Scope
This report segments the Quantum Dot Display market by Type (III-V-Semiconductors, II-VI-Semiconductors, Silicon (Si)) and Application (Optoelectronics and Optical Components, Medicine, Agriculture, Alternative Energy, Other Applications). Each segment's growth projection, market size, and competitive dynamics are analyzed in detail. The report provides a comprehensive overview of the market landscape, including historical data, current trends, and future projections.
Key Drivers of Quantum Dot Display Market Growth
Several factors propel the growth of the Quantum Dot Display market. Technological advancements, specifically in material synthesis and display technology integration, are key drivers. The increasing demand for high-quality displays in consumer electronics fuels market expansion. Favorable government policies and regulations promoting technological innovation also contribute to market growth. Cost reductions in quantum dot material production further enhance market competitiveness and adoption.
Challenges in the Quantum Dot Display Market Sector
Despite promising growth prospects, the Quantum Dot Display market faces challenges. The high initial cost of quantum dot materials and the complexity of manufacturing processes create barriers to entry for smaller players. Concerns regarding the long-term stability and toxicity of certain quantum dot materials also need to be addressed. Intense competition from established display technologies such as OLED and LCD poses a significant challenge. The market is currently experiencing a xx% production cost limitation impacting overall growth.
Leading Players in the Quantum Dot Display Market Market
- Nanoco Group PLC
- Quantum Solutions Inc
- Merck KGaA
- Quantum Materials Corporation
- Ocean NanoTech
- Thermo Fisher Scientific Inc
- NnCrystal US Corporation (NN-Labs)
- UbiQD Inc
- Nanosys Inc (Shoei Electronic Materials Inc)
- NanoOptical Materials Inc
Key Developments in Quantum Dot Display Market Sector
- November 2023: UbiQD Inc. launched UbiGro Cover, a sustainable agriculture solution for optimizing greenhouse productivity.
- January 2024: Quantum Solutions Inc., in collaboration with AY Sensors, released QDot Perovskite CsPbBr3 Single Crystals for X-ray sensors, offering a superior alternative to traditional CdTe and CZT crystals.
Strategic Quantum Dot Display Market Market Outlook
The Quantum Dot Display market holds significant future potential. Continued technological innovation, particularly in reducing production costs and enhancing material performance, will drive market expansion. The increasing demand for high-quality displays across diverse sectors, coupled with strategic partnerships and investments, will fuel market growth. The market is poised for significant expansion, offering lucrative opportunities for companies involved in the development, manufacturing, and application of quantum dot display technologies.
Quantum Dot Display Market Segmentation
-
1. Type
- 1.1. III-V-Semiconductors
- 1.2. II-VI-Semiconductors
- 1.3. Silicon (Si)
-
2. Application
- 2.1. Optoelectronics and Optical Components
- 2.2. Medicine
- 2.3. Agriculture
- 2.4. Alternative Energy
- 2.5. Other Applications
Quantum Dot Display Market Segmentation By Geography
-
1. North America
- 1.1. United States
- 1.2. Canada
-
2. Europe
- 2.1. United Kingdom
- 2.2. Germany
- 2.3. France
-
3. Asia
- 3.1. China
- 3.2. Japan
- 3.3. India
- 3.4. Australia and New Zealand
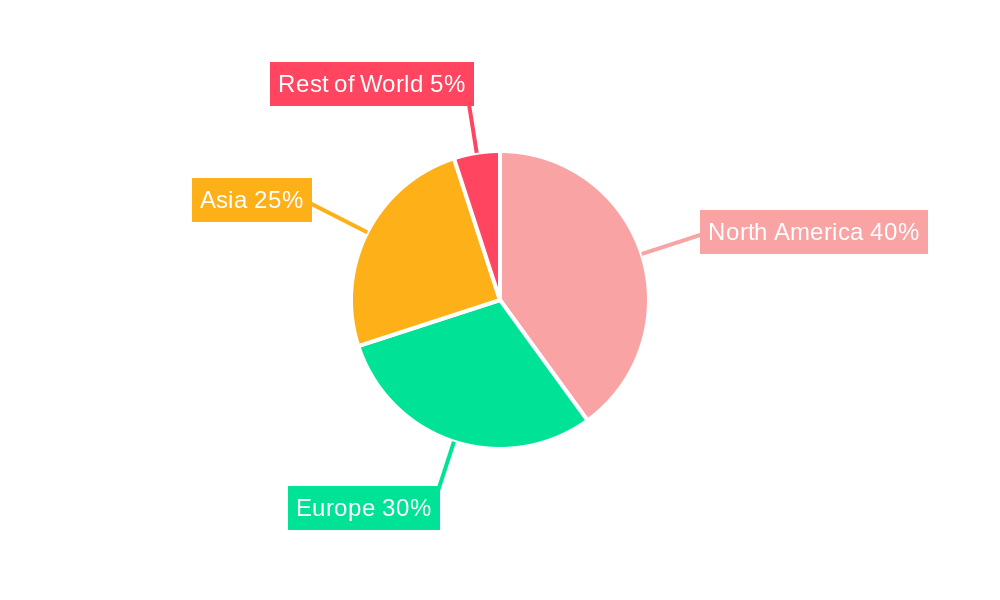
Quantum Dot Display Market Regional Market Share
Geographic Coverage of Quantum Dot Display Market
Quantum Dot Display Market REPORT HIGHLIGHTS
| Aspects | Details |
|---|---|
| Study Period | 2020-2034 |
| Base Year | 2025 |
| Estimated Year | 2026 |
| Forecast Period | 2026-2034 |
| Historical Period | 2020-2025 |
| Growth Rate | CAGR of 17.40% from 2020-2034 |
| Segmentation |
|
Table of Contents
- 1. Introduction
- 1.1. Research Scope
- 1.2. Market Segmentation
- 1.3. Research Methodology
- 1.4. Definitions and Assumptions
- 2. Executive Summary
- 2.1. Introduction
- 3. Market Dynamics
- 3.1. Introduction
- 3.2. Market Drivers
- 3.2.1. Increasing Demand for Quantum Dots in High-Quality Display Devices; Growing Demand for Energy-efficient Solutions
- 3.3. Market Restrains
- 3.3.1. Complexity Associated with the 3D Electronics and Limited Material Selection
- 3.4. Market Trends
- 3.4.1. Optoelectronics and Optical Components to Witness Significant Growth
- 4. Market Factor Analysis
- 4.1. Porters Five Forces
- 4.2. Supply/Value Chain
- 4.3. PESTEL analysis
- 4.4. Market Entropy
- 4.5. Patent/Trademark Analysis
- 5. Global Quantum Dot Display Market Analysis, Insights and Forecast, 2020-2032
- 5.1. Market Analysis, Insights and Forecast - by Type
- 5.1.1. III-V-Semiconductors
- 5.1.2. II-VI-Semiconductors
- 5.1.3. Silicon (Si)
- 5.2. Market Analysis, Insights and Forecast - by Application
- 5.2.1. Optoelectronics and Optical Components
- 5.2.2. Medicine
- 5.2.3. Agriculture
- 5.2.4. Alternative Energy
- 5.2.5. Other Applications
- 5.3. Market Analysis, Insights and Forecast - by Region
- 5.3.1. North America
- 5.3.2. Europe
- 5.3.3. Asia
- 5.1. Market Analysis, Insights and Forecast - by Type
- 6. North America Quantum Dot Display Market Analysis, Insights and Forecast, 2020-2032
- 6.1. Market Analysis, Insights and Forecast - by Type
- 6.1.1. III-V-Semiconductors
- 6.1.2. II-VI-Semiconductors
- 6.1.3. Silicon (Si)
- 6.2. Market Analysis, Insights and Forecast - by Application
- 6.2.1. Optoelectronics and Optical Components
- 6.2.2. Medicine
- 6.2.3. Agriculture
- 6.2.4. Alternative Energy
- 6.2.5. Other Applications
- 6.1. Market Analysis, Insights and Forecast - by Type
- 7. Europe Quantum Dot Display Market Analysis, Insights and Forecast, 2020-2032
- 7.1. Market Analysis, Insights and Forecast - by Type
- 7.1.1. III-V-Semiconductors
- 7.1.2. II-VI-Semiconductors
- 7.1.3. Silicon (Si)
- 7.2. Market Analysis, Insights and Forecast - by Application
- 7.2.1. Optoelectronics and Optical Components
- 7.2.2. Medicine
- 7.2.3. Agriculture
- 7.2.4. Alternative Energy
- 7.2.5. Other Applications
- 7.1. Market Analysis, Insights and Forecast - by Type
- 8. Asia Quantum Dot Display Market Analysis, Insights and Forecast, 2020-2032
- 8.1. Market Analysis, Insights and Forecast - by Type
- 8.1.1. III-V-Semiconductors
- 8.1.2. II-VI-Semiconductors
- 8.1.3. Silicon (Si)
- 8.2. Market Analysis, Insights and Forecast - by Application
- 8.2.1. Optoelectronics and Optical Components
- 8.2.2. Medicine
- 8.2.3. Agriculture
- 8.2.4. Alternative Energy
- 8.2.5. Other Applications
- 8.1. Market Analysis, Insights and Forecast - by Type
- 9. Competitive Analysis
- 9.1. Global Market Share Analysis 2025
- 9.2. Company Profiles
- 9.2.1 Nanoco Group PLC
- 9.2.1.1. Overview
- 9.2.1.2. Products
- 9.2.1.3. SWOT Analysis
- 9.2.1.4. Recent Developments
- 9.2.1.5. Financials (Based on Availability)
- 9.2.2 Quantum Solutions Inc
- 9.2.2.1. Overview
- 9.2.2.2. Products
- 9.2.2.3. SWOT Analysis
- 9.2.2.4. Recent Developments
- 9.2.2.5. Financials (Based on Availability)
- 9.2.3 Merck KGaA
- 9.2.3.1. Overview
- 9.2.3.2. Products
- 9.2.3.3. SWOT Analysis
- 9.2.3.4. Recent Developments
- 9.2.3.5. Financials (Based on Availability)
- 9.2.4 Quantum Materials Corporation
- 9.2.4.1. Overview
- 9.2.4.2. Products
- 9.2.4.3. SWOT Analysis
- 9.2.4.4. Recent Developments
- 9.2.4.5. Financials (Based on Availability)
- 9.2.5 Ocean NanoTech
- 9.2.5.1. Overview
- 9.2.5.2. Products
- 9.2.5.3. SWOT Analysis
- 9.2.5.4. Recent Developments
- 9.2.5.5. Financials (Based on Availability)
- 9.2.6 Thermo Fisher Scientific Inc
- 9.2.6.1. Overview
- 9.2.6.2. Products
- 9.2.6.3. SWOT Analysis
- 9.2.6.4. Recent Developments
- 9.2.6.5. Financials (Based on Availability)
- 9.2.7 NnCrystal US Corporation (NN-Labs)
- 9.2.7.1. Overview
- 9.2.7.2. Products
- 9.2.7.3. SWOT Analysis
- 9.2.7.4. Recent Developments
- 9.2.7.5. Financials (Based on Availability)
- 9.2.8 UbiQD Inc
- 9.2.8.1. Overview
- 9.2.8.2. Products
- 9.2.8.3. SWOT Analysis
- 9.2.8.4. Recent Developments
- 9.2.8.5. Financials (Based on Availability)
- 9.2.9 Nanosys Inc (Shoei Electronic Materials Inc)
- 9.2.9.1. Overview
- 9.2.9.2. Products
- 9.2.9.3. SWOT Analysis
- 9.2.9.4. Recent Developments
- 9.2.9.5. Financials (Based on Availability)
- 9.2.10 NanoOptical Materials Inc
- 9.2.10.1. Overview
- 9.2.10.2. Products
- 9.2.10.3. SWOT Analysis
- 9.2.10.4. Recent Developments
- 9.2.10.5. Financials (Based on Availability)
- 9.2.1 Nanoco Group PLC
List of Figures
- Figure 1: Global Quantum Dot Display Market Revenue Breakdown (Million, %) by Region 2025 & 2033
- Figure 2: North America Quantum Dot Display Market Revenue (Million), by Type 2025 & 2033
- Figure 3: North America Quantum Dot Display Market Revenue Share (%), by Type 2025 & 2033
- Figure 4: North America Quantum Dot Display Market Revenue (Million), by Application 2025 & 2033
- Figure 5: North America Quantum Dot Display Market Revenue Share (%), by Application 2025 & 2033
- Figure 6: North America Quantum Dot Display Market Revenue (Million), by Country 2025 & 2033
- Figure 7: North America Quantum Dot Display Market Revenue Share (%), by Country 2025 & 2033
- Figure 8: Europe Quantum Dot Display Market Revenue (Million), by Type 2025 & 2033
- Figure 9: Europe Quantum Dot Display Market Revenue Share (%), by Type 2025 & 2033
- Figure 10: Europe Quantum Dot Display Market Revenue (Million), by Application 2025 & 2033
- Figure 11: Europe Quantum Dot Display Market Revenue Share (%), by Application 2025 & 2033
- Figure 12: Europe Quantum Dot Display Market Revenue (Million), by Country 2025 & 2033
- Figure 13: Europe Quantum Dot Display Market Revenue Share (%), by Country 2025 & 2033
- Figure 14: Asia Quantum Dot Display Market Revenue (Million), by Type 2025 & 2033
- Figure 15: Asia Quantum Dot Display Market Revenue Share (%), by Type 2025 & 2033
- Figure 16: Asia Quantum Dot Display Market Revenue (Million), by Application 2025 & 2033
- Figure 17: Asia Quantum Dot Display Market Revenue Share (%), by Application 2025 & 2033
- Figure 18: Asia Quantum Dot Display Market Revenue (Million), by Country 2025 & 2033
- Figure 19: Asia Quantum Dot Display Market Revenue Share (%), by Country 2025 & 2033
List of Tables
- Table 1: Global Quantum Dot Display Market Revenue Million Forecast, by Type 2020 & 2033
- Table 2: Global Quantum Dot Display Market Revenue Million Forecast, by Application 2020 & 2033
- Table 3: Global Quantum Dot Display Market Revenue Million Forecast, by Region 2020 & 2033
- Table 4: Global Quantum Dot Display Market Revenue Million Forecast, by Type 2020 & 2033
- Table 5: Global Quantum Dot Display Market Revenue Million Forecast, by Application 2020 & 2033
- Table 6: Global Quantum Dot Display Market Revenue Million Forecast, by Country 2020 & 2033
- Table 7: United States Quantum Dot Display Market Revenue (Million) Forecast, by Application 2020 & 2033
- Table 8: Canada Quantum Dot Display Market Revenue (Million) Forecast, by Application 2020 & 2033
- Table 9: Global Quantum Dot Display Market Revenue Million Forecast, by Type 2020 & 2033
- Table 10: Global Quantum Dot Display Market Revenue Million Forecast, by Application 2020 & 2033
- Table 11: Global Quantum Dot Display Market Revenue Million Forecast, by Country 2020 & 2033
- Table 12: United Kingdom Quantum Dot Display Market Revenue (Million) Forecast, by Application 2020 & 2033
- Table 13: Germany Quantum Dot Display Market Revenue (Million) Forecast, by Application 2020 & 2033
- Table 14: France Quantum Dot Display Market Revenue (Million) Forecast, by Application 2020 & 2033
- Table 15: Global Quantum Dot Display Market Revenue Million Forecast, by Type 2020 & 2033
- Table 16: Global Quantum Dot Display Market Revenue Million Forecast, by Application 2020 & 2033
- Table 17: Global Quantum Dot Display Market Revenue Million Forecast, by Country 2020 & 2033
- Table 18: China Quantum Dot Display Market Revenue (Million) Forecast, by Application 2020 & 2033
- Table 19: Japan Quantum Dot Display Market Revenue (Million) Forecast, by Application 2020 & 2033
- Table 20: India Quantum Dot Display Market Revenue (Million) Forecast, by Application 2020 & 2033
- Table 21: Australia and New Zealand Quantum Dot Display Market Revenue (Million) Forecast, by Application 2020 & 2033
Frequently Asked Questions
1. What is the projected Compound Annual Growth Rate (CAGR) of the Quantum Dot Display Market?
The projected CAGR is approximately 17.40%.
2. Which companies are prominent players in the Quantum Dot Display Market?
Key companies in the market include Nanoco Group PLC, Quantum Solutions Inc, Merck KGaA, Quantum Materials Corporation, Ocean NanoTech, Thermo Fisher Scientific Inc, NnCrystal US Corporation (NN-Labs), UbiQD Inc, Nanosys Inc (Shoei Electronic Materials Inc), NanoOptical Materials Inc.
3. What are the main segments of the Quantum Dot Display Market?
The market segments include Type, Application.
4. Can you provide details about the market size?
The market size is estimated to be USD 5.53 Million as of 2022.
5. What are some drivers contributing to market growth?
Increasing Demand for Quantum Dots in High-Quality Display Devices; Growing Demand for Energy-efficient Solutions.
6. What are the notable trends driving market growth?
Optoelectronics and Optical Components to Witness Significant Growth.
7. Are there any restraints impacting market growth?
Complexity Associated with the 3D Electronics and Limited Material Selection.
8. Can you provide examples of recent developments in the market?
January 2024 - Quantum Solutions announced the release of QDot Perovskite CsPbBr3 Single Crystals for X-ray sensors. The product is released in collaboration with AY Sensors. This material is a significant alternative to CdTe and CdZnTe (CZT) crystals used in direct X-ray sensors. CsPbBr3 single crystals are regarded as the most favorable perovskite composition for X-ray sensors in terms of performance and long-term stability.
9. What pricing options are available for accessing the report?
Pricing options include single-user, multi-user, and enterprise licenses priced at USD 4750, USD 5250, and USD 8750 respectively.
10. Is the market size provided in terms of value or volume?
The market size is provided in terms of value, measured in Million.
11. Are there any specific market keywords associated with the report?
Yes, the market keyword associated with the report is "Quantum Dot Display Market," which aids in identifying and referencing the specific market segment covered.
12. How do I determine which pricing option suits my needs best?
The pricing options vary based on user requirements and access needs. Individual users may opt for single-user licenses, while businesses requiring broader access may choose multi-user or enterprise licenses for cost-effective access to the report.
13. Are there any additional resources or data provided in the Quantum Dot Display Market report?
While the report offers comprehensive insights, it's advisable to review the specific contents or supplementary materials provided to ascertain if additional resources or data are available.
14. How can I stay updated on further developments or reports in the Quantum Dot Display Market?
To stay informed about further developments, trends, and reports in the Quantum Dot Display Market, consider subscribing to industry newsletters, following relevant companies and organizations, or regularly checking reputable industry news sources and publications.
Methodology
Step 1 - Identification of Relevant Samples Size from Population Database


Step 2 - Approaches for Defining Global Market Size (Value, Volume* & Price*)

Note*: In applicable scenarios
Step 3 - Data Sources
Primary Research
- Web Analytics
- Survey Reports
- Research Institute
- Latest Research Reports
- Opinion Leaders
Secondary Research
- Annual Reports
- White Paper
- Latest Press Release
- Industry Association
- Paid Database
- Investor Presentations

Step 4 - Data Triangulation
Involves using different sources of information in order to increase the validity of a study
These sources are likely to be stakeholders in a program - participants, other researchers, program staff, other community members, and so on.
Then we put all data in single framework & apply various statistical tools to find out the dynamic on the market.
During the analysis stage, feedback from the stakeholder groups would be compared to determine areas of agreement as well as areas of divergence