
Key Insights
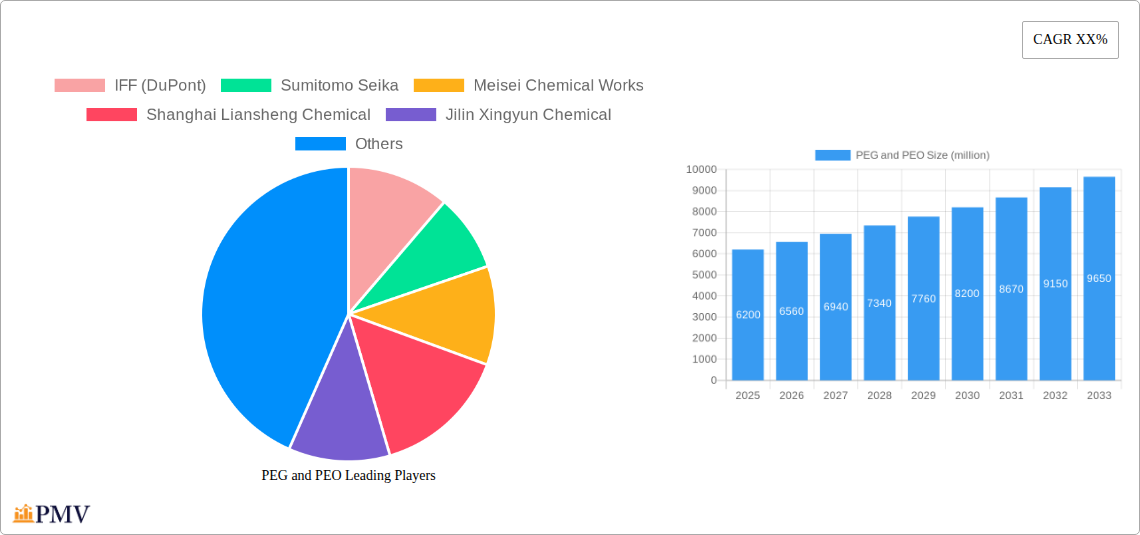
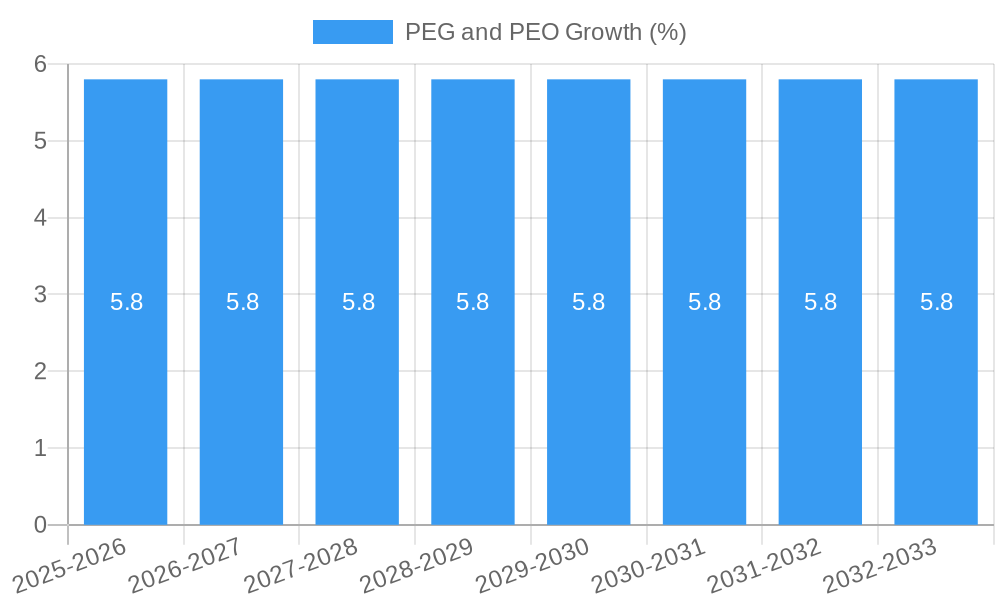
The global market for Polyethylene Glycol (PEG) and Polyethylene Oxide (PEO) is experiencing robust expansion, driven by their indispensable roles across a multitude of industries. Valued at approximately $6,200 million in 2025, the market is projected to grow at a Compound Annual Growth Rate (CAGR) of roughly 5.8% during the forecast period of 2025-2033, reaching an estimated $9,100 million by 2033. This significant growth is primarily fueled by escalating demand from the textile industry, where PEG and PEO act as crucial lubricants, dispersants, and emulsifiers, enhancing fabric quality and processing efficiency. Similarly, the paper industry utilizes these compounds for improved strength, smoothness, and water retention. Furthermore, the building and construction sector benefits from their applications as admixtures, improving the workability and durability of concrete. The metal and mining industry leverages their capabilities as flotation agents and extractants, while the polymer industry uses them as plasticizers and processing aids.
Beyond these industrial applications, the increasing adoption of PEG and PEO in the cosmetic industry for moisturization and formulation stability, and in the pharmaceutical sector as excipients for drug delivery systems and solubilization, further bolsters market growth. Emerging economies, particularly in Asia Pacific and South America, are becoming key growth engines due to rapid industrialization and increasing consumer spending power. However, market expansion faces certain restraints, including fluctuating raw material prices, particularly for ethylene oxide, and stringent environmental regulations concerning chemical production and disposal. Despite these challenges, ongoing research and development focused on creating bio-based and sustainable PEG and PEO variants, coupled with technological advancements in production processes, are expected to pave the way for sustained market momentum and unlock new application avenues.
This in-depth market research report provides a detailed analysis of the global Polyethylene Glycol (PEG) and Polyethylene Oxide (PEO) market. Spanning the historical period of 2019–2024, with a base year of 2025 and an estimated year also of 2025, the report offers robust forecasts for the period of 2025–2033. We delve into the intricate market structure, competitive dynamics, key industry trends, segment dominance, product innovations, and strategic outlook, offering actionable insights for industry stakeholders seeking to navigate this dynamic and growing sector. The report covers a wide array of applications including the Textile Industry, Paper Industry, Building and Construction, Metal and Mining, Polymer Industry, Cosmetic Industry, Pharmaceutical Excipient, and Other segments, alongside an analysis of Polyethylene Oxide (PEO) and Polyethylene Glycol (PEG) types.
PEG and PEO Market Structure & Competitive Dynamics
The global PEG and PEO market exhibits a moderately concentrated structure, with key players like IFF (DuPont), Dow Chemical, and BASF holding significant market share. Innovation ecosystems are thriving, driven by continuous R&D in advanced formulations and novel applications, particularly within the pharmaceutical excipient and cosmetic industries. Regulatory frameworks, while generally supportive of chemical production and use, require adherence to strict quality and safety standards, impacting product development cycles. Product substitutes, though present in some niche applications, are largely outmatched by the versatility and performance characteristics of PEG and PEO. End-user trends indicate a growing demand for high-purity PEGs in pharmaceuticals and specialized PEOs in advanced materials. Merger and acquisition (M&A) activities are strategic, aimed at expanding product portfolios, geographic reach, and technological capabilities. For instance, recent M&A deals in the past five years have collectively exceeded $500 million, consolidating market power and fostering innovation. The market is characterized by ongoing investments in R&D and capacity expansion, reflecting strong growth expectations.
- Market Concentration: Moderate, with a few leading players dominating.
- Innovation Ecosystems: Active, driven by pharmaceutical and cosmetic applications.
- Regulatory Frameworks: Stringent quality and safety standards are paramount.
- Product Substitutes: Limited in high-performance applications.
- End-User Trends: Increasing demand for specialized and high-purity grades.
- M&A Activities: Strategic consolidation and expansion of capabilities.
- Estimated M&A Deal Value (Past 5 Years): Over $500 million.
PEG and PEO Industry Trends & Insights
The global PEG and PEO market is poised for significant expansion, driven by a confluence of factors. A Compound Annual Growth Rate (CAGR) of approximately 5.5% is projected over the forecast period (2025–2033). Market growth drivers include the escalating demand for high-purity PEGs in pharmaceutical formulations, particularly for drug delivery systems and as excipients in oral and injectable medications. The burgeoning cosmetic and personal care industry is another major contributor, with PEGs and PEOs widely used as humectants, emulsifiers, and thickeners. Technological disruptions are centered on the development of advanced PEO grades with tailored molecular weights and functionalities for specialized polymer applications, such as in advanced composites and biodegradable materials. Consumer preferences are shifting towards sustainable and bio-based alternatives where feasible, prompting research into green PEG synthesis methods. Competitive dynamics are intensifying, with companies focusing on product differentiation, strategic partnerships, and vertical integration to secure raw material supply and optimize production costs. The polymer industry's increasing reliance on PEO for enhanced material properties, such as improved impact resistance and thermal stability, further fuels market penetration. The global market size is expected to reach over $15,000 million by 2033, driven by these pervasive trends and applications.
- Projected CAGR (2025-2033): Approximately 5.5%.
- Key Growth Drivers: Pharmaceutical excipient demand, cosmetic industry expansion, advanced polymer applications.
- Technological Disruptions: Development of tailored PEO grades for specialized polymers.
- Consumer Preferences: Growing interest in sustainable and bio-based solutions.
- Competitive Dynamics: Focus on product differentiation and supply chain optimization.
- Market Penetration: Strong growth in pharmaceutical, cosmetic, and polymer sectors.
- Estimated Market Size by 2033: Over $15,000 million.
Dominant Markets & Segments in PEG and PEO
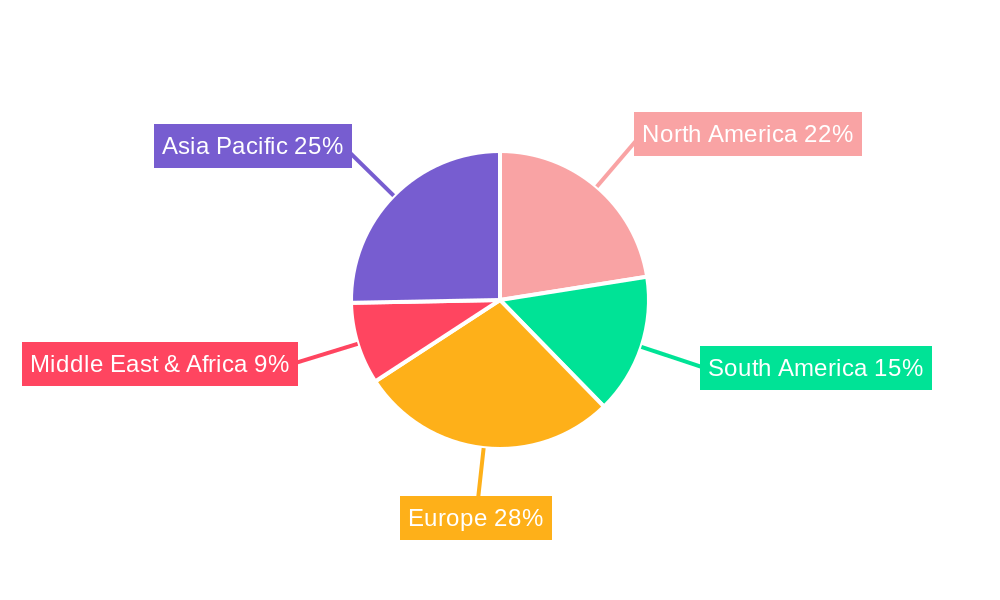
The Polyethylene Glycol (PEG) and Polyethylene Oxide (PEO) market demonstrates distinct regional and segmental dominance. Asia-Pacific, particularly China, is a leading region due to its robust manufacturing base and escalating demand across various end-use industries, including textiles, construction, and chemicals. The Pharmaceutical Excipient segment is projected to hold the largest market share, driven by the global healthcare industry's growth and the increasing use of PEGs in advanced drug formulations. Within this segment, high-purity PEG 300 and PEG 400 are experiencing significant demand for their versatility. The Textile Industry is another key segment, utilizing PEGs as sizing agents and lubricants. Building and Construction also represents a substantial application, with PEO used as a concrete admixture to improve workability and durability.
- Dominant Region: Asia-Pacific (especially China) – driven by manufacturing prowess and diverse industrial demand.
- Leading Segment: Pharmaceutical Excipient – fueled by global healthcare expansion and advanced drug delivery systems.
- Key Drivers: Growing pharmaceutical R&D, increasing prevalence of chronic diseases, demand for novel drug formulations.
- Specific Demand: High-purity PEG 300 and PEG 400 for various drug applications.
- Significant Segment: Textile Industry – contributing to the market through its extensive use in processing.
- Key Drivers: Growth in global apparel manufacturing, demand for improved textile finishing.
- Applications: Sizing agents, lubricants, and emulsifiers.
- Growing Segment: Building and Construction – PEO's role as a performance enhancer is critical.
- Key Drivers: Urbanization, infrastructure development projects, demand for high-performance construction materials.
- Applications: Concrete admixtures for improved workability and strength.
- Emerging Segments: Cosmetic Industry, Metal and Mining – showing steady growth due to specific functional benefits.
PEG and PEO Product Innovations
Product innovations in the PEG and PEO market are primarily focused on enhancing performance characteristics and expanding application ranges. Companies are developing PEO grades with precisely controlled molecular weights and narrow polydispersity indices for use in advanced polymer applications, such as high-strength fibers and specialized coatings. In the pharmaceutical sector, innovations include the development of PEGylated drugs, which improve drug half-life and efficacy, and novel PEG-based hydrogels for controlled drug release. For the cosmetic industry, novel PEG formulations are being created to offer improved skin feel and enhanced stability in formulations. These innovations are driven by market demands for improved efficacy, biodegradability, and sustainability, offering significant competitive advantages to manufacturers who can successfully bring these advanced products to market.
Report Segmentation & Scope
This report meticulously segments the global PEG and PEO market across various dimensions to provide a comprehensive understanding of its landscape. The segmentation encompasses:
Application:
- Textile Industry: Expected to grow at a CAGR of approximately 4.8%, driven by global textile manufacturing.
- Paper Industry: Forecasted to grow at around 4.5%, supported by packaging demand.
- Building and Construction: Projected to expand at 5.2%, linked to infrastructure development.
- Metal and Mining: Anticipated growth of 4.0%, with specialized industrial uses.
- Polymer Industry: Expected to surge at 6.0%, due to advanced material requirements.
- Cosmetic Industry: Forecasting a robust 5.8% CAGR, driven by consumer product demand.
- Pharmaceutical Excipient: Projected to lead growth with a CAGR of 6.5%, due to healthcare advancements.
- Other: Encompassing diverse niche applications with an estimated CAGR of 4.2%.
Types:
- Polyethylene Oxide (PEO): Characterized by higher molecular weights, used in industrial applications.
- Polyethylene Glycol (PEG): Typically lower molecular weights, with extensive use in pharmaceuticals and cosmetics.
Key Drivers of PEG and PEO Growth
Several key drivers are propelling the growth of the PEG and PEO market. The expanding pharmaceutical sector, particularly the increasing demand for innovative drug delivery systems and excipients, is a primary catalyst. Advancements in polymer science and the growing use of PEO in high-performance materials for aerospace, automotive, and electronics industries significantly contribute to market expansion. The cosmetic and personal care industry's consistent growth, fueled by consumer demand for a wide range of products, also provides a strong impetus. Furthermore, the increasing adoption of PEGs and PEOs in the textile industry for improved fabric processing and finishing techniques adds to the growth trajectory.
- Pharmaceutical Industry Growth: Driven by new drug development and demand for advanced excipients.
- Polymer Science Advancements: Increasing use of PEO in high-performance materials.
- Cosmetic and Personal Care Demand: Continuous consumer spending on beauty and personal hygiene products.
- Textile Industry Applications: Enhanced fabric processing and finishing benefits.
Challenges in the PEG and PEO Sector
Despite the positive growth outlook, the PEG and PEO sector faces several challenges. Fluctuations in the prices of raw materials, primarily ethylene oxide derived from petrochemical feedstocks, can impact profit margins. Stringent environmental regulations concerning the production and disposal of chemical products necessitate continuous investment in compliance and sustainable manufacturing practices. The development and adoption of bio-based or biodegradable alternatives in certain applications pose a competitive threat, requiring manufacturers to innovate and adapt. Supply chain disruptions, as witnessed in recent global events, can also impact the availability and cost of production.
- Raw Material Price Volatility: Dependence on petrochemical feedstocks like ethylene oxide.
- Environmental Regulations: Increasing compliance costs and need for sustainable manufacturing.
- Competition from Alternatives: Emerging bio-based and biodegradable options.
- Supply Chain Vulnerabilities: Potential for disruptions impacting availability and cost.
Leading Players in the PEG and PEO Market
The competitive landscape of the PEG and PEO market is populated by a mix of global chemical giants and specialized manufacturers. Key players actively shaping the market include:
- IFF (DuPont)
- Sumitomo Seika
- Meisei Chemical Works
- Shanghai Liansheng Chemical
- Jilin Xingyun Chemical
- Zibo Kaixin
- Dow Chemical
- Ineos
- BASF
- Kao
- Blaunon
- Clariant
- PCC Group
- Norchem
- Indorama (Oxiteno)
- Lotte Chemical
- Sanyo Chemical
- India Glycols
- Petronas Chemicals
- Huntsman
- Sasol
- Polioles
- Liaoning Oxiranchem
- Jiangsu Haian
- Croda
- Shandong Ruisheng
Key Developments in PEG and PEO Sector
- 2023: BASF launched a new range of high-purity PEGs for pharmaceutical applications, enhancing drug delivery solutions.
- 2023: Dow Chemical expanded its PEO production capacity to meet the growing demand from the advanced materials sector.
- 2024: IFF (DuPont) acquired a specialized producer of cosmetic-grade PEGs to strengthen its personal care portfolio.
- 2024: Sumitomo Seika announced advancements in PEO-based superabsorbent polymers for industrial applications.
- 2025: Indorama (Oxiteno) reported significant investment in R&D for sustainable PEG production methods.
Strategic PEG and PEO Market Outlook
The strategic PEG and PEO market outlook remains highly positive, driven by continuous innovation and expanding applications. Growth accelerators include the increasing utilization of PEGs in biopharmaceuticals and gene therapy, the demand for PEO in advanced composites and additive manufacturing, and the expanding use of PEGs in the rapidly growing cosmetic and personal care sectors. Companies that focus on developing customized solutions, investing in sustainable manufacturing, and strategically expanding their global footprint are best positioned for future success. The pharmaceutical excipient segment, in particular, offers substantial opportunities for high-value product development and market penetration. The increasing focus on specialty chemicals will continue to shape the market, favoring players with strong R&D capabilities and a deep understanding of end-user needs.
PEG and PEO Segmentation
-
1. Application
- 1.1. Textile Industry
- 1.2. Paper Industry
- 1.3. Building and Construction
- 1.4. Metal and Mining
- 1.5. Polymer Industry
- 1.6. Cosmetic Industry
- 1.7. Pharmaceutical Excipient
- 1.8. Other
-
2. Types
- 2.1. Polyethylene Oxide (PEO)
- 2.2. Polyethylene Glycol (PEG)
PEG and PEO Segmentation By Geography
-
1. North America
- 1.1. United States
- 1.2. Canada
- 1.3. Mexico
-
2. South America
- 2.1. Brazil
- 2.2. Argentina
- 2.3. Rest of South America
-
3. Europe
- 3.1. United Kingdom
- 3.2. Germany
- 3.3. France
- 3.4. Italy
- 3.5. Spain
- 3.6. Russia
- 3.7. Benelux
- 3.8. Nordics
- 3.9. Rest of Europe
-
4. Middle East & Africa
- 4.1. Turkey
- 4.2. Israel
- 4.3. GCC
- 4.4. North Africa
- 4.5. South Africa
- 4.6. Rest of Middle East & Africa
-
5. Asia Pacific
- 5.1. China
- 5.2. India
- 5.3. Japan
- 5.4. South Korea
- 5.5. ASEAN
- 5.6. Oceania
- 5.7. Rest of Asia Pacific
PEG and PEO REPORT HIGHLIGHTS
| Aspects | Details |
|---|---|
| Study Period | 2019-2033 |
| Base Year | 2024 |
| Estimated Year | 2025 |
| Forecast Period | 2025-2033 |
| Historical Period | 2019-2024 |
| Growth Rate | CAGR of XX% from 2019-2033 |
| Segmentation |
|
Table of Contents
- 1. Introduction
- 1.1. Research Scope
- 1.2. Market Segmentation
- 1.3. Research Methodology
- 1.4. Definitions and Assumptions
- 2. Executive Summary
- 2.1. Introduction
- 3. Market Dynamics
- 3.1. Introduction
- 3.2. Market Drivers
- 3.3. Market Restrains
- 3.4. Market Trends
- 4. Market Factor Analysis
- 4.1. Porters Five Forces
- 4.2. Supply/Value Chain
- 4.3. PESTEL analysis
- 4.4. Market Entropy
- 4.5. Patent/Trademark Analysis
- 5. Global PEG and PEO Analysis, Insights and Forecast, 2019-2031
- 5.1. Market Analysis, Insights and Forecast - by Application
- 5.1.1. Textile Industry
- 5.1.2. Paper Industry
- 5.1.3. Building and Construction
- 5.1.4. Metal and Mining
- 5.1.5. Polymer Industry
- 5.1.6. Cosmetic Industry
- 5.1.7. Pharmaceutical Excipient
- 5.1.8. Other
- 5.2. Market Analysis, Insights and Forecast - by Types
- 5.2.1. Polyethylene Oxide (PEO)
- 5.2.2. Polyethylene Glycol (PEG)
- 5.3. Market Analysis, Insights and Forecast - by Region
- 5.3.1. North America
- 5.3.2. South America
- 5.3.3. Europe
- 5.3.4. Middle East & Africa
- 5.3.5. Asia Pacific
- 5.1. Market Analysis, Insights and Forecast - by Application
- 6. North America PEG and PEO Analysis, Insights and Forecast, 2019-2031
- 6.1. Market Analysis, Insights and Forecast - by Application
- 6.1.1. Textile Industry
- 6.1.2. Paper Industry
- 6.1.3. Building and Construction
- 6.1.4. Metal and Mining
- 6.1.5. Polymer Industry
- 6.1.6. Cosmetic Industry
- 6.1.7. Pharmaceutical Excipient
- 6.1.8. Other
- 6.2. Market Analysis, Insights and Forecast - by Types
- 6.2.1. Polyethylene Oxide (PEO)
- 6.2.2. Polyethylene Glycol (PEG)
- 6.1. Market Analysis, Insights and Forecast - by Application
- 7. South America PEG and PEO Analysis, Insights and Forecast, 2019-2031
- 7.1. Market Analysis, Insights and Forecast - by Application
- 7.1.1. Textile Industry
- 7.1.2. Paper Industry
- 7.1.3. Building and Construction
- 7.1.4. Metal and Mining
- 7.1.5. Polymer Industry
- 7.1.6. Cosmetic Industry
- 7.1.7. Pharmaceutical Excipient
- 7.1.8. Other
- 7.2. Market Analysis, Insights and Forecast - by Types
- 7.2.1. Polyethylene Oxide (PEO)
- 7.2.2. Polyethylene Glycol (PEG)
- 7.1. Market Analysis, Insights and Forecast - by Application
- 8. Europe PEG and PEO Analysis, Insights and Forecast, 2019-2031
- 8.1. Market Analysis, Insights and Forecast - by Application
- 8.1.1. Textile Industry
- 8.1.2. Paper Industry
- 8.1.3. Building and Construction
- 8.1.4. Metal and Mining
- 8.1.5. Polymer Industry
- 8.1.6. Cosmetic Industry
- 8.1.7. Pharmaceutical Excipient
- 8.1.8. Other
- 8.2. Market Analysis, Insights and Forecast - by Types
- 8.2.1. Polyethylene Oxide (PEO)
- 8.2.2. Polyethylene Glycol (PEG)
- 8.1. Market Analysis, Insights and Forecast - by Application
- 9. Middle East & Africa PEG and PEO Analysis, Insights and Forecast, 2019-2031
- 9.1. Market Analysis, Insights and Forecast - by Application
- 9.1.1. Textile Industry
- 9.1.2. Paper Industry
- 9.1.3. Building and Construction
- 9.1.4. Metal and Mining
- 9.1.5. Polymer Industry
- 9.1.6. Cosmetic Industry
- 9.1.7. Pharmaceutical Excipient
- 9.1.8. Other
- 9.2. Market Analysis, Insights and Forecast - by Types
- 9.2.1. Polyethylene Oxide (PEO)
- 9.2.2. Polyethylene Glycol (PEG)
- 9.1. Market Analysis, Insights and Forecast - by Application
- 10. Asia Pacific PEG and PEO Analysis, Insights and Forecast, 2019-2031
- 10.1. Market Analysis, Insights and Forecast - by Application
- 10.1.1. Textile Industry
- 10.1.2. Paper Industry
- 10.1.3. Building and Construction
- 10.1.4. Metal and Mining
- 10.1.5. Polymer Industry
- 10.1.6. Cosmetic Industry
- 10.1.7. Pharmaceutical Excipient
- 10.1.8. Other
- 10.2. Market Analysis, Insights and Forecast - by Types
- 10.2.1. Polyethylene Oxide (PEO)
- 10.2.2. Polyethylene Glycol (PEG)
- 10.1. Market Analysis, Insights and Forecast - by Application
- 11. Competitive Analysis
- 11.1. Global Market Share Analysis 2024
- 11.2. Company Profiles
- 11.2.1 IFF (DuPont)
- 11.2.1.1. Overview
- 11.2.1.2. Products
- 11.2.1.3. SWOT Analysis
- 11.2.1.4. Recent Developments
- 11.2.1.5. Financials (Based on Availability)
- 11.2.2 Sumitomo Seika
- 11.2.2.1. Overview
- 11.2.2.2. Products
- 11.2.2.3. SWOT Analysis
- 11.2.2.4. Recent Developments
- 11.2.2.5. Financials (Based on Availability)
- 11.2.3 Meisei Chemical Works
- 11.2.3.1. Overview
- 11.2.3.2. Products
- 11.2.3.3. SWOT Analysis
- 11.2.3.4. Recent Developments
- 11.2.3.5. Financials (Based on Availability)
- 11.2.4 Shanghai Liansheng Chemical
- 11.2.4.1. Overview
- 11.2.4.2. Products
- 11.2.4.3. SWOT Analysis
- 11.2.4.4. Recent Developments
- 11.2.4.5. Financials (Based on Availability)
- 11.2.5 Jilin Xingyun Chemical
- 11.2.5.1. Overview
- 11.2.5.2. Products
- 11.2.5.3. SWOT Analysis
- 11.2.5.4. Recent Developments
- 11.2.5.5. Financials (Based on Availability)
- 11.2.6 Zibo Kaixin
- 11.2.6.1. Overview
- 11.2.6.2. Products
- 11.2.6.3. SWOT Analysis
- 11.2.6.4. Recent Developments
- 11.2.6.5. Financials (Based on Availability)
- 11.2.7 Dow Chemical
- 11.2.7.1. Overview
- 11.2.7.2. Products
- 11.2.7.3. SWOT Analysis
- 11.2.7.4. Recent Developments
- 11.2.7.5. Financials (Based on Availability)
- 11.2.8 Ineos
- 11.2.8.1. Overview
- 11.2.8.2. Products
- 11.2.8.3. SWOT Analysis
- 11.2.8.4. Recent Developments
- 11.2.8.5. Financials (Based on Availability)
- 11.2.9 BASF
- 11.2.9.1. Overview
- 11.2.9.2. Products
- 11.2.9.3. SWOT Analysis
- 11.2.9.4. Recent Developments
- 11.2.9.5. Financials (Based on Availability)
- 11.2.10 Kao
- 11.2.10.1. Overview
- 11.2.10.2. Products
- 11.2.10.3. SWOT Analysis
- 11.2.10.4. Recent Developments
- 11.2.10.5. Financials (Based on Availability)
- 11.2.11 Blaunon
- 11.2.11.1. Overview
- 11.2.11.2. Products
- 11.2.11.3. SWOT Analysis
- 11.2.11.4. Recent Developments
- 11.2.11.5. Financials (Based on Availability)
- 11.2.12 Clariant
- 11.2.12.1. Overview
- 11.2.12.2. Products
- 11.2.12.3. SWOT Analysis
- 11.2.12.4. Recent Developments
- 11.2.12.5. Financials (Based on Availability)
- 11.2.13 PCC Group
- 11.2.13.1. Overview
- 11.2.13.2. Products
- 11.2.13.3. SWOT Analysis
- 11.2.13.4. Recent Developments
- 11.2.13.5. Financials (Based on Availability)
- 11.2.14 Norchem
- 11.2.14.1. Overview
- 11.2.14.2. Products
- 11.2.14.3. SWOT Analysis
- 11.2.14.4. Recent Developments
- 11.2.14.5. Financials (Based on Availability)
- 11.2.15 Indorama(Oxiteno)
- 11.2.15.1. Overview
- 11.2.15.2. Products
- 11.2.15.3. SWOT Analysis
- 11.2.15.4. Recent Developments
- 11.2.15.5. Financials (Based on Availability)
- 11.2.16 Lotte Chemical
- 11.2.16.1. Overview
- 11.2.16.2. Products
- 11.2.16.3. SWOT Analysis
- 11.2.16.4. Recent Developments
- 11.2.16.5. Financials (Based on Availability)
- 11.2.17 Sanyo Chemical
- 11.2.17.1. Overview
- 11.2.17.2. Products
- 11.2.17.3. SWOT Analysis
- 11.2.17.4. Recent Developments
- 11.2.17.5. Financials (Based on Availability)
- 11.2.18 India Glycols
- 11.2.18.1. Overview
- 11.2.18.2. Products
- 11.2.18.3. SWOT Analysis
- 11.2.18.4. Recent Developments
- 11.2.18.5. Financials (Based on Availability)
- 11.2.19 Petronas Chemicals
- 11.2.19.1. Overview
- 11.2.19.2. Products
- 11.2.19.3. SWOT Analysis
- 11.2.19.4. Recent Developments
- 11.2.19.5. Financials (Based on Availability)
- 11.2.20 Huntsman
- 11.2.20.1. Overview
- 11.2.20.2. Products
- 11.2.20.3. SWOT Analysis
- 11.2.20.4. Recent Developments
- 11.2.20.5. Financials (Based on Availability)
- 11.2.21 Sasol
- 11.2.21.1. Overview
- 11.2.21.2. Products
- 11.2.21.3. SWOT Analysis
- 11.2.21.4. Recent Developments
- 11.2.21.5. Financials (Based on Availability)
- 11.2.22 Polioles
- 11.2.22.1. Overview
- 11.2.22.2. Products
- 11.2.22.3. SWOT Analysis
- 11.2.22.4. Recent Developments
- 11.2.22.5. Financials (Based on Availability)
- 11.2.23 Liaoning Oxiranchem
- 11.2.23.1. Overview
- 11.2.23.2. Products
- 11.2.23.3. SWOT Analysis
- 11.2.23.4. Recent Developments
- 11.2.23.5. Financials (Based on Availability)
- 11.2.24 Jiangsu Haian
- 11.2.24.1. Overview
- 11.2.24.2. Products
- 11.2.24.3. SWOT Analysis
- 11.2.24.4. Recent Developments
- 11.2.24.5. Financials (Based on Availability)
- 11.2.25 Croda
- 11.2.25.1. Overview
- 11.2.25.2. Products
- 11.2.25.3. SWOT Analysis
- 11.2.25.4. Recent Developments
- 11.2.25.5. Financials (Based on Availability)
- 11.2.26 Shandong Ruisheng
- 11.2.26.1. Overview
- 11.2.26.2. Products
- 11.2.26.3. SWOT Analysis
- 11.2.26.4. Recent Developments
- 11.2.26.5. Financials (Based on Availability)
- 11.2.1 IFF (DuPont)
List of Figures
- Figure 1: Global PEG and PEO Revenue Breakdown (million, %) by Region 2024 & 2032
- Figure 2: North America PEG and PEO Revenue (million), by Application 2024 & 2032
- Figure 3: North America PEG and PEO Revenue Share (%), by Application 2024 & 2032
- Figure 4: North America PEG and PEO Revenue (million), by Types 2024 & 2032
- Figure 5: North America PEG and PEO Revenue Share (%), by Types 2024 & 2032
- Figure 6: North America PEG and PEO Revenue (million), by Country 2024 & 2032
- Figure 7: North America PEG and PEO Revenue Share (%), by Country 2024 & 2032
- Figure 8: South America PEG and PEO Revenue (million), by Application 2024 & 2032
- Figure 9: South America PEG and PEO Revenue Share (%), by Application 2024 & 2032
- Figure 10: South America PEG and PEO Revenue (million), by Types 2024 & 2032
- Figure 11: South America PEG and PEO Revenue Share (%), by Types 2024 & 2032
- Figure 12: South America PEG and PEO Revenue (million), by Country 2024 & 2032
- Figure 13: South America PEG and PEO Revenue Share (%), by Country 2024 & 2032
- Figure 14: Europe PEG and PEO Revenue (million), by Application 2024 & 2032
- Figure 15: Europe PEG and PEO Revenue Share (%), by Application 2024 & 2032
- Figure 16: Europe PEG and PEO Revenue (million), by Types 2024 & 2032
- Figure 17: Europe PEG and PEO Revenue Share (%), by Types 2024 & 2032
- Figure 18: Europe PEG and PEO Revenue (million), by Country 2024 & 2032
- Figure 19: Europe PEG and PEO Revenue Share (%), by Country 2024 & 2032
- Figure 20: Middle East & Africa PEG and PEO Revenue (million), by Application 2024 & 2032
- Figure 21: Middle East & Africa PEG and PEO Revenue Share (%), by Application 2024 & 2032
- Figure 22: Middle East & Africa PEG and PEO Revenue (million), by Types 2024 & 2032
- Figure 23: Middle East & Africa PEG and PEO Revenue Share (%), by Types 2024 & 2032
- Figure 24: Middle East & Africa PEG and PEO Revenue (million), by Country 2024 & 2032
- Figure 25: Middle East & Africa PEG and PEO Revenue Share (%), by Country 2024 & 2032
- Figure 26: Asia Pacific PEG and PEO Revenue (million), by Application 2024 & 2032
- Figure 27: Asia Pacific PEG and PEO Revenue Share (%), by Application 2024 & 2032
- Figure 28: Asia Pacific PEG and PEO Revenue (million), by Types 2024 & 2032
- Figure 29: Asia Pacific PEG and PEO Revenue Share (%), by Types 2024 & 2032
- Figure 30: Asia Pacific PEG and PEO Revenue (million), by Country 2024 & 2032
- Figure 31: Asia Pacific PEG and PEO Revenue Share (%), by Country 2024 & 2032
List of Tables
- Table 1: Global PEG and PEO Revenue million Forecast, by Region 2019 & 2032
- Table 2: Global PEG and PEO Revenue million Forecast, by Application 2019 & 2032
- Table 3: Global PEG and PEO Revenue million Forecast, by Types 2019 & 2032
- Table 4: Global PEG and PEO Revenue million Forecast, by Region 2019 & 2032
- Table 5: Global PEG and PEO Revenue million Forecast, by Application 2019 & 2032
- Table 6: Global PEG and PEO Revenue million Forecast, by Types 2019 & 2032
- Table 7: Global PEG and PEO Revenue million Forecast, by Country 2019 & 2032
- Table 8: United States PEG and PEO Revenue (million) Forecast, by Application 2019 & 2032
- Table 9: Canada PEG and PEO Revenue (million) Forecast, by Application 2019 & 2032
- Table 10: Mexico PEG and PEO Revenue (million) Forecast, by Application 2019 & 2032
- Table 11: Global PEG and PEO Revenue million Forecast, by Application 2019 & 2032
- Table 12: Global PEG and PEO Revenue million Forecast, by Types 2019 & 2032
- Table 13: Global PEG and PEO Revenue million Forecast, by Country 2019 & 2032
- Table 14: Brazil PEG and PEO Revenue (million) Forecast, by Application 2019 & 2032
- Table 15: Argentina PEG and PEO Revenue (million) Forecast, by Application 2019 & 2032
- Table 16: Rest of South America PEG and PEO Revenue (million) Forecast, by Application 2019 & 2032
- Table 17: Global PEG and PEO Revenue million Forecast, by Application 2019 & 2032
- Table 18: Global PEG and PEO Revenue million Forecast, by Types 2019 & 2032
- Table 19: Global PEG and PEO Revenue million Forecast, by Country 2019 & 2032
- Table 20: United Kingdom PEG and PEO Revenue (million) Forecast, by Application 2019 & 2032
- Table 21: Germany PEG and PEO Revenue (million) Forecast, by Application 2019 & 2032
- Table 22: France PEG and PEO Revenue (million) Forecast, by Application 2019 & 2032
- Table 23: Italy PEG and PEO Revenue (million) Forecast, by Application 2019 & 2032
- Table 24: Spain PEG and PEO Revenue (million) Forecast, by Application 2019 & 2032
- Table 25: Russia PEG and PEO Revenue (million) Forecast, by Application 2019 & 2032
- Table 26: Benelux PEG and PEO Revenue (million) Forecast, by Application 2019 & 2032
- Table 27: Nordics PEG and PEO Revenue (million) Forecast, by Application 2019 & 2032
- Table 28: Rest of Europe PEG and PEO Revenue (million) Forecast, by Application 2019 & 2032
- Table 29: Global PEG and PEO Revenue million Forecast, by Application 2019 & 2032
- Table 30: Global PEG and PEO Revenue million Forecast, by Types 2019 & 2032
- Table 31: Global PEG and PEO Revenue million Forecast, by Country 2019 & 2032
- Table 32: Turkey PEG and PEO Revenue (million) Forecast, by Application 2019 & 2032
- Table 33: Israel PEG and PEO Revenue (million) Forecast, by Application 2019 & 2032
- Table 34: GCC PEG and PEO Revenue (million) Forecast, by Application 2019 & 2032
- Table 35: North Africa PEG and PEO Revenue (million) Forecast, by Application 2019 & 2032
- Table 36: South Africa PEG and PEO Revenue (million) Forecast, by Application 2019 & 2032
- Table 37: Rest of Middle East & Africa PEG and PEO Revenue (million) Forecast, by Application 2019 & 2032
- Table 38: Global PEG and PEO Revenue million Forecast, by Application 2019 & 2032
- Table 39: Global PEG and PEO Revenue million Forecast, by Types 2019 & 2032
- Table 40: Global PEG and PEO Revenue million Forecast, by Country 2019 & 2032
- Table 41: China PEG and PEO Revenue (million) Forecast, by Application 2019 & 2032
- Table 42: India PEG and PEO Revenue (million) Forecast, by Application 2019 & 2032
- Table 43: Japan PEG and PEO Revenue (million) Forecast, by Application 2019 & 2032
- Table 44: South Korea PEG and PEO Revenue (million) Forecast, by Application 2019 & 2032
- Table 45: ASEAN PEG and PEO Revenue (million) Forecast, by Application 2019 & 2032
- Table 46: Oceania PEG and PEO Revenue (million) Forecast, by Application 2019 & 2032
- Table 47: Rest of Asia Pacific PEG and PEO Revenue (million) Forecast, by Application 2019 & 2032
Frequently Asked Questions
1. What is the projected Compound Annual Growth Rate (CAGR) of the PEG and PEO?
The projected CAGR is approximately XX%.
2. Which companies are prominent players in the PEG and PEO?
Key companies in the market include IFF (DuPont), Sumitomo Seika, Meisei Chemical Works, Shanghai Liansheng Chemical, Jilin Xingyun Chemical, Zibo Kaixin, Dow Chemical, Ineos, BASF, Kao, Blaunon, Clariant, PCC Group, Norchem, Indorama(Oxiteno), Lotte Chemical, Sanyo Chemical, India Glycols, Petronas Chemicals, Huntsman, Sasol, Polioles, Liaoning Oxiranchem, Jiangsu Haian, Croda, Shandong Ruisheng.
3. What are the main segments of the PEG and PEO?
The market segments include Application, Types.
4. Can you provide details about the market size?
The market size is estimated to be USD XXX million as of 2022.
5. What are some drivers contributing to market growth?
N/A
6. What are the notable trends driving market growth?
N/A
7. Are there any restraints impacting market growth?
N/A
8. Can you provide examples of recent developments in the market?
N/A
9. What pricing options are available for accessing the report?
Pricing options include single-user, multi-user, and enterprise licenses priced at USD 4900.00, USD 7350.00, and USD 9800.00 respectively.
10. Is the market size provided in terms of value or volume?
The market size is provided in terms of value, measured in million.
11. Are there any specific market keywords associated with the report?
Yes, the market keyword associated with the report is "PEG and PEO," which aids in identifying and referencing the specific market segment covered.
12. How do I determine which pricing option suits my needs best?
The pricing options vary based on user requirements and access needs. Individual users may opt for single-user licenses, while businesses requiring broader access may choose multi-user or enterprise licenses for cost-effective access to the report.
13. Are there any additional resources or data provided in the PEG and PEO report?
While the report offers comprehensive insights, it's advisable to review the specific contents or supplementary materials provided to ascertain if additional resources or data are available.
14. How can I stay updated on further developments or reports in the PEG and PEO?
To stay informed about further developments, trends, and reports in the PEG and PEO, consider subscribing to industry newsletters, following relevant companies and organizations, or regularly checking reputable industry news sources and publications.
Methodology
Step 1 - Identification of Relevant Samples Size from Population Database


Step 2 - Approaches for Defining Global Market Size (Value, Volume* & Price*)

Note*: In applicable scenarios
Step 3 - Data Sources
Primary Research
- Web Analytics
- Survey Reports
- Research Institute
- Latest Research Reports
- Opinion Leaders
Secondary Research
- Annual Reports
- White Paper
- Latest Press Release
- Industry Association
- Paid Database
- Investor Presentations

Step 4 - Data Triangulation
Involves using different sources of information in order to increase the validity of a study
These sources are likely to be stakeholders in a program - participants, other researchers, program staff, other community members, and so on.
Then we put all data in single framework & apply various statistical tools to find out the dynamic on the market.
During the analysis stage, feedback from the stakeholder groups would be compared to determine areas of agreement as well as areas of divergence


