
Key Insights
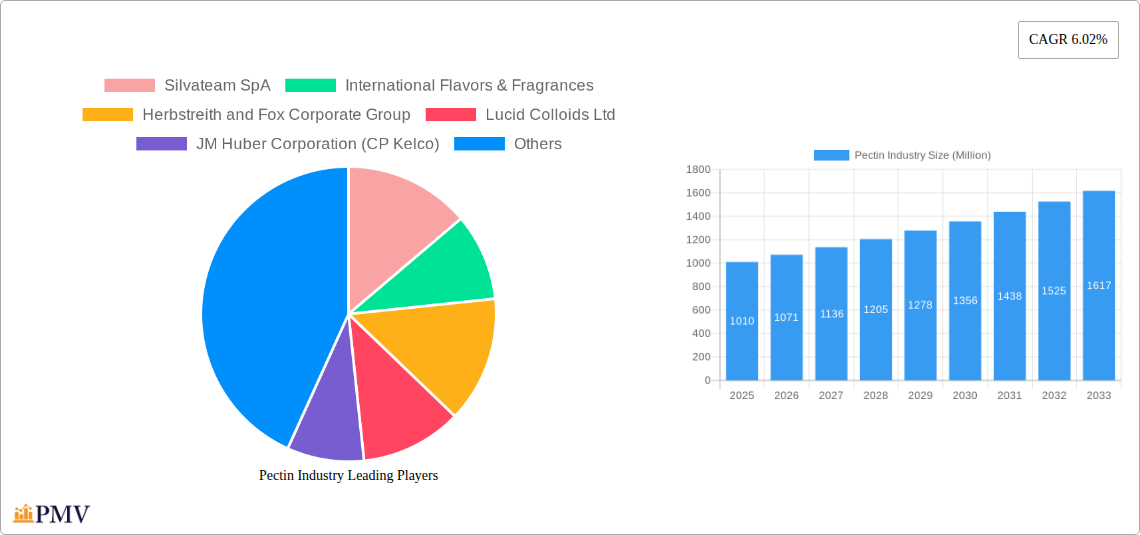
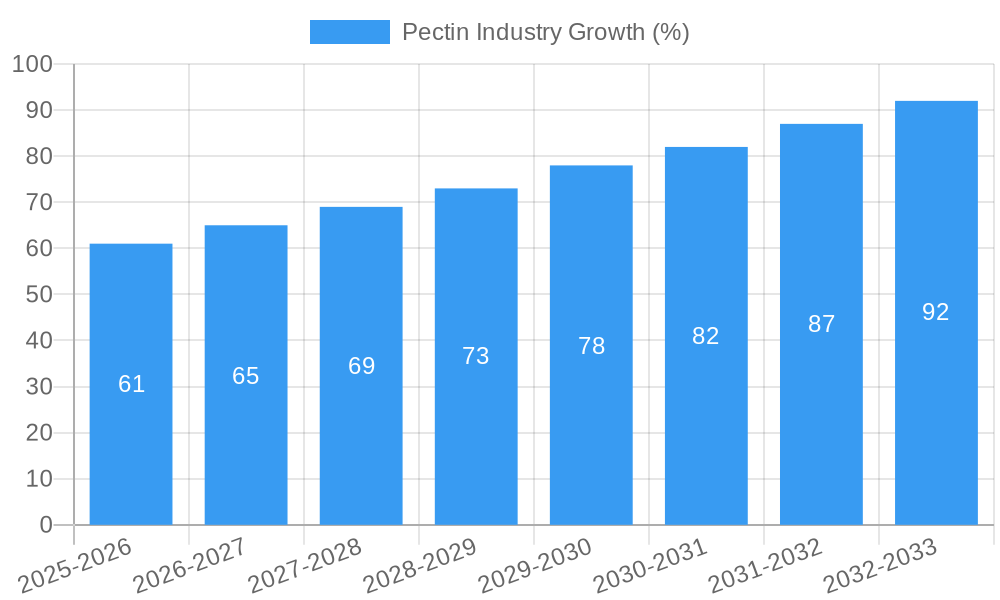
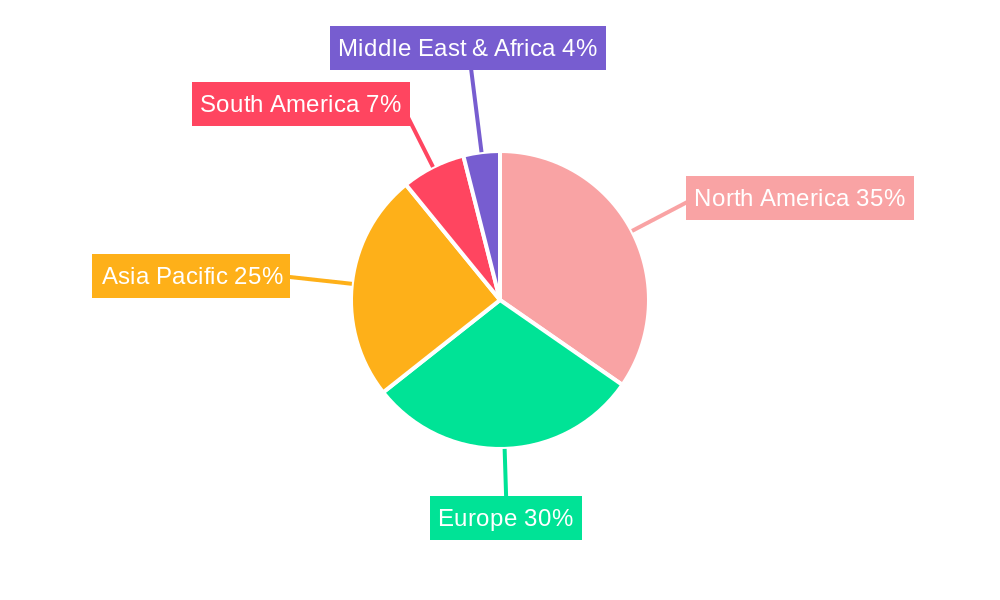
The global pectin market, valued at $1.01 billion in 2025, is projected to experience robust growth, driven by increasing demand from the food and beverage industry, particularly in the production of jams, jellies, and confectionery. The rising consumer preference for natural and clean-label ingredients further fuels this expansion. High-methoxyl pectin, owing to its superior gelling properties, currently dominates the market by type, but low-methoxyl pectin is witnessing significant growth due to its applications in low-sugar and healthier food products. Citrus fruits remain the primary pectin source, although sugar beet and apple-based pectin are gaining traction due to their sustainability and functional benefits. The beauty and personal care sector also presents a promising avenue for pectin applications, leveraging its thickening and stabilizing properties in skincare and haircare products. Geographic expansion is notable, with North America and Europe currently holding substantial market shares, but the Asia-Pacific region exhibits the fastest growth, fueled by increasing disposable incomes and changing dietary habits. While challenges exist, such as price fluctuations in raw materials and potential supply chain disruptions, the overall market outlook for pectin remains positive, projecting a Compound Annual Growth Rate (CAGR) of 6.02% from 2025 to 2033.
The competitive landscape is characterized by a mix of large multinational corporations and specialized pectin producers. Key players are strategically investing in research and development to enhance pectin functionality and expand into new application areas. Furthermore, the growing emphasis on sustainable sourcing and production methods is shaping the industry, driving the adoption of eco-friendly extraction techniques and responsible sourcing practices. Market segmentation by application (food and beverage, pharmaceuticals, beauty and personal care) allows for targeted marketing and product development strategies. Future growth hinges on successful innovation, strategic partnerships, and catering to evolving consumer demands for healthier and more sustainable food and personal care products. The market's ongoing growth underscores pectin's versatile role as a crucial ingredient across various industries.
Pectin Industry Market Report: 2019-2033
This comprehensive report provides an in-depth analysis of the global pectin industry, offering valuable insights for stakeholders across the value chain. With a study period spanning 2019-2033, a base year of 2025, and a forecast period of 2025-2033, this report utilizes rigorous data analysis to provide a clear picture of market dynamics, growth drivers, and future trends. The market size is estimated at xx Million in 2025.
Pectin Industry Market Structure & Competitive Dynamics
The global pectin market is moderately concentrated, with several major players holding significant market share. Key competitors include Silvateam SpA, International Flavors & Fragrances (IFF), Herbstreith and Fox Corporate Group, Lucid Colloids Ltd, JM Huber Corporation (CP Kelco), Cargill Incorporated (Cargill), Pacific Pectin Inc, Foodchem International Corporation, Ingredion Incorporated (Ingredion), and Royal DSM (DSM). However, the presence of numerous smaller regional players fosters competition.
The industry is characterized by a dynamic innovation ecosystem, with ongoing research and development focused on improving pectin extraction methods, enhancing product functionalities (e.g., improved gelling properties, increased stability), and expanding applications. Regulatory frameworks, particularly those related to food safety and labeling, significantly impact market operations. Product substitutes, such as other gelling agents (e.g., agar-agar, carrageenan), pose competitive challenges, especially in cost-sensitive segments. End-user trends toward healthier and more natural food products drive demand for pectin, while M&A activities are shaping the market landscape. Recent deals have involved (estimated values in Million): xx Million for Company A acquiring Company B, and xx Million for Company C's acquisition by Company D (Specific deal values are unavailable for public disclosure for most acquisitions in this industry). Market share data suggests that the top 5 players hold approximately 70% of the global market share in 2025, with the remaining share distributed among smaller companies.
Pectin Industry Trends & Insights
The global pectin market is projected to experience substantial growth during the forecast period (2025-2033), with a compound annual growth rate (CAGR) estimated at xx%. This growth is driven by several factors including the increasing demand for functional foods and beverages, growing health consciousness among consumers, and the rising popularity of processed foods. Technological advancements in pectin extraction and modification techniques are also contributing to market expansion.
Consumer preferences are shifting towards natural and clean-label ingredients, creating opportunities for pectin producers that emphasize sustainability and transparency in their supply chains. The market penetration of pectin in various applications, particularly in the food and beverage sector, is high and is expected to continue growing, particularly in developing economies. However, fluctuations in raw material prices and supply chain disruptions pose significant challenges. Competitive dynamics, including product innovation, brand building, and pricing strategies, are playing a crucial role in shaping market share. The rising demand for plant-based alternatives and the growing interest in customized functionalities are pushing manufacturers to develop more specialized pectin products with enhanced properties.
Dominant Markets & Segments in Pectin Industry
The food and beverage segment dominates the pectin market, accounting for the largest revenue share in 2025. Within this segment, the demand for pectin in jams, jellies, and fruit preparations is particularly strong. Other applications include pharmaceuticals, beauty and personal care, and industrial applications, with significant regional variations in market dominance.
- By Region: Europe is currently the leading region due to high consumption and established production capabilities.
- By Type: High methoxyl pectin (HMP) holds a larger market share than low methoxyl pectin (LMP), driven by its wide applications in various food products.
- By Source: Citrus fruits are the primary source of pectin globally, offering cost-effectiveness and readily available supply.
- By Application: Food and beverage applications are the key revenue driver, while the beauty and personal care segment is experiencing growth fueled by increasing demand for natural ingredients in cosmetic products.
Key drivers behind market dominance include factors like established infrastructure, favorable economic policies supporting food processing industries, and a strong preference for traditional food products utilizing pectin. The mature European market is expected to see stable growth, driven by the growing demand for healthier and convenient food items. In contrast, developing economies are likely to exhibit faster growth rates due to the expanding processed food industry and rising consumer income.
Pectin Industry Product Innovations
Recent innovations in the pectin industry focus on developing pectin with improved functionality, such as enhanced gelling properties, better stability, and improved texture. Companies are actively developing new pectin types tailored to specific applications, resulting in wider adoption across diverse industries. For instance, the launch of Grindsted Pectin FB 420 by IFF and Cargill's Unipectine LMCplus range showcase a trend towards specialized pectins catering to the demand for label-friendly, high-performing ingredients. These innovations are driven by technological advancements in extraction and modification processes, contributing to the expansion of pectin applications beyond traditional food sectors.
Report Segmentation & Scope
This report segments the pectin market based on type (High Methoxyl Pectin, Low Methoxyl Pectin), source (Citrus Fruits, Sugar Beet, Apple, Other Sources), and application (Food and Beverage, Pharmaceuticals, Beauty and Personal Care, Other Applications). Each segment is analyzed in detail, providing market size estimations, growth projections, and competitive dynamics. Growth projections vary across segments, with the Food and Beverage sector expected to continue its dominance. The market size for each segment is projected to reach xx Million by 2033. Competitive dynamics within each segment depend on factors such as product innovation, brand recognition, and pricing strategies.
Key Drivers of Pectin Industry Growth
Several key factors drive the growth of the pectin industry. The rising global demand for processed food, particularly convenience foods, fuels the need for gelling agents like pectin. Increased health consciousness and the growing preference for natural and clean-label ingredients are driving demand. Technological advancements in pectin extraction and modification processes are making it more efficient and cost-effective to produce pectin with desired characteristics. Stringent food safety regulations have spurred the development of high-quality, standardized pectin products. Finally, the increasing use of pectin in the pharmaceutical and cosmetic industries also contributes to market growth.
Challenges in the Pectin Industry Sector
The pectin industry faces several challenges. Fluctuations in raw material prices, particularly citrus fruits, impact production costs and profitability. Supply chain disruptions can affect the timely delivery of pectin to customers, potentially leading to production delays. The competitive landscape, with many players vying for market share, requires companies to constantly innovate and differentiate their products. Stringent regulatory requirements related to food safety and labeling necessitate substantial investment in compliance and quality control. These factors can restrain overall industry growth to an extent.
Leading Players in the Pectin Industry Market
- Silvateam SpA
- International Flavors & Fragrances (IFF)
- Herbstreith and Fox Corporate Group
- Lucid Colloids Ltd
- JM Huber Corporation (CP Kelco)
- Cargill Incorporated (Cargill)
- Pacific Pectin Inc
- Foodchem International Corporation
- Ingredion Incorporated (Ingredion)
- Royal DSM (DSM)
Key Developments in Pectin Industry Sector
- September 2023: Cargill introduced a line of LM conventional (LMC) pectins, expanding its product portfolio and catering to the growing demand for organic and conventional options.
- December 2023: Herbstreith & Fox GmbH & Co. KG established H&F Italy SRL, strengthening its presence in the Italian market.
- January 2024: IFF launched Grindsted Pectin FB 420, a specialized pectin for baking applications with enhanced sensory qualities and improved processing efficiency.
Strategic Pectin Industry Market Outlook
The pectin industry is poised for sustained growth, driven by the continued demand for functional foods and the increasing preference for natural ingredients. Strategic opportunities lie in developing innovative pectin products with tailored functionalities and exploring new applications beyond traditional sectors. Companies that focus on sustainability, supply chain optimization, and product differentiation are expected to gain a competitive edge. The market’s future potential is substantial, especially in regions with growing populations and rising disposable incomes. The focus on clean label and functional ingredients will continue to shape market trends.
Pectin Industry Segmentation
-
1. Source
- 1.1. Citrus Fruits
- 1.2. Sugar Beet
- 1.3. Apple
- 1.4. Other Sources
-
2. Application
- 2.1. Beauty and Personal Care
-
2.2. Food and Beverage
- 2.2.1. Jam, Jelly, and Preserve
- 2.2.2. Baked Goods
- 2.2.3. Dairy Products
- 2.2.4. Other Foods and Beverages
- 2.3. Pharmaceuticals
-
2.4. Other Applications
- 2.4.1. Edible Films and Coatings
- 2.4.2. Paper Substitutes
- 2.4.3. Foams and Plasticizers
-
3. Type
- 3.1. High Methoxyl Pectin
- 3.2. Low Methoxyl Pectin
Pectin Industry Segmentation By Geography
-
1. North America
- 1.1. United States
- 1.2. Canada
- 1.3. Mexico
- 1.4. Rest of North America
-
2. Europe
- 2.1. United Kingdom
- 2.2. Germany
- 2.3. France
- 2.4. Russia
- 2.5. Italy
- 2.6. Spain
- 2.7. Rest of Europe
-
3. Asia Pacific
- 3.1. India
- 3.2. China
- 3.3. Japan
- 3.4. Australia
- 3.5. Rest of Asia Pacific
-
4. South America
- 4.1. Brazil
- 4.2. Argentina
- 4.3. Rest of South America
- 5. Middle East
-
6. South Africa
- 6.1. Saudi Arabia
- 6.2. Rest of Middle East
Pectin Industry REPORT HIGHLIGHTS
| Aspects | Details |
|---|---|
| Study Period | 2019-2033 |
| Base Year | 2024 |
| Estimated Year | 2025 |
| Forecast Period | 2025-2033 |
| Historical Period | 2019-2024 |
| Growth Rate | CAGR of 6.02% from 2019-2033 |
| Segmentation |
|
Table of Contents
- 1. Introduction
- 1.1. Research Scope
- 1.2. Market Segmentation
- 1.3. Research Methodology
- 1.4. Definitions and Assumptions
- 2. Executive Summary
- 2.1. Introduction
- 3. Market Dynamics
- 3.1. Introduction
- 3.2. Market Drivers
- 3.2.1. Demand for Natural and Clean-label Ingredients; Rising Consumption of Packaged Food Products
- 3.3. Market Restrains
- 3.3.1. Availability of Economically Feasible Alternatives
- 3.4. Market Trends
- 3.4.1. Demand for Natural and Clean Label Ingredients
- 4. Market Factor Analysis
- 4.1. Porters Five Forces
- 4.2. Supply/Value Chain
- 4.3. PESTEL analysis
- 4.4. Market Entropy
- 4.5. Patent/Trademark Analysis
- 5. Global Pectin Industry Analysis, Insights and Forecast, 2019-2031
- 5.1. Market Analysis, Insights and Forecast - by Source
- 5.1.1. Citrus Fruits
- 5.1.2. Sugar Beet
- 5.1.3. Apple
- 5.1.4. Other Sources
- 5.2. Market Analysis, Insights and Forecast - by Application
- 5.2.1. Beauty and Personal Care
- 5.2.2. Food and Beverage
- 5.2.2.1. Jam, Jelly, and Preserve
- 5.2.2.2. Baked Goods
- 5.2.2.3. Dairy Products
- 5.2.2.4. Other Foods and Beverages
- 5.2.3. Pharmaceuticals
- 5.2.4. Other Applications
- 5.2.4.1. Edible Films and Coatings
- 5.2.4.2. Paper Substitutes
- 5.2.4.3. Foams and Plasticizers
- 5.3. Market Analysis, Insights and Forecast - by Type
- 5.3.1. High Methoxyl Pectin
- 5.3.2. Low Methoxyl Pectin
- 5.4. Market Analysis, Insights and Forecast - by Region
- 5.4.1. North America
- 5.4.2. Europe
- 5.4.3. Asia Pacific
- 5.4.4. South America
- 5.4.5. Middle East
- 5.4.6. South Africa
- 5.1. Market Analysis, Insights and Forecast - by Source
- 6. North America Pectin Industry Analysis, Insights and Forecast, 2019-2031
- 6.1. Market Analysis, Insights and Forecast - by Source
- 6.1.1. Citrus Fruits
- 6.1.2. Sugar Beet
- 6.1.3. Apple
- 6.1.4. Other Sources
- 6.2. Market Analysis, Insights and Forecast - by Application
- 6.2.1. Beauty and Personal Care
- 6.2.2. Food and Beverage
- 6.2.2.1. Jam, Jelly, and Preserve
- 6.2.2.2. Baked Goods
- 6.2.2.3. Dairy Products
- 6.2.2.4. Other Foods and Beverages
- 6.2.3. Pharmaceuticals
- 6.2.4. Other Applications
- 6.2.4.1. Edible Films and Coatings
- 6.2.4.2. Paper Substitutes
- 6.2.4.3. Foams and Plasticizers
- 6.3. Market Analysis, Insights and Forecast - by Type
- 6.3.1. High Methoxyl Pectin
- 6.3.2. Low Methoxyl Pectin
- 6.1. Market Analysis, Insights and Forecast - by Source
- 7. Europe Pectin Industry Analysis, Insights and Forecast, 2019-2031
- 7.1. Market Analysis, Insights and Forecast - by Source
- 7.1.1. Citrus Fruits
- 7.1.2. Sugar Beet
- 7.1.3. Apple
- 7.1.4. Other Sources
- 7.2. Market Analysis, Insights and Forecast - by Application
- 7.2.1. Beauty and Personal Care
- 7.2.2. Food and Beverage
- 7.2.2.1. Jam, Jelly, and Preserve
- 7.2.2.2. Baked Goods
- 7.2.2.3. Dairy Products
- 7.2.2.4. Other Foods and Beverages
- 7.2.3. Pharmaceuticals
- 7.2.4. Other Applications
- 7.2.4.1. Edible Films and Coatings
- 7.2.4.2. Paper Substitutes
- 7.2.4.3. Foams and Plasticizers
- 7.3. Market Analysis, Insights and Forecast - by Type
- 7.3.1. High Methoxyl Pectin
- 7.3.2. Low Methoxyl Pectin
- 7.1. Market Analysis, Insights and Forecast - by Source
- 8. Asia Pacific Pectin Industry Analysis, Insights and Forecast, 2019-2031
- 8.1. Market Analysis, Insights and Forecast - by Source
- 8.1.1. Citrus Fruits
- 8.1.2. Sugar Beet
- 8.1.3. Apple
- 8.1.4. Other Sources
- 8.2. Market Analysis, Insights and Forecast - by Application
- 8.2.1. Beauty and Personal Care
- 8.2.2. Food and Beverage
- 8.2.2.1. Jam, Jelly, and Preserve
- 8.2.2.2. Baked Goods
- 8.2.2.3. Dairy Products
- 8.2.2.4. Other Foods and Beverages
- 8.2.3. Pharmaceuticals
- 8.2.4. Other Applications
- 8.2.4.1. Edible Films and Coatings
- 8.2.4.2. Paper Substitutes
- 8.2.4.3. Foams and Plasticizers
- 8.3. Market Analysis, Insights and Forecast - by Type
- 8.3.1. High Methoxyl Pectin
- 8.3.2. Low Methoxyl Pectin
- 8.1. Market Analysis, Insights and Forecast - by Source
- 9. South America Pectin Industry Analysis, Insights and Forecast, 2019-2031
- 9.1. Market Analysis, Insights and Forecast - by Source
- 9.1.1. Citrus Fruits
- 9.1.2. Sugar Beet
- 9.1.3. Apple
- 9.1.4. Other Sources
- 9.2. Market Analysis, Insights and Forecast - by Application
- 9.2.1. Beauty and Personal Care
- 9.2.2. Food and Beverage
- 9.2.2.1. Jam, Jelly, and Preserve
- 9.2.2.2. Baked Goods
- 9.2.2.3. Dairy Products
- 9.2.2.4. Other Foods and Beverages
- 9.2.3. Pharmaceuticals
- 9.2.4. Other Applications
- 9.2.4.1. Edible Films and Coatings
- 9.2.4.2. Paper Substitutes
- 9.2.4.3. Foams and Plasticizers
- 9.3. Market Analysis, Insights and Forecast - by Type
- 9.3.1. High Methoxyl Pectin
- 9.3.2. Low Methoxyl Pectin
- 9.1. Market Analysis, Insights and Forecast - by Source
- 10. Middle East Pectin Industry Analysis, Insights and Forecast, 2019-2031
- 10.1. Market Analysis, Insights and Forecast - by Source
- 10.1.1. Citrus Fruits
- 10.1.2. Sugar Beet
- 10.1.3. Apple
- 10.1.4. Other Sources
- 10.2. Market Analysis, Insights and Forecast - by Application
- 10.2.1. Beauty and Personal Care
- 10.2.2. Food and Beverage
- 10.2.2.1. Jam, Jelly, and Preserve
- 10.2.2.2. Baked Goods
- 10.2.2.3. Dairy Products
- 10.2.2.4. Other Foods and Beverages
- 10.2.3. Pharmaceuticals
- 10.2.4. Other Applications
- 10.2.4.1. Edible Films and Coatings
- 10.2.4.2. Paper Substitutes
- 10.2.4.3. Foams and Plasticizers
- 10.3. Market Analysis, Insights and Forecast - by Type
- 10.3.1. High Methoxyl Pectin
- 10.3.2. Low Methoxyl Pectin
- 10.1. Market Analysis, Insights and Forecast - by Source
- 11. South Africa Pectin Industry Analysis, Insights and Forecast, 2019-2031
- 11.1. Market Analysis, Insights and Forecast - by Source
- 11.1.1. Citrus Fruits
- 11.1.2. Sugar Beet
- 11.1.3. Apple
- 11.1.4. Other Sources
- 11.2. Market Analysis, Insights and Forecast - by Application
- 11.2.1. Beauty and Personal Care
- 11.2.2. Food and Beverage
- 11.2.2.1. Jam, Jelly, and Preserve
- 11.2.2.2. Baked Goods
- 11.2.2.3. Dairy Products
- 11.2.2.4. Other Foods and Beverages
- 11.2.3. Pharmaceuticals
- 11.2.4. Other Applications
- 11.2.4.1. Edible Films and Coatings
- 11.2.4.2. Paper Substitutes
- 11.2.4.3. Foams and Plasticizers
- 11.3. Market Analysis, Insights and Forecast - by Type
- 11.3.1. High Methoxyl Pectin
- 11.3.2. Low Methoxyl Pectin
- 11.1. Market Analysis, Insights and Forecast - by Source
- 12. North America Pectin Industry Analysis, Insights and Forecast, 2019-2031
- 12.1. Market Analysis, Insights and Forecast - By Country/Sub-region
- 12.1.1 United States
- 12.1.2 Canada
- 12.1.3 Mexico
- 12.1.4 Rest of North America
- 13. Europe Pectin Industry Analysis, Insights and Forecast, 2019-2031
- 13.1. Market Analysis, Insights and Forecast - By Country/Sub-region
- 13.1.1 United Kingdom
- 13.1.2 Germany
- 13.1.3 France
- 13.1.4 Russia
- 13.1.5 Italy
- 13.1.6 Spain
- 13.1.7 Rest of Europe
- 14. Asia Pacific Pectin Industry Analysis, Insights and Forecast, 2019-2031
- 14.1. Market Analysis, Insights and Forecast - By Country/Sub-region
- 14.1.1 India
- 14.1.2 China
- 14.1.3 Japan
- 14.1.4 Australia
- 14.1.5 Rest of Asia Pacific
- 15. South America Pectin Industry Analysis, Insights and Forecast, 2019-2031
- 15.1. Market Analysis, Insights and Forecast - By Country/Sub-region
- 15.1.1 Brazil
- 15.1.2 Argentina
- 15.1.3 Rest of South America
- 16. Middle East & Africa Pectin Industry Analysis, Insights and Forecast, 2019-2031
- 16.1. Market Analysis, Insights and Forecast - By Country/Sub-region
- 16.1.1 UAE
- 16.1.2 South Africa
- 16.1.3 Saudi Arabia
- 16.1.4 Rest of MEA
- 17. South Africa Pectin Industry Analysis, Insights and Forecast, 2019-2031
- 17.1. Market Analysis, Insights and Forecast - By Country/Sub-region
- 17.1.1 Saudi Arabia
- 17.1.2 Rest of Middle East
- 18. Competitive Analysis
- 18.1. Global Market Share Analysis 2024
- 18.2. Company Profiles
- 18.2.1 Silvateam SpA
- 18.2.1.1. Overview
- 18.2.1.2. Products
- 18.2.1.3. SWOT Analysis
- 18.2.1.4. Recent Developments
- 18.2.1.5. Financials (Based on Availability)
- 18.2.2 International Flavors & Fragrances
- 18.2.2.1. Overview
- 18.2.2.2. Products
- 18.2.2.3. SWOT Analysis
- 18.2.2.4. Recent Developments
- 18.2.2.5. Financials (Based on Availability)
- 18.2.3 Herbstreith and Fox Corporate Group
- 18.2.3.1. Overview
- 18.2.3.2. Products
- 18.2.3.3. SWOT Analysis
- 18.2.3.4. Recent Developments
- 18.2.3.5. Financials (Based on Availability)
- 18.2.4 Lucid Colloids Ltd
- 18.2.4.1. Overview
- 18.2.4.2. Products
- 18.2.4.3. SWOT Analysis
- 18.2.4.4. Recent Developments
- 18.2.4.5. Financials (Based on Availability)
- 18.2.5 JM Huber Corporation (CP Kelco)
- 18.2.5.1. Overview
- 18.2.5.2. Products
- 18.2.5.3. SWOT Analysis
- 18.2.5.4. Recent Developments
- 18.2.5.5. Financials (Based on Availability)
- 18.2.6 Cargill Incorported
- 18.2.6.1. Overview
- 18.2.6.2. Products
- 18.2.6.3. SWOT Analysis
- 18.2.6.4. Recent Developments
- 18.2.6.5. Financials (Based on Availability)
- 18.2.7 Pacific Pectin Inc *List Not Exhaustive
- 18.2.7.1. Overview
- 18.2.7.2. Products
- 18.2.7.3. SWOT Analysis
- 18.2.7.4. Recent Developments
- 18.2.7.5. Financials (Based on Availability)
- 18.2.8 Foodchem International Corporation
- 18.2.8.1. Overview
- 18.2.8.2. Products
- 18.2.8.3. SWOT Analysis
- 18.2.8.4. Recent Developments
- 18.2.8.5. Financials (Based on Availability)
- 18.2.9 Ingredion Incorporated
- 18.2.9.1. Overview
- 18.2.9.2. Products
- 18.2.9.3. SWOT Analysis
- 18.2.9.4. Recent Developments
- 18.2.9.5. Financials (Based on Availability)
- 18.2.10 Royal DSM
- 18.2.10.1. Overview
- 18.2.10.2. Products
- 18.2.10.3. SWOT Analysis
- 18.2.10.4. Recent Developments
- 18.2.10.5. Financials (Based on Availability)
- 18.2.1 Silvateam SpA
List of Figures
- Figure 1: Global Pectin Industry Revenue Breakdown (Million, %) by Region 2024 & 2032
- Figure 2: North America Pectin Industry Revenue (Million), by Country 2024 & 2032
- Figure 3: North America Pectin Industry Revenue Share (%), by Country 2024 & 2032
- Figure 4: Europe Pectin Industry Revenue (Million), by Country 2024 & 2032
- Figure 5: Europe Pectin Industry Revenue Share (%), by Country 2024 & 2032
- Figure 6: Asia Pacific Pectin Industry Revenue (Million), by Country 2024 & 2032
- Figure 7: Asia Pacific Pectin Industry Revenue Share (%), by Country 2024 & 2032
- Figure 8: South America Pectin Industry Revenue (Million), by Country 2024 & 2032
- Figure 9: South America Pectin Industry Revenue Share (%), by Country 2024 & 2032
- Figure 10: Middle East & Africa Pectin Industry Revenue (Million), by Country 2024 & 2032
- Figure 11: Middle East & Africa Pectin Industry Revenue Share (%), by Country 2024 & 2032
- Figure 12: South Africa Pectin Industry Revenue (Million), by Country 2024 & 2032
- Figure 13: South Africa Pectin Industry Revenue Share (%), by Country 2024 & 2032
- Figure 14: North America Pectin Industry Revenue (Million), by Source 2024 & 2032
- Figure 15: North America Pectin Industry Revenue Share (%), by Source 2024 & 2032
- Figure 16: North America Pectin Industry Revenue (Million), by Application 2024 & 2032
- Figure 17: North America Pectin Industry Revenue Share (%), by Application 2024 & 2032
- Figure 18: North America Pectin Industry Revenue (Million), by Type 2024 & 2032
- Figure 19: North America Pectin Industry Revenue Share (%), by Type 2024 & 2032
- Figure 20: North America Pectin Industry Revenue (Million), by Country 2024 & 2032
- Figure 21: North America Pectin Industry Revenue Share (%), by Country 2024 & 2032
- Figure 22: Europe Pectin Industry Revenue (Million), by Source 2024 & 2032
- Figure 23: Europe Pectin Industry Revenue Share (%), by Source 2024 & 2032
- Figure 24: Europe Pectin Industry Revenue (Million), by Application 2024 & 2032
- Figure 25: Europe Pectin Industry Revenue Share (%), by Application 2024 & 2032
- Figure 26: Europe Pectin Industry Revenue (Million), by Type 2024 & 2032
- Figure 27: Europe Pectin Industry Revenue Share (%), by Type 2024 & 2032
- Figure 28: Europe Pectin Industry Revenue (Million), by Country 2024 & 2032
- Figure 29: Europe Pectin Industry Revenue Share (%), by Country 2024 & 2032
- Figure 30: Asia Pacific Pectin Industry Revenue (Million), by Source 2024 & 2032
- Figure 31: Asia Pacific Pectin Industry Revenue Share (%), by Source 2024 & 2032
- Figure 32: Asia Pacific Pectin Industry Revenue (Million), by Application 2024 & 2032
- Figure 33: Asia Pacific Pectin Industry Revenue Share (%), by Application 2024 & 2032
- Figure 34: Asia Pacific Pectin Industry Revenue (Million), by Type 2024 & 2032
- Figure 35: Asia Pacific Pectin Industry Revenue Share (%), by Type 2024 & 2032
- Figure 36: Asia Pacific Pectin Industry Revenue (Million), by Country 2024 & 2032
- Figure 37: Asia Pacific Pectin Industry Revenue Share (%), by Country 2024 & 2032
- Figure 38: South America Pectin Industry Revenue (Million), by Source 2024 & 2032
- Figure 39: South America Pectin Industry Revenue Share (%), by Source 2024 & 2032
- Figure 40: South America Pectin Industry Revenue (Million), by Application 2024 & 2032
- Figure 41: South America Pectin Industry Revenue Share (%), by Application 2024 & 2032
- Figure 42: South America Pectin Industry Revenue (Million), by Type 2024 & 2032
- Figure 43: South America Pectin Industry Revenue Share (%), by Type 2024 & 2032
- Figure 44: South America Pectin Industry Revenue (Million), by Country 2024 & 2032
- Figure 45: South America Pectin Industry Revenue Share (%), by Country 2024 & 2032
- Figure 46: Middle East Pectin Industry Revenue (Million), by Source 2024 & 2032
- Figure 47: Middle East Pectin Industry Revenue Share (%), by Source 2024 & 2032
- Figure 48: Middle East Pectin Industry Revenue (Million), by Application 2024 & 2032
- Figure 49: Middle East Pectin Industry Revenue Share (%), by Application 2024 & 2032
- Figure 50: Middle East Pectin Industry Revenue (Million), by Type 2024 & 2032
- Figure 51: Middle East Pectin Industry Revenue Share (%), by Type 2024 & 2032
- Figure 52: Middle East Pectin Industry Revenue (Million), by Country 2024 & 2032
- Figure 53: Middle East Pectin Industry Revenue Share (%), by Country 2024 & 2032
- Figure 54: South Africa Pectin Industry Revenue (Million), by Source 2024 & 2032
- Figure 55: South Africa Pectin Industry Revenue Share (%), by Source 2024 & 2032
- Figure 56: South Africa Pectin Industry Revenue (Million), by Application 2024 & 2032
- Figure 57: South Africa Pectin Industry Revenue Share (%), by Application 2024 & 2032
- Figure 58: South Africa Pectin Industry Revenue (Million), by Type 2024 & 2032
- Figure 59: South Africa Pectin Industry Revenue Share (%), by Type 2024 & 2032
- Figure 60: South Africa Pectin Industry Revenue (Million), by Country 2024 & 2032
- Figure 61: South Africa Pectin Industry Revenue Share (%), by Country 2024 & 2032
List of Tables
- Table 1: Global Pectin Industry Revenue Million Forecast, by Region 2019 & 2032
- Table 2: Global Pectin Industry Revenue Million Forecast, by Source 2019 & 2032
- Table 3: Global Pectin Industry Revenue Million Forecast, by Application 2019 & 2032
- Table 4: Global Pectin Industry Revenue Million Forecast, by Type 2019 & 2032
- Table 5: Global Pectin Industry Revenue Million Forecast, by Region 2019 & 2032
- Table 6: Global Pectin Industry Revenue Million Forecast, by Country 2019 & 2032
- Table 7: United States Pectin Industry Revenue (Million) Forecast, by Application 2019 & 2032
- Table 8: Canada Pectin Industry Revenue (Million) Forecast, by Application 2019 & 2032
- Table 9: Mexico Pectin Industry Revenue (Million) Forecast, by Application 2019 & 2032
- Table 10: Rest of North America Pectin Industry Revenue (Million) Forecast, by Application 2019 & 2032
- Table 11: Global Pectin Industry Revenue Million Forecast, by Country 2019 & 2032
- Table 12: United Kingdom Pectin Industry Revenue (Million) Forecast, by Application 2019 & 2032
- Table 13: Germany Pectin Industry Revenue (Million) Forecast, by Application 2019 & 2032
- Table 14: France Pectin Industry Revenue (Million) Forecast, by Application 2019 & 2032
- Table 15: Russia Pectin Industry Revenue (Million) Forecast, by Application 2019 & 2032
- Table 16: Italy Pectin Industry Revenue (Million) Forecast, by Application 2019 & 2032
- Table 17: Spain Pectin Industry Revenue (Million) Forecast, by Application 2019 & 2032
- Table 18: Rest of Europe Pectin Industry Revenue (Million) Forecast, by Application 2019 & 2032
- Table 19: Global Pectin Industry Revenue Million Forecast, by Country 2019 & 2032
- Table 20: India Pectin Industry Revenue (Million) Forecast, by Application 2019 & 2032
- Table 21: China Pectin Industry Revenue (Million) Forecast, by Application 2019 & 2032
- Table 22: Japan Pectin Industry Revenue (Million) Forecast, by Application 2019 & 2032
- Table 23: Australia Pectin Industry Revenue (Million) Forecast, by Application 2019 & 2032
- Table 24: Rest of Asia Pacific Pectin Industry Revenue (Million) Forecast, by Application 2019 & 2032
- Table 25: Global Pectin Industry Revenue Million Forecast, by Country 2019 & 2032
- Table 26: Brazil Pectin Industry Revenue (Million) Forecast, by Application 2019 & 2032
- Table 27: Argentina Pectin Industry Revenue (Million) Forecast, by Application 2019 & 2032
- Table 28: Rest of South America Pectin Industry Revenue (Million) Forecast, by Application 2019 & 2032
- Table 29: Global Pectin Industry Revenue Million Forecast, by Country 2019 & 2032
- Table 30: UAE Pectin Industry Revenue (Million) Forecast, by Application 2019 & 2032
- Table 31: South Africa Pectin Industry Revenue (Million) Forecast, by Application 2019 & 2032
- Table 32: Saudi Arabia Pectin Industry Revenue (Million) Forecast, by Application 2019 & 2032
- Table 33: Rest of MEA Pectin Industry Revenue (Million) Forecast, by Application 2019 & 2032
- Table 34: Global Pectin Industry Revenue Million Forecast, by Country 2019 & 2032
- Table 35: Saudi Arabia Pectin Industry Revenue (Million) Forecast, by Application 2019 & 2032
- Table 36: Rest of Middle East Pectin Industry Revenue (Million) Forecast, by Application 2019 & 2032
- Table 37: Global Pectin Industry Revenue Million Forecast, by Source 2019 & 2032
- Table 38: Global Pectin Industry Revenue Million Forecast, by Application 2019 & 2032
- Table 39: Global Pectin Industry Revenue Million Forecast, by Type 2019 & 2032
- Table 40: Global Pectin Industry Revenue Million Forecast, by Country 2019 & 2032
- Table 41: United States Pectin Industry Revenue (Million) Forecast, by Application 2019 & 2032
- Table 42: Canada Pectin Industry Revenue (Million) Forecast, by Application 2019 & 2032
- Table 43: Mexico Pectin Industry Revenue (Million) Forecast, by Application 2019 & 2032
- Table 44: Rest of North America Pectin Industry Revenue (Million) Forecast, by Application 2019 & 2032
- Table 45: Global Pectin Industry Revenue Million Forecast, by Source 2019 & 2032
- Table 46: Global Pectin Industry Revenue Million Forecast, by Application 2019 & 2032
- Table 47: Global Pectin Industry Revenue Million Forecast, by Type 2019 & 2032
- Table 48: Global Pectin Industry Revenue Million Forecast, by Country 2019 & 2032
- Table 49: United Kingdom Pectin Industry Revenue (Million) Forecast, by Application 2019 & 2032
- Table 50: Germany Pectin Industry Revenue (Million) Forecast, by Application 2019 & 2032
- Table 51: France Pectin Industry Revenue (Million) Forecast, by Application 2019 & 2032
- Table 52: Russia Pectin Industry Revenue (Million) Forecast, by Application 2019 & 2032
- Table 53: Italy Pectin Industry Revenue (Million) Forecast, by Application 2019 & 2032
- Table 54: Spain Pectin Industry Revenue (Million) Forecast, by Application 2019 & 2032
- Table 55: Rest of Europe Pectin Industry Revenue (Million) Forecast, by Application 2019 & 2032
- Table 56: Global Pectin Industry Revenue Million Forecast, by Source 2019 & 2032
- Table 57: Global Pectin Industry Revenue Million Forecast, by Application 2019 & 2032
- Table 58: Global Pectin Industry Revenue Million Forecast, by Type 2019 & 2032
- Table 59: Global Pectin Industry Revenue Million Forecast, by Country 2019 & 2032
- Table 60: India Pectin Industry Revenue (Million) Forecast, by Application 2019 & 2032
- Table 61: China Pectin Industry Revenue (Million) Forecast, by Application 2019 & 2032
- Table 62: Japan Pectin Industry Revenue (Million) Forecast, by Application 2019 & 2032
- Table 63: Australia Pectin Industry Revenue (Million) Forecast, by Application 2019 & 2032
- Table 64: Rest of Asia Pacific Pectin Industry Revenue (Million) Forecast, by Application 2019 & 2032
- Table 65: Global Pectin Industry Revenue Million Forecast, by Source 2019 & 2032
- Table 66: Global Pectin Industry Revenue Million Forecast, by Application 2019 & 2032
- Table 67: Global Pectin Industry Revenue Million Forecast, by Type 2019 & 2032
- Table 68: Global Pectin Industry Revenue Million Forecast, by Country 2019 & 2032
- Table 69: Brazil Pectin Industry Revenue (Million) Forecast, by Application 2019 & 2032
- Table 70: Argentina Pectin Industry Revenue (Million) Forecast, by Application 2019 & 2032
- Table 71: Rest of South America Pectin Industry Revenue (Million) Forecast, by Application 2019 & 2032
- Table 72: Global Pectin Industry Revenue Million Forecast, by Source 2019 & 2032
- Table 73: Global Pectin Industry Revenue Million Forecast, by Application 2019 & 2032
- Table 74: Global Pectin Industry Revenue Million Forecast, by Type 2019 & 2032
- Table 75: Global Pectin Industry Revenue Million Forecast, by Country 2019 & 2032
- Table 76: Global Pectin Industry Revenue Million Forecast, by Source 2019 & 2032
- Table 77: Global Pectin Industry Revenue Million Forecast, by Application 2019 & 2032
- Table 78: Global Pectin Industry Revenue Million Forecast, by Type 2019 & 2032
- Table 79: Global Pectin Industry Revenue Million Forecast, by Country 2019 & 2032
- Table 80: Saudi Arabia Pectin Industry Revenue (Million) Forecast, by Application 2019 & 2032
- Table 81: Rest of Middle East Pectin Industry Revenue (Million) Forecast, by Application 2019 & 2032
Frequently Asked Questions
1. What is the projected Compound Annual Growth Rate (CAGR) of the Pectin Industry?
The projected CAGR is approximately 6.02%.
2. Which companies are prominent players in the Pectin Industry?
Key companies in the market include Silvateam SpA, International Flavors & Fragrances, Herbstreith and Fox Corporate Group, Lucid Colloids Ltd, JM Huber Corporation (CP Kelco), Cargill Incorported, Pacific Pectin Inc *List Not Exhaustive, Foodchem International Corporation, Ingredion Incorporated, Royal DSM.
3. What are the main segments of the Pectin Industry?
The market segments include Source, Application, Type.
4. Can you provide details about the market size?
The market size is estimated to be USD 1.01 Million as of 2022.
5. What are some drivers contributing to market growth?
Demand for Natural and Clean-label Ingredients; Rising Consumption of Packaged Food Products.
6. What are the notable trends driving market growth?
Demand for Natural and Clean Label Ingredients.
7. Are there any restraints impacting market growth?
Availability of Economically Feasible Alternatives.
8. Can you provide examples of recent developments in the market?
January 2024: IFF launched Grindsted Pectin FB 420 for baking applications. It is ideal for baking applications, has unique sensory qualities for bake-stable fruit fillings, and is label-friendly and process-efficient.
9. What pricing options are available for accessing the report?
Pricing options include single-user, multi-user, and enterprise licenses priced at USD 4750, USD 5250, and USD 8750 respectively.
10. Is the market size provided in terms of value or volume?
The market size is provided in terms of value, measured in Million.
11. Are there any specific market keywords associated with the report?
Yes, the market keyword associated with the report is "Pectin Industry," which aids in identifying and referencing the specific market segment covered.
12. How do I determine which pricing option suits my needs best?
The pricing options vary based on user requirements and access needs. Individual users may opt for single-user licenses, while businesses requiring broader access may choose multi-user or enterprise licenses for cost-effective access to the report.
13. Are there any additional resources or data provided in the Pectin Industry report?
While the report offers comprehensive insights, it's advisable to review the specific contents or supplementary materials provided to ascertain if additional resources or data are available.
14. How can I stay updated on further developments or reports in the Pectin Industry?
To stay informed about further developments, trends, and reports in the Pectin Industry, consider subscribing to industry newsletters, following relevant companies and organizations, or regularly checking reputable industry news sources and publications.
Methodology
Step 1 - Identification of Relevant Samples Size from Population Database


Step 2 - Approaches for Defining Global Market Size (Value, Volume* & Price*)

Note*: In applicable scenarios
Step 3 - Data Sources
Primary Research
- Web Analytics
- Survey Reports
- Research Institute
- Latest Research Reports
- Opinion Leaders
Secondary Research
- Annual Reports
- White Paper
- Latest Press Release
- Industry Association
- Paid Database
- Investor Presentations

Step 4 - Data Triangulation
Involves using different sources of information in order to increase the validity of a study
These sources are likely to be stakeholders in a program - participants, other researchers, program staff, other community members, and so on.
Then we put all data in single framework & apply various statistical tools to find out the dynamic on the market.
During the analysis stage, feedback from the stakeholder groups would be compared to determine areas of agreement as well as areas of divergence


