
Key Insights
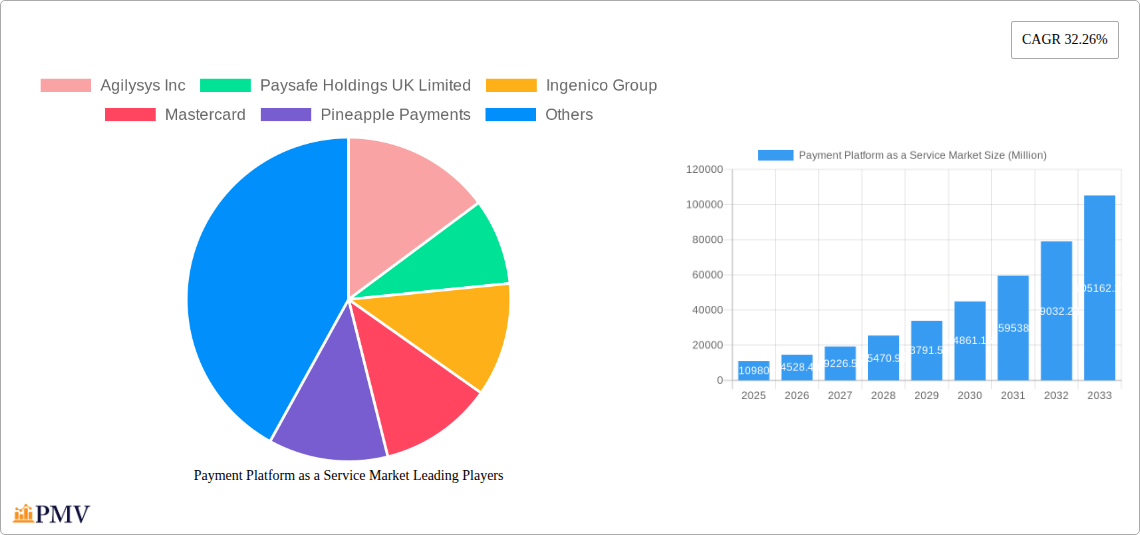
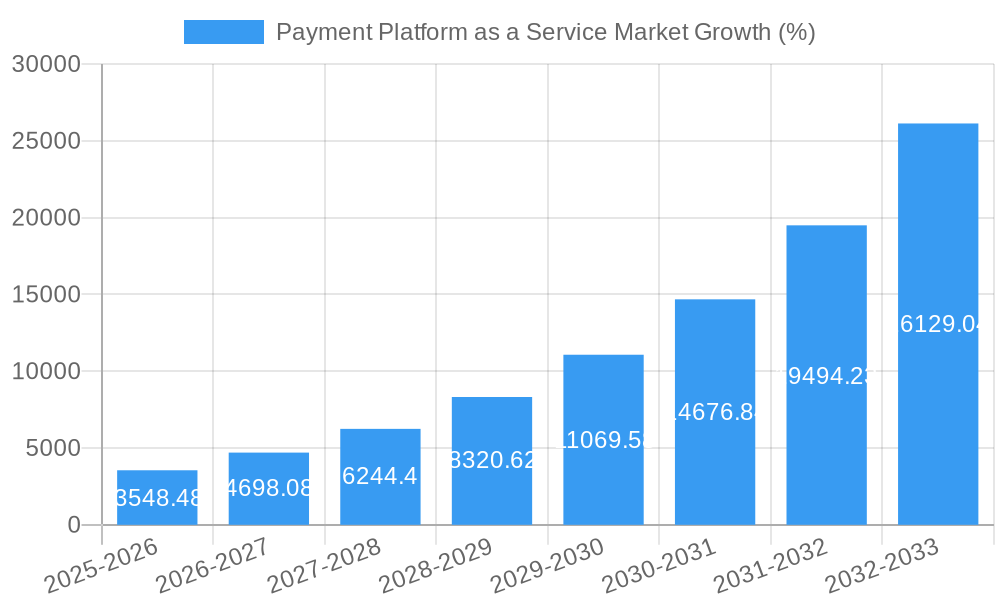
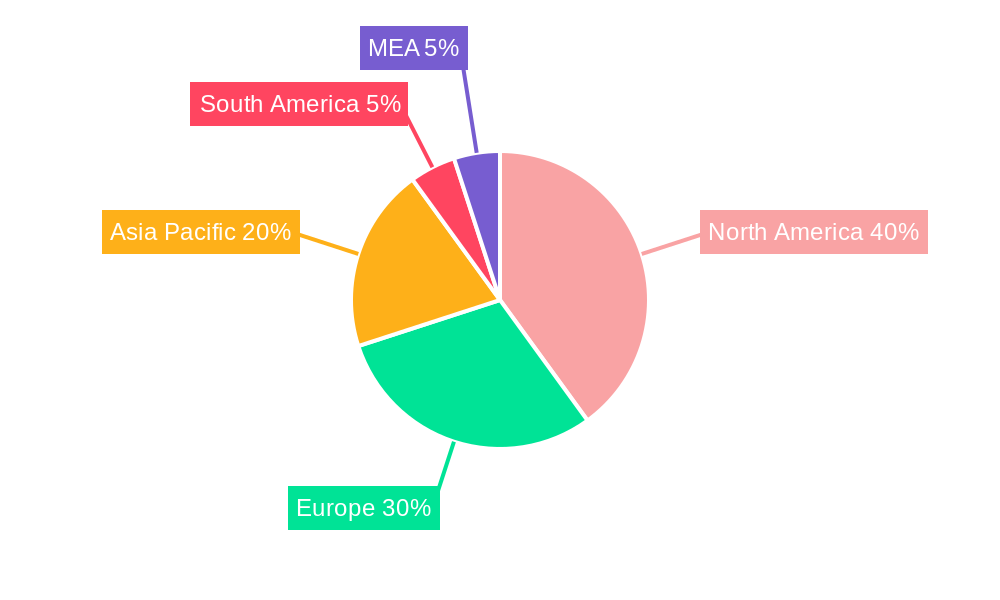
The Payment Platform as a Service (PaaS) market is experiencing robust growth, projected to reach \$10.98 billion in 2025 and exhibiting a remarkable Compound Annual Growth Rate (CAGR) of 32.26% from 2025 to 2033. This expansion is fueled by several key drivers. The increasing adoption of digital payment methods across various industries, particularly retail and e-commerce, is a primary catalyst. Furthermore, the growing need for enhanced security and fraud protection, coupled with stringent regulatory compliance requirements, is driving demand for sophisticated PaaS solutions. The market's segmentation reveals significant opportunities in merchant financing, payment applications and gateways, and regulatory compliance services. North America currently holds a substantial market share, driven by early adoption of technology and a well-established digital payments infrastructure. However, Asia-Pacific is poised for significant growth due to rapid digitalization and increasing smartphone penetration. The competitive landscape is characterized by both established players like PayPal and Mastercard and emerging innovative firms, resulting in continuous innovation and a dynamic market.
The continued expansion of the PaaS market will be significantly influenced by ongoing technological advancements, particularly in areas like artificial intelligence (AI) and machine learning (ML) for fraud detection and personalized payment experiences. Furthermore, the increasing integration of PaaS solutions with other enterprise software systems and the evolution of open banking initiatives will create further opportunities. While challenges such as data security concerns and the need for robust cybersecurity measures remain, the overall market outlook remains positive. The diverse range of services offered by PaaS providers and the adaptability of these platforms to various industry-specific needs ensures that this market will continue its impressive trajectory of growth throughout the forecast period, potentially surpassing \$100 billion by 2033 based on current projections. Geographic expansion, particularly into emerging markets, will also significantly contribute to overall market value.
Payment Platform as a Service Market: A Comprehensive Report (2019-2033)
This in-depth report provides a comprehensive analysis of the Payment Platform as a Service (PaaS) market, offering invaluable insights for businesses, investors, and industry stakeholders. The study period spans from 2019 to 2033, with 2025 serving as the base and estimated year. The report covers market size, segmentation, growth drivers, challenges, competitive landscape, and key developments, providing a 360-degree view of this dynamic market projected to reach xx Million by 2033.
Payment Platform as a Service Market Structure & Competitive Dynamics
The Payment Platform as a Service market is characterized by a moderately concentrated landscape with key players vying for market share. The market's structure is influenced by factors such as regulatory frameworks, technological innovation, and the prevalence of mergers and acquisitions (M&A) activities. Major players, including Agilysys Inc, Paysafe Holdings UK Limited, Ingenico Group, Mastercard, Pineapple Payments, PayPal Holdings Inc, Total System Services Inc, Thales Group, FIS, and Verifone, are constantly innovating to enhance their offerings and expand their market reach.
- Market Concentration: The market exhibits a moderate concentration level, with the top 5 players holding an estimated xx% market share in 2025.
- Innovation Ecosystems: Open APIs and partnerships are driving innovation, fostering the development of niche solutions and integrations.
- Regulatory Frameworks: Stringent data privacy regulations (e.g., GDPR, CCPA) and evolving compliance requirements significantly impact market dynamics.
- Product Substitutes: Traditional payment gateways and in-house solutions pose some level of competition, although PaaS offerings are increasingly preferred for their scalability and flexibility.
- End-User Trends: The growing adoption of digital payments, mobile commerce, and embedded finance is fueling market growth.
- M&A Activities: Consolidation is expected to continue, with larger players acquiring smaller companies to expand their product portfolios and geographic reach. The total value of M&A deals in the PaaS market is estimated to have reached xx Million in 2024.
Payment Platform as a Service Market Industry Trends & Insights
The Payment Platform as a Service market is experiencing robust growth, driven by several key factors. The Compound Annual Growth Rate (CAGR) is projected to be xx% during the forecast period (2025-2033). Market penetration is steadily increasing across various industries, particularly in e-commerce and BFSI sectors. Technological advancements, such as the rise of blockchain technology and AI-powered fraud detection, are transforming the landscape. Consumer preference for seamless and secure digital payment experiences is another significant growth driver. Intense competition among providers is leading to continuous innovation in areas like security, transaction speed, and cost-effectiveness. This competitive pressure is also pushing down pricing, making PaaS solutions accessible to a wider range of businesses. Market maturity varies across different regions, with developed economies showing higher penetration rates compared to emerging markets. The increasing adoption of mobile wallets and contactless payments is also contributing significantly to overall market expansion. The integration of PaaS with other financial services like lending and insurance is also gaining traction, further driving growth.
Dominant Markets & Segments in Payment Platform as a Service Market
The Payment Platform as a Service market is segmented by type of services and end-user industry. While the overall market is experiencing significant growth, certain segments show more pronounced dominance.
By Types of Services:
- Payment Applications and Gateways: This segment holds the largest market share due to its wide applicability across various industries and business sizes.
- Security and Fraud Protection: Growing concerns about data breaches and fraudulent activities are driving strong growth in this segment.
- Merchant Financing: This segment is experiencing increasing demand driven by the need for working capital solutions among businesses.
By End-user Industry:
- Retail and E-commerce: This segment is the dominant end-user industry, fueled by the explosive growth of online shopping and the need for secure and efficient payment processing. Key drivers include rising online transactions, increasing smartphone penetration, and favorable economic policies in many regions.
- BFSI (Banking, Financial Services, and Insurance): BFSI is another major segment, with banks and financial institutions adopting PaaS to enhance their digital offerings and improve operational efficiency. Robust infrastructure and supportive regulatory environments contribute to its prominence.
Other segments, including Hospitality, Media and Entertainment, and Other End-user Industries, are also showing significant growth potential, although at a slower pace compared to Retail & E-commerce and BFSI.
Payment Platform as a Service Market Product Innovations
Recent innovations in the PaaS market focus on enhancing security, improving user experience, and increasing integration capabilities. This includes the integration of advanced fraud detection technologies, the development of more user-friendly interfaces, and the implementation of open APIs for seamless integration with other business systems. The trend towards embedded finance is also driving product innovation, with PaaS solutions being integrated directly into other applications and platforms. This seamless integration enhances convenience and improves the overall customer experience.
Report Segmentation & Scope
This report segments the Payment Platform as a Service market by:
By Types of Services: Merchant Financing; Regulatory Compliance; Security and Fraud Protection; Payment Applications and Gateways; Other Services. Each segment's growth trajectory is analyzed, considering factors like technological advancements, regulatory changes, and competitive pressures. Market sizes for each segment are projected for the forecast period, providing insights into their individual contributions to overall market growth.
By End-user Industry: Retail and E-commerce; BFSI; Hospitality; Media and Entertainment; Other End-user Industries. Similarly, this segmentation analyzes the specific needs and demands of each industry, highlighting market opportunities and challenges within each sector. Growth projections and competitive dynamics within each end-user industry are detailed.
Key Drivers of Payment Platform as a Service Market Growth
Several factors are driving the growth of the Payment Platform as a Service market. The increasing adoption of digital payments, fueled by smartphone penetration and e-commerce expansion, is a primary driver. Technological advancements like AI and blockchain enhance security and efficiency, further boosting market growth. Favorable regulatory environments in many regions, alongside government initiatives promoting digitalization, are creating a supportive ecosystem for PaaS adoption.
Challenges in the Payment Platform as a Service Market Sector
Despite the significant growth potential, the Payment Platform as a Service market faces several challenges. Stringent regulatory compliance requirements, especially regarding data privacy and security, impose significant costs and complexities. Maintaining robust security infrastructure to prevent fraud and data breaches is crucial but costly. Intense competition among providers necessitates continuous innovation and investment to stay ahead. The need for integration with various existing systems can also present technical and logistical challenges.
Leading Players in the Payment Platform as a Service Market Market
- Agilysys Inc
- Paysafe Holdings UK Limited
- Ingenico Group
- Mastercard
- Pineapple Payments
- PayPal Holdings Inc
- Total System Services Inc
- Thales Group
- FIS
- Verifone
Key Developments in Payment Platform as a Service Market Sector
- November 2022: Nium launched Nium Airline Payments (NAP), a closed-loop payments solution, enhancing efficiency in the airline industry.
- October 2022: Deutsche Bank and Fiserv launched Vert, an integrated payment acceptance and banking solution for SMEs, targeting a significant market segment.
Strategic Payment Platform as a Service Market Outlook
The Payment Platform as a Service market holds immense potential for future growth. Continued technological advancements, increasing digitalization across industries, and the rising demand for secure and efficient payment solutions will drive market expansion. Strategic partnerships, acquisitions, and geographic expansion will be key strategies for players seeking to capitalize on this growth. The focus on innovative solutions tailored to specific industry needs will be crucial for success.
Payment Platform as a Service Market Segmentation
-
1. Types of Services
- 1.1. Merchant Financing
- 1.2. Regulatory Compliance
- 1.3. Security and Fraud Protection
- 1.4. Payment Applications and Gateways
- 1.5. Other Services
-
2. End-user Industry
- 2.1. Retail and E-commerce
- 2.2. BFSI
- 2.3. Hospitality
- 2.4. Media and Entertainment
- 2.5. Other End-user Industries
Payment Platform as a Service Market Segmentation By Geography
-
1. North America
- 1.1. United States
- 1.2. Canada
-
2. Europe
- 2.1. United Kingdom
- 2.2. Germany
- 2.3. France
- 2.4. Rest of Europe
-
3. Asia Pacific
- 3.1. China
- 3.2. Japan
- 3.3. South Korea
- 3.4. Australia
- 3.5. Rest of Asia Pacific
-
4. Latin America
- 4.1. Mexico
- 4.2. Brazil
- 4.3. Rest of Latin America
-
5. Middle East and Africa
- 5.1. United Arab Emirates
- 5.2. Saudi Arabia
- 5.3. Rest of Middle East and Africa
Payment Platform as a Service Market REPORT HIGHLIGHTS
| Aspects | Details |
|---|---|
| Study Period | 2019-2033 |
| Base Year | 2024 |
| Estimated Year | 2025 |
| Forecast Period | 2025-2033 |
| Historical Period | 2019-2024 |
| Growth Rate | CAGR of 32.26% from 2019-2033 |
| Segmentation |
|
Table of Contents
- 1. Introduction
- 1.1. Research Scope
- 1.2. Market Segmentation
- 1.3. Research Methodology
- 1.4. Definitions and Assumptions
- 2. Executive Summary
- 2.1. Introduction
- 3. Market Dynamics
- 3.1. Introduction
- 3.2. Market Drivers
- 3.2.1. Increased Demand for Smartphone Penetration and Incorporation of Online Services; Increase Dependence on E-Commerce Platform
- 3.3. Market Restrains
- 3.3.1. Absence of Global Standards for Payments
- 3.4. Market Trends
- 3.4.1. Retail Sector Expected to be a Significant Contributor
- 4. Market Factor Analysis
- 4.1. Porters Five Forces
- 4.2. Supply/Value Chain
- 4.3. PESTEL analysis
- 4.4. Market Entropy
- 4.5. Patent/Trademark Analysis
- 5. Global Payment Platform as a Service Market Analysis, Insights and Forecast, 2019-2031
- 5.1. Market Analysis, Insights and Forecast - by Types of Services
- 5.1.1. Merchant Financing
- 5.1.2. Regulatory Compliance
- 5.1.3. Security and Fraud Protection
- 5.1.4. Payment Applications and Gateways
- 5.1.5. Other Services
- 5.2. Market Analysis, Insights and Forecast - by End-user Industry
- 5.2.1. Retail and E-commerce
- 5.2.2. BFSI
- 5.2.3. Hospitality
- 5.2.4. Media and Entertainment
- 5.2.5. Other End-user Industries
- 5.3. Market Analysis, Insights and Forecast - by Region
- 5.3.1. North America
- 5.3.2. Europe
- 5.3.3. Asia Pacific
- 5.3.4. Latin America
- 5.3.5. Middle East and Africa
- 5.1. Market Analysis, Insights and Forecast - by Types of Services
- 6. North America Payment Platform as a Service Market Analysis, Insights and Forecast, 2019-2031
- 6.1. Market Analysis, Insights and Forecast - by Types of Services
- 6.1.1. Merchant Financing
- 6.1.2. Regulatory Compliance
- 6.1.3. Security and Fraud Protection
- 6.1.4. Payment Applications and Gateways
- 6.1.5. Other Services
- 6.2. Market Analysis, Insights and Forecast - by End-user Industry
- 6.2.1. Retail and E-commerce
- 6.2.2. BFSI
- 6.2.3. Hospitality
- 6.2.4. Media and Entertainment
- 6.2.5. Other End-user Industries
- 6.1. Market Analysis, Insights and Forecast - by Types of Services
- 7. Europe Payment Platform as a Service Market Analysis, Insights and Forecast, 2019-2031
- 7.1. Market Analysis, Insights and Forecast - by Types of Services
- 7.1.1. Merchant Financing
- 7.1.2. Regulatory Compliance
- 7.1.3. Security and Fraud Protection
- 7.1.4. Payment Applications and Gateways
- 7.1.5. Other Services
- 7.2. Market Analysis, Insights and Forecast - by End-user Industry
- 7.2.1. Retail and E-commerce
- 7.2.2. BFSI
- 7.2.3. Hospitality
- 7.2.4. Media and Entertainment
- 7.2.5. Other End-user Industries
- 7.1. Market Analysis, Insights and Forecast - by Types of Services
- 8. Asia Pacific Payment Platform as a Service Market Analysis, Insights and Forecast, 2019-2031
- 8.1. Market Analysis, Insights and Forecast - by Types of Services
- 8.1.1. Merchant Financing
- 8.1.2. Regulatory Compliance
- 8.1.3. Security and Fraud Protection
- 8.1.4. Payment Applications and Gateways
- 8.1.5. Other Services
- 8.2. Market Analysis, Insights and Forecast - by End-user Industry
- 8.2.1. Retail and E-commerce
- 8.2.2. BFSI
- 8.2.3. Hospitality
- 8.2.4. Media and Entertainment
- 8.2.5. Other End-user Industries
- 8.1. Market Analysis, Insights and Forecast - by Types of Services
- 9. Latin America Payment Platform as a Service Market Analysis, Insights and Forecast, 2019-2031
- 9.1. Market Analysis, Insights and Forecast - by Types of Services
- 9.1.1. Merchant Financing
- 9.1.2. Regulatory Compliance
- 9.1.3. Security and Fraud Protection
- 9.1.4. Payment Applications and Gateways
- 9.1.5. Other Services
- 9.2. Market Analysis, Insights and Forecast - by End-user Industry
- 9.2.1. Retail and E-commerce
- 9.2.2. BFSI
- 9.2.3. Hospitality
- 9.2.4. Media and Entertainment
- 9.2.5. Other End-user Industries
- 9.1. Market Analysis, Insights and Forecast - by Types of Services
- 10. Middle East and Africa Payment Platform as a Service Market Analysis, Insights and Forecast, 2019-2031
- 10.1. Market Analysis, Insights and Forecast - by Types of Services
- 10.1.1. Merchant Financing
- 10.1.2. Regulatory Compliance
- 10.1.3. Security and Fraud Protection
- 10.1.4. Payment Applications and Gateways
- 10.1.5. Other Services
- 10.2. Market Analysis, Insights and Forecast - by End-user Industry
- 10.2.1. Retail and E-commerce
- 10.2.2. BFSI
- 10.2.3. Hospitality
- 10.2.4. Media and Entertainment
- 10.2.5. Other End-user Industries
- 10.1. Market Analysis, Insights and Forecast - by Types of Services
- 11. North America Payment Platform as a Service Market Analysis, Insights and Forecast, 2019-2031
- 11.1. Market Analysis, Insights and Forecast - By Country/Sub-region
- 11.1.1 United States
- 11.1.2 Canada
- 11.1.3 Mexico
- 12. Europe Payment Platform as a Service Market Analysis, Insights and Forecast, 2019-2031
- 12.1. Market Analysis, Insights and Forecast - By Country/Sub-region
- 12.1.1 Germany
- 12.1.2 United Kingdom
- 12.1.3 France
- 12.1.4 Spain
- 12.1.5 Italy
- 12.1.6 Spain
- 12.1.7 Belgium
- 12.1.8 Netherland
- 12.1.9 Nordics
- 12.1.10 Rest of Europe
- 13. Asia Pacific Payment Platform as a Service Market Analysis, Insights and Forecast, 2019-2031
- 13.1. Market Analysis, Insights and Forecast - By Country/Sub-region
- 13.1.1 China
- 13.1.2 Japan
- 13.1.3 India
- 13.1.4 South Korea
- 13.1.5 Southeast Asia
- 13.1.6 Australia
- 13.1.7 Indonesia
- 13.1.8 Phillipes
- 13.1.9 Singapore
- 13.1.10 Thailandc
- 13.1.11 Rest of Asia Pacific
- 14. South America Payment Platform as a Service Market Analysis, Insights and Forecast, 2019-2031
- 14.1. Market Analysis, Insights and Forecast - By Country/Sub-region
- 14.1.1 Brazil
- 14.1.2 Argentina
- 14.1.3 Peru
- 14.1.4 Chile
- 14.1.5 Colombia
- 14.1.6 Ecuador
- 14.1.7 Venezuela
- 14.1.8 Rest of South America
- 15. North America Payment Platform as a Service Market Analysis, Insights and Forecast, 2019-2031
- 15.1. Market Analysis, Insights and Forecast - By Country/Sub-region
- 15.1.1 United States
- 15.1.2 Canada
- 15.1.3 Mexico
- 16. MEA Payment Platform as a Service Market Analysis, Insights and Forecast, 2019-2031
- 16.1. Market Analysis, Insights and Forecast - By Country/Sub-region
- 16.1.1 United Arab Emirates
- 16.1.2 Saudi Arabia
- 16.1.3 South Africa
- 16.1.4 Rest of Middle East and Africa
- 17. Competitive Analysis
- 17.1. Global Market Share Analysis 2024
- 17.2. Company Profiles
- 17.2.1 Agilysys Inc
- 17.2.1.1. Overview
- 17.2.1.2. Products
- 17.2.1.3. SWOT Analysis
- 17.2.1.4. Recent Developments
- 17.2.1.5. Financials (Based on Availability)
- 17.2.2 Paysafe Holdings UK Limited
- 17.2.2.1. Overview
- 17.2.2.2. Products
- 17.2.2.3. SWOT Analysis
- 17.2.2.4. Recent Developments
- 17.2.2.5. Financials (Based on Availability)
- 17.2.3 Ingenico Group
- 17.2.3.1. Overview
- 17.2.3.2. Products
- 17.2.3.3. SWOT Analysis
- 17.2.3.4. Recent Developments
- 17.2.3.5. Financials (Based on Availability)
- 17.2.4 Mastercard
- 17.2.4.1. Overview
- 17.2.4.2. Products
- 17.2.4.3. SWOT Analysis
- 17.2.4.4. Recent Developments
- 17.2.4.5. Financials (Based on Availability)
- 17.2.5 Pineapple Payments
- 17.2.5.1. Overview
- 17.2.5.2. Products
- 17.2.5.3. SWOT Analysis
- 17.2.5.4. Recent Developments
- 17.2.5.5. Financials (Based on Availability)
- 17.2.6 PayPal Holdings Inc
- 17.2.6.1. Overview
- 17.2.6.2. Products
- 17.2.6.3. SWOT Analysis
- 17.2.6.4. Recent Developments
- 17.2.6.5. Financials (Based on Availability)
- 17.2.7 Total System Services Inc
- 17.2.7.1. Overview
- 17.2.7.2. Products
- 17.2.7.3. SWOT Analysis
- 17.2.7.4. Recent Developments
- 17.2.7.5. Financials (Based on Availability)
- 17.2.8 Thales Group
- 17.2.8.1. Overview
- 17.2.8.2. Products
- 17.2.8.3. SWOT Analysis
- 17.2.8.4. Recent Developments
- 17.2.8.5. Financials (Based on Availability)
- 17.2.9 FIS
- 17.2.9.1. Overview
- 17.2.9.2. Products
- 17.2.9.3. SWOT Analysis
- 17.2.9.4. Recent Developments
- 17.2.9.5. Financials (Based on Availability)
- 17.2.10 Verifone
- 17.2.10.1. Overview
- 17.2.10.2. Products
- 17.2.10.3. SWOT Analysis
- 17.2.10.4. Recent Developments
- 17.2.10.5. Financials (Based on Availability)
- 17.2.1 Agilysys Inc
List of Figures
- Figure 1: Global Payment Platform as a Service Market Revenue Breakdown (Million, %) by Region 2024 & 2032
- Figure 2: North America Payment Platform as a Service Market Revenue (Million), by Country 2024 & 2032
- Figure 3: North America Payment Platform as a Service Market Revenue Share (%), by Country 2024 & 2032
- Figure 4: Europe Payment Platform as a Service Market Revenue (Million), by Country 2024 & 2032
- Figure 5: Europe Payment Platform as a Service Market Revenue Share (%), by Country 2024 & 2032
- Figure 6: Asia Pacific Payment Platform as a Service Market Revenue (Million), by Country 2024 & 2032
- Figure 7: Asia Pacific Payment Platform as a Service Market Revenue Share (%), by Country 2024 & 2032
- Figure 8: South America Payment Platform as a Service Market Revenue (Million), by Country 2024 & 2032
- Figure 9: South America Payment Platform as a Service Market Revenue Share (%), by Country 2024 & 2032
- Figure 10: North America Payment Platform as a Service Market Revenue (Million), by Country 2024 & 2032
- Figure 11: North America Payment Platform as a Service Market Revenue Share (%), by Country 2024 & 2032
- Figure 12: MEA Payment Platform as a Service Market Revenue (Million), by Country 2024 & 2032
- Figure 13: MEA Payment Platform as a Service Market Revenue Share (%), by Country 2024 & 2032
- Figure 14: North America Payment Platform as a Service Market Revenue (Million), by Types of Services 2024 & 2032
- Figure 15: North America Payment Platform as a Service Market Revenue Share (%), by Types of Services 2024 & 2032
- Figure 16: North America Payment Platform as a Service Market Revenue (Million), by End-user Industry 2024 & 2032
- Figure 17: North America Payment Platform as a Service Market Revenue Share (%), by End-user Industry 2024 & 2032
- Figure 18: North America Payment Platform as a Service Market Revenue (Million), by Country 2024 & 2032
- Figure 19: North America Payment Platform as a Service Market Revenue Share (%), by Country 2024 & 2032
- Figure 20: Europe Payment Platform as a Service Market Revenue (Million), by Types of Services 2024 & 2032
- Figure 21: Europe Payment Platform as a Service Market Revenue Share (%), by Types of Services 2024 & 2032
- Figure 22: Europe Payment Platform as a Service Market Revenue (Million), by End-user Industry 2024 & 2032
- Figure 23: Europe Payment Platform as a Service Market Revenue Share (%), by End-user Industry 2024 & 2032
- Figure 24: Europe Payment Platform as a Service Market Revenue (Million), by Country 2024 & 2032
- Figure 25: Europe Payment Platform as a Service Market Revenue Share (%), by Country 2024 & 2032
- Figure 26: Asia Pacific Payment Platform as a Service Market Revenue (Million), by Types of Services 2024 & 2032
- Figure 27: Asia Pacific Payment Platform as a Service Market Revenue Share (%), by Types of Services 2024 & 2032
- Figure 28: Asia Pacific Payment Platform as a Service Market Revenue (Million), by End-user Industry 2024 & 2032
- Figure 29: Asia Pacific Payment Platform as a Service Market Revenue Share (%), by End-user Industry 2024 & 2032
- Figure 30: Asia Pacific Payment Platform as a Service Market Revenue (Million), by Country 2024 & 2032
- Figure 31: Asia Pacific Payment Platform as a Service Market Revenue Share (%), by Country 2024 & 2032
- Figure 32: Latin America Payment Platform as a Service Market Revenue (Million), by Types of Services 2024 & 2032
- Figure 33: Latin America Payment Platform as a Service Market Revenue Share (%), by Types of Services 2024 & 2032
- Figure 34: Latin America Payment Platform as a Service Market Revenue (Million), by End-user Industry 2024 & 2032
- Figure 35: Latin America Payment Platform as a Service Market Revenue Share (%), by End-user Industry 2024 & 2032
- Figure 36: Latin America Payment Platform as a Service Market Revenue (Million), by Country 2024 & 2032
- Figure 37: Latin America Payment Platform as a Service Market Revenue Share (%), by Country 2024 & 2032
- Figure 38: Middle East and Africa Payment Platform as a Service Market Revenue (Million), by Types of Services 2024 & 2032
- Figure 39: Middle East and Africa Payment Platform as a Service Market Revenue Share (%), by Types of Services 2024 & 2032
- Figure 40: Middle East and Africa Payment Platform as a Service Market Revenue (Million), by End-user Industry 2024 & 2032
- Figure 41: Middle East and Africa Payment Platform as a Service Market Revenue Share (%), by End-user Industry 2024 & 2032
- Figure 42: Middle East and Africa Payment Platform as a Service Market Revenue (Million), by Country 2024 & 2032
- Figure 43: Middle East and Africa Payment Platform as a Service Market Revenue Share (%), by Country 2024 & 2032
List of Tables
- Table 1: Global Payment Platform as a Service Market Revenue Million Forecast, by Region 2019 & 2032
- Table 2: Global Payment Platform as a Service Market Revenue Million Forecast, by Types of Services 2019 & 2032
- Table 3: Global Payment Platform as a Service Market Revenue Million Forecast, by End-user Industry 2019 & 2032
- Table 4: Global Payment Platform as a Service Market Revenue Million Forecast, by Region 2019 & 2032
- Table 5: Global Payment Platform as a Service Market Revenue Million Forecast, by Country 2019 & 2032
- Table 6: United States Payment Platform as a Service Market Revenue (Million) Forecast, by Application 2019 & 2032
- Table 7: Canada Payment Platform as a Service Market Revenue (Million) Forecast, by Application 2019 & 2032
- Table 8: Mexico Payment Platform as a Service Market Revenue (Million) Forecast, by Application 2019 & 2032
- Table 9: Global Payment Platform as a Service Market Revenue Million Forecast, by Country 2019 & 2032
- Table 10: Germany Payment Platform as a Service Market Revenue (Million) Forecast, by Application 2019 & 2032
- Table 11: United Kingdom Payment Platform as a Service Market Revenue (Million) Forecast, by Application 2019 & 2032
- Table 12: France Payment Platform as a Service Market Revenue (Million) Forecast, by Application 2019 & 2032
- Table 13: Spain Payment Platform as a Service Market Revenue (Million) Forecast, by Application 2019 & 2032
- Table 14: Italy Payment Platform as a Service Market Revenue (Million) Forecast, by Application 2019 & 2032
- Table 15: Spain Payment Platform as a Service Market Revenue (Million) Forecast, by Application 2019 & 2032
- Table 16: Belgium Payment Platform as a Service Market Revenue (Million) Forecast, by Application 2019 & 2032
- Table 17: Netherland Payment Platform as a Service Market Revenue (Million) Forecast, by Application 2019 & 2032
- Table 18: Nordics Payment Platform as a Service Market Revenue (Million) Forecast, by Application 2019 & 2032
- Table 19: Rest of Europe Payment Platform as a Service Market Revenue (Million) Forecast, by Application 2019 & 2032
- Table 20: Global Payment Platform as a Service Market Revenue Million Forecast, by Country 2019 & 2032
- Table 21: China Payment Platform as a Service Market Revenue (Million) Forecast, by Application 2019 & 2032
- Table 22: Japan Payment Platform as a Service Market Revenue (Million) Forecast, by Application 2019 & 2032
- Table 23: India Payment Platform as a Service Market Revenue (Million) Forecast, by Application 2019 & 2032
- Table 24: South Korea Payment Platform as a Service Market Revenue (Million) Forecast, by Application 2019 & 2032
- Table 25: Southeast Asia Payment Platform as a Service Market Revenue (Million) Forecast, by Application 2019 & 2032
- Table 26: Australia Payment Platform as a Service Market Revenue (Million) Forecast, by Application 2019 & 2032
- Table 27: Indonesia Payment Platform as a Service Market Revenue (Million) Forecast, by Application 2019 & 2032
- Table 28: Phillipes Payment Platform as a Service Market Revenue (Million) Forecast, by Application 2019 & 2032
- Table 29: Singapore Payment Platform as a Service Market Revenue (Million) Forecast, by Application 2019 & 2032
- Table 30: Thailandc Payment Platform as a Service Market Revenue (Million) Forecast, by Application 2019 & 2032
- Table 31: Rest of Asia Pacific Payment Platform as a Service Market Revenue (Million) Forecast, by Application 2019 & 2032
- Table 32: Global Payment Platform as a Service Market Revenue Million Forecast, by Country 2019 & 2032
- Table 33: Brazil Payment Platform as a Service Market Revenue (Million) Forecast, by Application 2019 & 2032
- Table 34: Argentina Payment Platform as a Service Market Revenue (Million) Forecast, by Application 2019 & 2032
- Table 35: Peru Payment Platform as a Service Market Revenue (Million) Forecast, by Application 2019 & 2032
- Table 36: Chile Payment Platform as a Service Market Revenue (Million) Forecast, by Application 2019 & 2032
- Table 37: Colombia Payment Platform as a Service Market Revenue (Million) Forecast, by Application 2019 & 2032
- Table 38: Ecuador Payment Platform as a Service Market Revenue (Million) Forecast, by Application 2019 & 2032
- Table 39: Venezuela Payment Platform as a Service Market Revenue (Million) Forecast, by Application 2019 & 2032
- Table 40: Rest of South America Payment Platform as a Service Market Revenue (Million) Forecast, by Application 2019 & 2032
- Table 41: Global Payment Platform as a Service Market Revenue Million Forecast, by Country 2019 & 2032
- Table 42: United States Payment Platform as a Service Market Revenue (Million) Forecast, by Application 2019 & 2032
- Table 43: Canada Payment Platform as a Service Market Revenue (Million) Forecast, by Application 2019 & 2032
- Table 44: Mexico Payment Platform as a Service Market Revenue (Million) Forecast, by Application 2019 & 2032
- Table 45: Global Payment Platform as a Service Market Revenue Million Forecast, by Country 2019 & 2032
- Table 46: United Arab Emirates Payment Platform as a Service Market Revenue (Million) Forecast, by Application 2019 & 2032
- Table 47: Saudi Arabia Payment Platform as a Service Market Revenue (Million) Forecast, by Application 2019 & 2032
- Table 48: South Africa Payment Platform as a Service Market Revenue (Million) Forecast, by Application 2019 & 2032
- Table 49: Rest of Middle East and Africa Payment Platform as a Service Market Revenue (Million) Forecast, by Application 2019 & 2032
- Table 50: Global Payment Platform as a Service Market Revenue Million Forecast, by Types of Services 2019 & 2032
- Table 51: Global Payment Platform as a Service Market Revenue Million Forecast, by End-user Industry 2019 & 2032
- Table 52: Global Payment Platform as a Service Market Revenue Million Forecast, by Country 2019 & 2032
- Table 53: United States Payment Platform as a Service Market Revenue (Million) Forecast, by Application 2019 & 2032
- Table 54: Canada Payment Platform as a Service Market Revenue (Million) Forecast, by Application 2019 & 2032
- Table 55: Global Payment Platform as a Service Market Revenue Million Forecast, by Types of Services 2019 & 2032
- Table 56: Global Payment Platform as a Service Market Revenue Million Forecast, by End-user Industry 2019 & 2032
- Table 57: Global Payment Platform as a Service Market Revenue Million Forecast, by Country 2019 & 2032
- Table 58: United Kingdom Payment Platform as a Service Market Revenue (Million) Forecast, by Application 2019 & 2032
- Table 59: Germany Payment Platform as a Service Market Revenue (Million) Forecast, by Application 2019 & 2032
- Table 60: France Payment Platform as a Service Market Revenue (Million) Forecast, by Application 2019 & 2032
- Table 61: Rest of Europe Payment Platform as a Service Market Revenue (Million) Forecast, by Application 2019 & 2032
- Table 62: Global Payment Platform as a Service Market Revenue Million Forecast, by Types of Services 2019 & 2032
- Table 63: Global Payment Platform as a Service Market Revenue Million Forecast, by End-user Industry 2019 & 2032
- Table 64: Global Payment Platform as a Service Market Revenue Million Forecast, by Country 2019 & 2032
- Table 65: China Payment Platform as a Service Market Revenue (Million) Forecast, by Application 2019 & 2032
- Table 66: Japan Payment Platform as a Service Market Revenue (Million) Forecast, by Application 2019 & 2032
- Table 67: South Korea Payment Platform as a Service Market Revenue (Million) Forecast, by Application 2019 & 2032
- Table 68: Australia Payment Platform as a Service Market Revenue (Million) Forecast, by Application 2019 & 2032
- Table 69: Rest of Asia Pacific Payment Platform as a Service Market Revenue (Million) Forecast, by Application 2019 & 2032
- Table 70: Global Payment Platform as a Service Market Revenue Million Forecast, by Types of Services 2019 & 2032
- Table 71: Global Payment Platform as a Service Market Revenue Million Forecast, by End-user Industry 2019 & 2032
- Table 72: Global Payment Platform as a Service Market Revenue Million Forecast, by Country 2019 & 2032
- Table 73: Mexico Payment Platform as a Service Market Revenue (Million) Forecast, by Application 2019 & 2032
- Table 74: Brazil Payment Platform as a Service Market Revenue (Million) Forecast, by Application 2019 & 2032
- Table 75: Rest of Latin America Payment Platform as a Service Market Revenue (Million) Forecast, by Application 2019 & 2032
- Table 76: Global Payment Platform as a Service Market Revenue Million Forecast, by Types of Services 2019 & 2032
- Table 77: Global Payment Platform as a Service Market Revenue Million Forecast, by End-user Industry 2019 & 2032
- Table 78: Global Payment Platform as a Service Market Revenue Million Forecast, by Country 2019 & 2032
- Table 79: United Arab Emirates Payment Platform as a Service Market Revenue (Million) Forecast, by Application 2019 & 2032
- Table 80: Saudi Arabia Payment Platform as a Service Market Revenue (Million) Forecast, by Application 2019 & 2032
- Table 81: Rest of Middle East and Africa Payment Platform as a Service Market Revenue (Million) Forecast, by Application 2019 & 2032
Frequently Asked Questions
1. What is the projected Compound Annual Growth Rate (CAGR) of the Payment Platform as a Service Market?
The projected CAGR is approximately 32.26%.
2. Which companies are prominent players in the Payment Platform as a Service Market?
Key companies in the market include Agilysys Inc, Paysafe Holdings UK Limited, Ingenico Group, Mastercard, Pineapple Payments, PayPal Holdings Inc, Total System Services Inc, Thales Group, FIS, Verifone.
3. What are the main segments of the Payment Platform as a Service Market?
The market segments include Types of Services, End-user Industry.
4. Can you provide details about the market size?
The market size is estimated to be USD 10.98 Million as of 2022.
5. What are some drivers contributing to market growth?
Increased Demand for Smartphone Penetration and Incorporation of Online Services; Increase Dependence on E-Commerce Platform.
6. What are the notable trends driving market growth?
Retail Sector Expected to be a Significant Contributor.
7. Are there any restraints impacting market growth?
Absence of Global Standards for Payments.
8. Can you provide examples of recent developments in the market?
November 2022 - Nium, the global platform for Modern Money Movement, launched Nium Airline Payments (NAP), a closed-loop payments solution powered by Universal Air Travel Plan (UATP) to lower payment costs, guarantee acceptance and offer ultra-flexible incentives.
9. What pricing options are available for accessing the report?
Pricing options include single-user, multi-user, and enterprise licenses priced at USD 4750, USD 5250, and USD 8750 respectively.
10. Is the market size provided in terms of value or volume?
The market size is provided in terms of value, measured in Million.
11. Are there any specific market keywords associated with the report?
Yes, the market keyword associated with the report is "Payment Platform as a Service Market," which aids in identifying and referencing the specific market segment covered.
12. How do I determine which pricing option suits my needs best?
The pricing options vary based on user requirements and access needs. Individual users may opt for single-user licenses, while businesses requiring broader access may choose multi-user or enterprise licenses for cost-effective access to the report.
13. Are there any additional resources or data provided in the Payment Platform as a Service Market report?
While the report offers comprehensive insights, it's advisable to review the specific contents or supplementary materials provided to ascertain if additional resources or data are available.
14. How can I stay updated on further developments or reports in the Payment Platform as a Service Market?
To stay informed about further developments, trends, and reports in the Payment Platform as a Service Market, consider subscribing to industry newsletters, following relevant companies and organizations, or regularly checking reputable industry news sources and publications.
Methodology
Step 1 - Identification of Relevant Samples Size from Population Database


Step 2 - Approaches for Defining Global Market Size (Value, Volume* & Price*)

Note*: In applicable scenarios
Step 3 - Data Sources
Primary Research
- Web Analytics
- Survey Reports
- Research Institute
- Latest Research Reports
- Opinion Leaders
Secondary Research
- Annual Reports
- White Paper
- Latest Press Release
- Industry Association
- Paid Database
- Investor Presentations

Step 4 - Data Triangulation
Involves using different sources of information in order to increase the validity of a study
These sources are likely to be stakeholders in a program - participants, other researchers, program staff, other community members, and so on.
Then we put all data in single framework & apply various statistical tools to find out the dynamic on the market.
During the analysis stage, feedback from the stakeholder groups would be compared to determine areas of agreement as well as areas of divergence


