
Key Insights
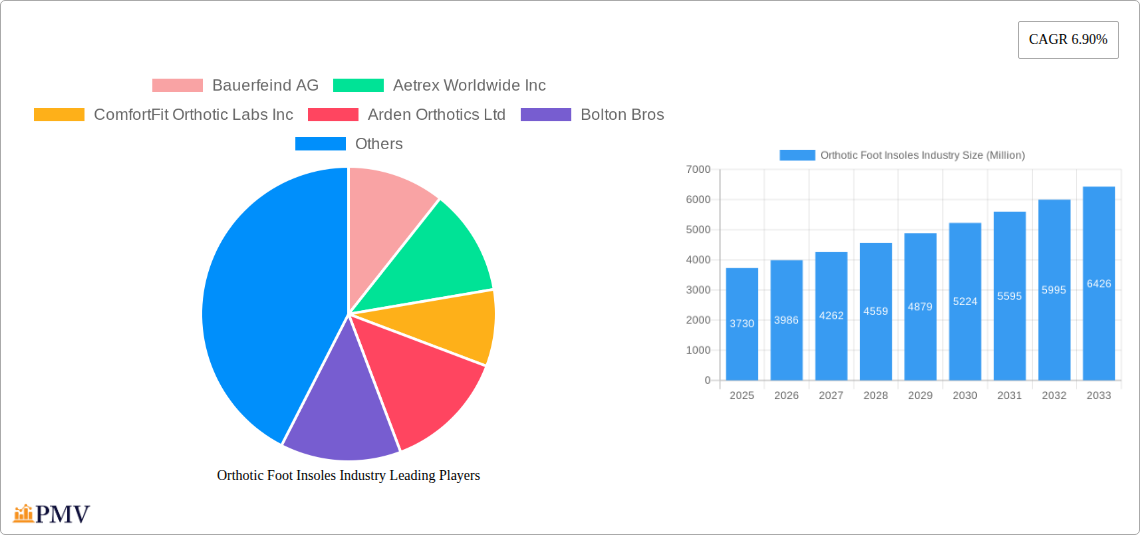
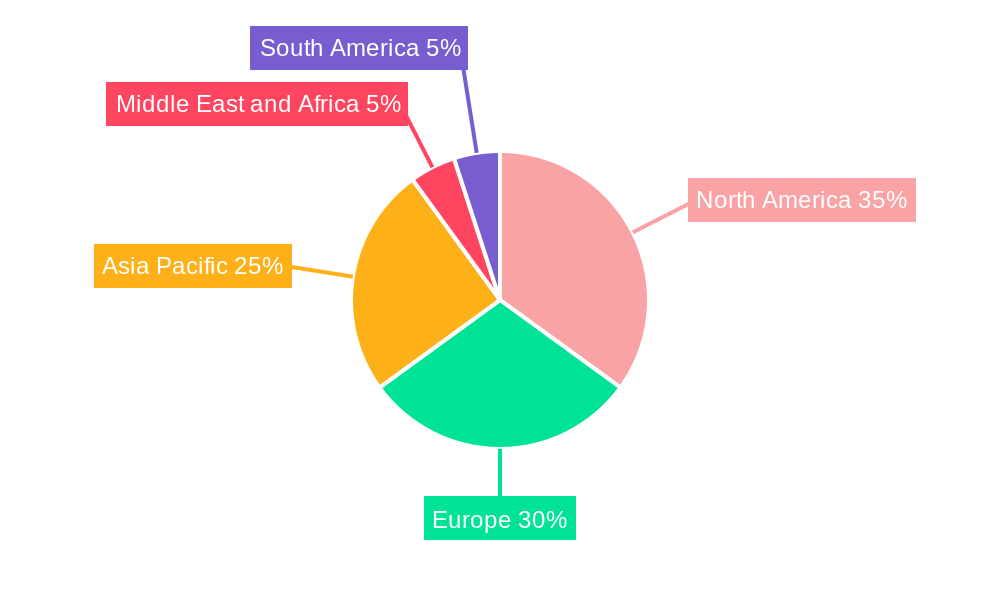
The global orthotic foot insoles market, valued at $3.73 billion in 2025, is projected to experience robust growth, driven by several key factors. Rising prevalence of foot-related ailments like plantar fasciitis, diabetic neuropathy, and arthritis is fueling demand for effective solutions. The aging global population, a significant contributor to these conditions, further accelerates market expansion. Technological advancements in materials science are leading to the development of lighter, more comfortable, and customized insoles, catering to diverse needs and preferences. Increased awareness of the benefits of proper foot support among athletes and individuals seeking enhanced comfort and performance also contributes to market growth. The market is segmented by product type (prefabricated and customized), material (thermoplastics, polyethylene foams, leather, ethyl-vinyl acetates (EVAs), and others), and application (sports and athletics, personal comfort, and medical). The customized segment is expected to witness faster growth due to its ability to address specific foot conditions and provide personalized support. Growth is also geographically diverse, with North America and Europe holding significant market shares, driven by high healthcare expenditure and awareness. However, the market faces restraints including high costs associated with customized insoles and potential variations in product quality.
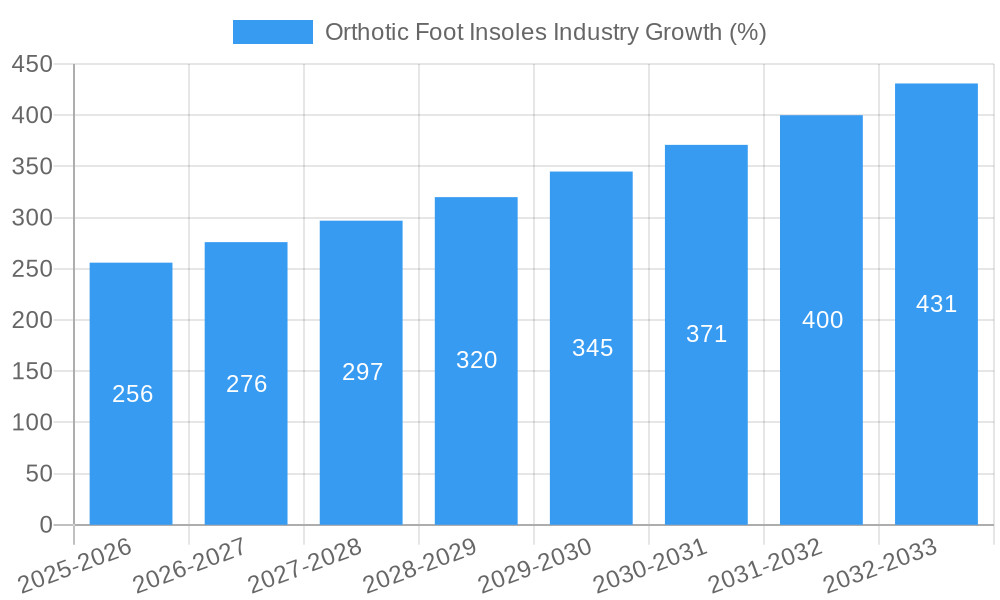
The market's Compound Annual Growth Rate (CAGR) of 6.90% from 2019 to 2024 suggests continued expansion through 2033. To project future market size, we can extrapolate based on this CAGR, acknowledging that this is a simplification of complex market dynamics. Factors like fluctuating raw material prices, evolving consumer preferences, and competitive landscape may influence actual growth. The increasing adoption of e-commerce platforms provides greater accessibility for consumers, while the rising interest in preventative healthcare solutions among younger demographics indicates long-term potential for the market. Key players like Bauerfeind AG, Aetrex Worldwide Inc., and DJO Global Inc. are continuously innovating and expanding their product portfolios to maintain a competitive edge. Strategic partnerships, mergers and acquisitions, and technological collaborations are likely to further shape the industry's landscape in the coming years. Further research into specific regional dynamics and consumer preferences would provide a more granular understanding of the market’s trajectory.
Orthotic Foot Insoles Industry Market Report: 2019-2033
This comprehensive report provides an in-depth analysis of the global orthotic foot insoles market, covering the period from 2019 to 2033. With a base year of 2025 and an estimated year of 2025, this report offers valuable insights into market size, segmentation, growth drivers, challenges, and key players. The forecast period spans from 2025 to 2033, while the historical period analyzed is 2019-2024. The report is designed for industry professionals, investors, and anyone seeking a detailed understanding of this dynamic market. The global market value is projected to reach xx Million by 2033.
Orthotic Foot Insoles Industry Market Structure & Competitive Dynamics
The orthotic foot insoles market exhibits a moderately concentrated structure, with key players like Bauerfeind AG, Aetrex Worldwide Inc, and DJO Global Inc holding significant market share. However, the presence of numerous smaller companies and regional players contributes to a competitive landscape characterized by innovation and differentiation. The market is influenced by evolving regulatory frameworks related to medical devices, with variations across regions impacting product approvals and market access. Product substitution is a factor, with alternatives like over-the-counter insoles and footwear with built-in arch support vying for market share. End-user preferences are increasingly shifting towards customized insoles with advanced features, driving innovation in materials and manufacturing processes. Mergers and acquisitions (M&A) activity is moderate, with deal values in the xx Million range, primarily focusing on consolidating market share and expanding product portfolios. For instance, a recent M&A deal involved a xx Million acquisition aimed at strengthening the presence in the customized insoles segment.
- Market Concentration: Moderately concentrated, with top players holding xx% of market share.
- Innovation Ecosystems: Strong focus on material science, 3D printing, and AI-driven customization.
- Regulatory Frameworks: Varying regulations across regions impact product approvals and market access.
- Product Substitutes: Over-the-counter insoles and specialized footwear pose competition.
- End-User Trends: Growing preference for customized and technologically advanced insoles.
- M&A Activity: Moderate activity with deal values averaging xx Million, focused on market consolidation.
Orthotic Foot Insoles Industry Trends & Insights
The orthotic foot insoles market is experiencing robust growth, driven by rising prevalence of foot-related ailments, increasing awareness of foot health, and growing adoption of sports and athletic activities. The market is projected to witness a CAGR of xx% during the forecast period (2025-2033). Technological advancements such as the integration of AI in manufacturing, as seen with Upstep's recent innovation, are significantly reducing production times and potentially lowering costs. This fuels market expansion and enhances product customization options. Consumer preferences are leaning towards personalized solutions offering improved comfort, support, and performance, fostering the growth of the customized insoles segment. Competitive dynamics are characterized by both innovation in product features and materials and aggressive pricing strategies by smaller players attempting to gain market share. The market penetration of customized insoles is steadily increasing, fueled by advancements in 3D scanning and personalized manufacturing technologies.
Dominant Markets & Segments in Orthotic Foot Insoles Industry
The North American market holds a leading position in the orthotic foot insoles industry, driven by high healthcare expenditure, strong awareness of foot health, and a large aging population. Within the product segment, customized insoles are experiencing faster growth compared to prefabricated insoles, attributed to rising demand for personalized solutions. In terms of materials, thermoplastics and ethyl-vinyl acetates (EVAs) dominate due to their cost-effectiveness and performance characteristics. However, the use of other advanced materials is gaining traction, with growing demand for superior comfort and performance. The medical application segment dominates overall market share, driven by the increasing prevalence of foot-related conditions requiring orthotic intervention.
- Key Drivers for North American Dominance:
- High healthcare expenditure.
- Strong awareness of foot health among consumers.
- Large aging population requiring foot care solutions.
- Product Segmentation: Customized insoles exhibiting faster growth than prefabricated insoles.
- Material Segmentation: Thermoplastics and EVAs lead; other advanced materials are gaining traction.
- Application Segmentation: Medical application segment holds the largest market share.
Orthotic Foot Insoles Industry Product Innovations
Recent innovations in the orthotic foot insoles market are focused on enhanced customization, improved comfort, and advanced materials. AI-powered manufacturing is drastically reducing production lead times, while the introduction of new materials like improved foams and polymers is improving cushioning and support. Companies are also integrating advanced biomechanical sensors to provide real-time feedback on foot pressure and movement, leading to more effective and personalized orthotic designs. The market is witnessing a strong push toward creating more lightweight, durable, and aesthetically pleasing insoles to meet changing consumer preferences.
Report Segmentation & Scope
This report segments the orthotic foot insoles market across various parameters:
Product: Prefabricated insoles represent a larger market share initially, but customized insoles are exhibiting faster growth due to the increasing demand for personalized solutions. This segment is expected to reach xx Million by 2033.
Material: Thermoplastics, polyethylene foams, leather, ethyl-vinyl acetates (EVAs), and other materials are analyzed, with thermoplastics and EVAs holding the largest market share due to their cost-effectiveness and performance. The "other materials" segment is expected to show significant growth due to the introduction of new advanced materials.
Application: The report analyzes the market across sports and athletics, personal comfort, and medical applications. The medical application segment is currently the largest, driven by a rising prevalence of foot-related diseases. However, the sports and athletics segment is showing strong growth due to increasing participation in sports and fitness activities.
Key Drivers of Orthotic Foot Insoles Industry Growth
The orthotic foot insoles market is fueled by several key factors:
- Rising prevalence of foot-related disorders: Conditions like plantar fasciitis, flat feet, and bunions are driving demand for orthotic support.
- Growing awareness of foot health: Increased public awareness through healthcare professionals and online resources is contributing to higher demand.
- Technological advancements: Innovations in materials science and manufacturing technologies are leading to improved product features and customization.
- Increasing participation in sports and athletic activities: Athletes and fitness enthusiasts represent a significant consumer base.
- Aging population: An increasing aging population globally contributes to higher demand for foot health solutions.
Challenges in the Orthotic Foot Insoles Industry Sector
The orthotic foot insoles market faces challenges like:
- Stringent regulatory requirements: Varying and complex regulations for medical-grade insoles across different countries create hurdles for market entry and expansion.
- Supply chain disruptions: Global events and economic factors can impact the availability of raw materials and manufacturing capacity.
- Intense competition: The market includes both large established players and smaller innovative companies, creating a competitive landscape. Pricing pressures, particularly from low-cost competitors, can impact profitability.
Leading Players in the Orthotic Foot Insoles Industry Market
- Bauerfeind AG
- Aetrex Worldwide Inc
- ComfortFit Orthotic Labs Inc
- Arden Orthotics Ltd
- Bolton Bros
- Dr Scholl's
- DJO Global Inc
- Acor Orthopedic Inc
- Algeo Limited
- KLM Laboratories Inc
Key Developments in Orthotic Foot Insoles Industry Sector
- July 2022: Foot Levelers launched InMotion+, a technologically advanced custom orthotic.
- November 2022: Upstep launched an AI-powered system for faster customized insole manufacturing.
Strategic Orthotic Foot Insoles Industry Market Outlook
The future of the orthotic foot insoles market looks promising, with continued growth driven by technological advancements, increasing healthcare awareness, and a growing aging population. Strategic opportunities exist in developing innovative products catering to specific needs, expanding into emerging markets, and leveraging AI and data analytics for enhanced personalization and customer engagement. The focus on sustainable and eco-friendly materials also presents a significant growth opportunity. Furthermore, strategic partnerships and collaborations with healthcare professionals and athletic organizations can significantly boost market reach and penetration.
Orthotic Foot Insoles Industry Segmentation
-
1. Product
- 1.1. Prefabricated
- 1.2. Customized
-
2. Material
- 2.1. Thermoplastics
- 2.2. Polyethylene Foams
- 2.3. Leather
- 2.4. Ethyl-Vinyl Acetates (EVAs)
- 2.5. Other Materials
-
3. Application
- 3.1. Sports and Athletics
- 3.2. Personal Comfort
- 3.3. Medical
Orthotic Foot Insoles Industry Segmentation By Geography
-
1. North America
- 1.1. United States
- 1.2. Canada
- 1.3. Mexico
-
2. Europe
- 2.1. Germany
- 2.2. United Kingdom
- 2.3. France
- 2.4. Italy
- 2.5. Spain
- 2.6. Rest of Europe
-
3. Asia Pacific
- 3.1. China
- 3.2. Japan
- 3.3. India
- 3.4. Australia
- 3.5. South Korea
- 3.6. Rest of Asia Pacific
-
4. Middle East and Africa
- 4.1. GCC
- 4.2. South Africa
- 4.3. Rest of Middle East and Africa
-
5. South America
- 5.1. Brazil
- 5.2. Argentina
- 5.3. Rest of South America
Orthotic Foot Insoles Industry REPORT HIGHLIGHTS
| Aspects | Details |
|---|---|
| Study Period | 2019-2033 |
| Base Year | 2024 |
| Estimated Year | 2025 |
| Forecast Period | 2025-2033 |
| Historical Period | 2019-2024 |
| Growth Rate | CAGR of 6.90% from 2019-2033 |
| Segmentation |
|
Table of Contents
- 1. Introduction
- 1.1. Research Scope
- 1.2. Market Segmentation
- 1.3. Research Methodology
- 1.4. Definitions and Assumptions
- 2. Executive Summary
- 2.1. Introduction
- 3. Market Dynamics
- 3.1. Introduction
- 3.2. Market Drivers
- 3.2.1. Rising Adoption of Customized Orthotic Insoles to Reduce Pain; Significant Rise in Geriatric Population and Prevalence of Diabetes; Increasing Health Issues Coupled with Increasing Incidence of Chronic Pain
- 3.3. Market Restrains
- 3.3.1. Limited Awareness About Orthotics Among Population
- 3.4. Market Trends
- 3.4.1. Sports and Athletics by End-User Segment is Expected to Witness Significant Growth in the Market
- 4. Market Factor Analysis
- 4.1. Porters Five Forces
- 4.2. Supply/Value Chain
- 4.3. PESTEL analysis
- 4.4. Market Entropy
- 4.5. Patent/Trademark Analysis
- 5. Global Orthotic Foot Insoles Industry Analysis, Insights and Forecast, 2019-2031
- 5.1. Market Analysis, Insights and Forecast - by Product
- 5.1.1. Prefabricated
- 5.1.2. Customized
- 5.2. Market Analysis, Insights and Forecast - by Material
- 5.2.1. Thermoplastics
- 5.2.2. Polyethylene Foams
- 5.2.3. Leather
- 5.2.4. Ethyl-Vinyl Acetates (EVAs)
- 5.2.5. Other Materials
- 5.3. Market Analysis, Insights and Forecast - by Application
- 5.3.1. Sports and Athletics
- 5.3.2. Personal Comfort
- 5.3.3. Medical
- 5.4. Market Analysis, Insights and Forecast - by Region
- 5.4.1. North America
- 5.4.2. Europe
- 5.4.3. Asia Pacific
- 5.4.4. Middle East and Africa
- 5.4.5. South America
- 5.1. Market Analysis, Insights and Forecast - by Product
- 6. North America Orthotic Foot Insoles Industry Analysis, Insights and Forecast, 2019-2031
- 6.1. Market Analysis, Insights and Forecast - by Product
- 6.1.1. Prefabricated
- 6.1.2. Customized
- 6.2. Market Analysis, Insights and Forecast - by Material
- 6.2.1. Thermoplastics
- 6.2.2. Polyethylene Foams
- 6.2.3. Leather
- 6.2.4. Ethyl-Vinyl Acetates (EVAs)
- 6.2.5. Other Materials
- 6.3. Market Analysis, Insights and Forecast - by Application
- 6.3.1. Sports and Athletics
- 6.3.2. Personal Comfort
- 6.3.3. Medical
- 6.1. Market Analysis, Insights and Forecast - by Product
- 7. Europe Orthotic Foot Insoles Industry Analysis, Insights and Forecast, 2019-2031
- 7.1. Market Analysis, Insights and Forecast - by Product
- 7.1.1. Prefabricated
- 7.1.2. Customized
- 7.2. Market Analysis, Insights and Forecast - by Material
- 7.2.1. Thermoplastics
- 7.2.2. Polyethylene Foams
- 7.2.3. Leather
- 7.2.4. Ethyl-Vinyl Acetates (EVAs)
- 7.2.5. Other Materials
- 7.3. Market Analysis, Insights and Forecast - by Application
- 7.3.1. Sports and Athletics
- 7.3.2. Personal Comfort
- 7.3.3. Medical
- 7.1. Market Analysis, Insights and Forecast - by Product
- 8. Asia Pacific Orthotic Foot Insoles Industry Analysis, Insights and Forecast, 2019-2031
- 8.1. Market Analysis, Insights and Forecast - by Product
- 8.1.1. Prefabricated
- 8.1.2. Customized
- 8.2. Market Analysis, Insights and Forecast - by Material
- 8.2.1. Thermoplastics
- 8.2.2. Polyethylene Foams
- 8.2.3. Leather
- 8.2.4. Ethyl-Vinyl Acetates (EVAs)
- 8.2.5. Other Materials
- 8.3. Market Analysis, Insights and Forecast - by Application
- 8.3.1. Sports and Athletics
- 8.3.2. Personal Comfort
- 8.3.3. Medical
- 8.1. Market Analysis, Insights and Forecast - by Product
- 9. Middle East and Africa Orthotic Foot Insoles Industry Analysis, Insights and Forecast, 2019-2031
- 9.1. Market Analysis, Insights and Forecast - by Product
- 9.1.1. Prefabricated
- 9.1.2. Customized
- 9.2. Market Analysis, Insights and Forecast - by Material
- 9.2.1. Thermoplastics
- 9.2.2. Polyethylene Foams
- 9.2.3. Leather
- 9.2.4. Ethyl-Vinyl Acetates (EVAs)
- 9.2.5. Other Materials
- 9.3. Market Analysis, Insights and Forecast - by Application
- 9.3.1. Sports and Athletics
- 9.3.2. Personal Comfort
- 9.3.3. Medical
- 9.1. Market Analysis, Insights and Forecast - by Product
- 10. South America Orthotic Foot Insoles Industry Analysis, Insights and Forecast, 2019-2031
- 10.1. Market Analysis, Insights and Forecast - by Product
- 10.1.1. Prefabricated
- 10.1.2. Customized
- 10.2. Market Analysis, Insights and Forecast - by Material
- 10.2.1. Thermoplastics
- 10.2.2. Polyethylene Foams
- 10.2.3. Leather
- 10.2.4. Ethyl-Vinyl Acetates (EVAs)
- 10.2.5. Other Materials
- 10.3. Market Analysis, Insights and Forecast - by Application
- 10.3.1. Sports and Athletics
- 10.3.2. Personal Comfort
- 10.3.3. Medical
- 10.1. Market Analysis, Insights and Forecast - by Product
- 11. North America Orthotic Foot Insoles Industry Analysis, Insights and Forecast, 2019-2031
- 11.1. Market Analysis, Insights and Forecast - By Country/Sub-region
- 11.1.1 United States
- 11.1.2 Canada
- 11.1.3 Mexico
- 12. Europe Orthotic Foot Insoles Industry Analysis, Insights and Forecast, 2019-2031
- 12.1. Market Analysis, Insights and Forecast - By Country/Sub-region
- 12.1.1 Germany
- 12.1.2 United Kingdom
- 12.1.3 France
- 12.1.4 Italy
- 12.1.5 Spain
- 12.1.6 Rest of Europe
- 13. Asia Pacific Orthotic Foot Insoles Industry Analysis, Insights and Forecast, 2019-2031
- 13.1. Market Analysis, Insights and Forecast - By Country/Sub-region
- 13.1.1 China
- 13.1.2 Japan
- 13.1.3 India
- 13.1.4 Australia
- 13.1.5 South Korea
- 13.1.6 Rest of Asia Pacific
- 14. Middle East and Africa Orthotic Foot Insoles Industry Analysis, Insights and Forecast, 2019-2031
- 14.1. Market Analysis, Insights and Forecast - By Country/Sub-region
- 14.1.1 GCC
- 14.1.2 South Africa
- 14.1.3 Rest of Middle East and Africa
- 15. South America Orthotic Foot Insoles Industry Analysis, Insights and Forecast, 2019-2031
- 15.1. Market Analysis, Insights and Forecast - By Country/Sub-region
- 15.1.1 Brazil
- 15.1.2 Argentina
- 15.1.3 Rest of South America
- 16. Competitive Analysis
- 16.1. Global Market Share Analysis 2024
- 16.2. Company Profiles
- 16.2.1 Bauerfeind AG
- 16.2.1.1. Overview
- 16.2.1.2. Products
- 16.2.1.3. SWOT Analysis
- 16.2.1.4. Recent Developments
- 16.2.1.5. Financials (Based on Availability)
- 16.2.2 Aetrex Worldwide Inc
- 16.2.2.1. Overview
- 16.2.2.2. Products
- 16.2.2.3. SWOT Analysis
- 16.2.2.4. Recent Developments
- 16.2.2.5. Financials (Based on Availability)
- 16.2.3 ComfortFit Orthotic Labs Inc
- 16.2.3.1. Overview
- 16.2.3.2. Products
- 16.2.3.3. SWOT Analysis
- 16.2.3.4. Recent Developments
- 16.2.3.5. Financials (Based on Availability)
- 16.2.4 Arden Orthotics Ltd
- 16.2.4.1. Overview
- 16.2.4.2. Products
- 16.2.4.3. SWOT Analysis
- 16.2.4.4. Recent Developments
- 16.2.4.5. Financials (Based on Availability)
- 16.2.5 Bolton Bros
- 16.2.5.1. Overview
- 16.2.5.2. Products
- 16.2.5.3. SWOT Analysis
- 16.2.5.4. Recent Developments
- 16.2.5.5. Financials (Based on Availability)
- 16.2.6 Dr Scholl's
- 16.2.6.1. Overview
- 16.2.6.2. Products
- 16.2.6.3. SWOT Analysis
- 16.2.6.4. Recent Developments
- 16.2.6.5. Financials (Based on Availability)
- 16.2.7 DJO Global Inc
- 16.2.7.1. Overview
- 16.2.7.2. Products
- 16.2.7.3. SWOT Analysis
- 16.2.7.4. Recent Developments
- 16.2.7.5. Financials (Based on Availability)
- 16.2.8 Acor Orthopedic Inc
- 16.2.8.1. Overview
- 16.2.8.2. Products
- 16.2.8.3. SWOT Analysis
- 16.2.8.4. Recent Developments
- 16.2.8.5. Financials (Based on Availability)
- 16.2.9 Algeo Limited
- 16.2.9.1. Overview
- 16.2.9.2. Products
- 16.2.9.3. SWOT Analysis
- 16.2.9.4. Recent Developments
- 16.2.9.5. Financials (Based on Availability)
- 16.2.10 KLM Laboratories Inc
- 16.2.10.1. Overview
- 16.2.10.2. Products
- 16.2.10.3. SWOT Analysis
- 16.2.10.4. Recent Developments
- 16.2.10.5. Financials (Based on Availability)
- 16.2.1 Bauerfeind AG
List of Figures
- Figure 1: Global Orthotic Foot Insoles Industry Revenue Breakdown (Million, %) by Region 2024 & 2032
- Figure 2: North America Orthotic Foot Insoles Industry Revenue (Million), by Country 2024 & 2032
- Figure 3: North America Orthotic Foot Insoles Industry Revenue Share (%), by Country 2024 & 2032
- Figure 4: Europe Orthotic Foot Insoles Industry Revenue (Million), by Country 2024 & 2032
- Figure 5: Europe Orthotic Foot Insoles Industry Revenue Share (%), by Country 2024 & 2032
- Figure 6: Asia Pacific Orthotic Foot Insoles Industry Revenue (Million), by Country 2024 & 2032
- Figure 7: Asia Pacific Orthotic Foot Insoles Industry Revenue Share (%), by Country 2024 & 2032
- Figure 8: Middle East and Africa Orthotic Foot Insoles Industry Revenue (Million), by Country 2024 & 2032
- Figure 9: Middle East and Africa Orthotic Foot Insoles Industry Revenue Share (%), by Country 2024 & 2032
- Figure 10: South America Orthotic Foot Insoles Industry Revenue (Million), by Country 2024 & 2032
- Figure 11: South America Orthotic Foot Insoles Industry Revenue Share (%), by Country 2024 & 2032
- Figure 12: North America Orthotic Foot Insoles Industry Revenue (Million), by Product 2024 & 2032
- Figure 13: North America Orthotic Foot Insoles Industry Revenue Share (%), by Product 2024 & 2032
- Figure 14: North America Orthotic Foot Insoles Industry Revenue (Million), by Material 2024 & 2032
- Figure 15: North America Orthotic Foot Insoles Industry Revenue Share (%), by Material 2024 & 2032
- Figure 16: North America Orthotic Foot Insoles Industry Revenue (Million), by Application 2024 & 2032
- Figure 17: North America Orthotic Foot Insoles Industry Revenue Share (%), by Application 2024 & 2032
- Figure 18: North America Orthotic Foot Insoles Industry Revenue (Million), by Country 2024 & 2032
- Figure 19: North America Orthotic Foot Insoles Industry Revenue Share (%), by Country 2024 & 2032
- Figure 20: Europe Orthotic Foot Insoles Industry Revenue (Million), by Product 2024 & 2032
- Figure 21: Europe Orthotic Foot Insoles Industry Revenue Share (%), by Product 2024 & 2032
- Figure 22: Europe Orthotic Foot Insoles Industry Revenue (Million), by Material 2024 & 2032
- Figure 23: Europe Orthotic Foot Insoles Industry Revenue Share (%), by Material 2024 & 2032
- Figure 24: Europe Orthotic Foot Insoles Industry Revenue (Million), by Application 2024 & 2032
- Figure 25: Europe Orthotic Foot Insoles Industry Revenue Share (%), by Application 2024 & 2032
- Figure 26: Europe Orthotic Foot Insoles Industry Revenue (Million), by Country 2024 & 2032
- Figure 27: Europe Orthotic Foot Insoles Industry Revenue Share (%), by Country 2024 & 2032
- Figure 28: Asia Pacific Orthotic Foot Insoles Industry Revenue (Million), by Product 2024 & 2032
- Figure 29: Asia Pacific Orthotic Foot Insoles Industry Revenue Share (%), by Product 2024 & 2032
- Figure 30: Asia Pacific Orthotic Foot Insoles Industry Revenue (Million), by Material 2024 & 2032
- Figure 31: Asia Pacific Orthotic Foot Insoles Industry Revenue Share (%), by Material 2024 & 2032
- Figure 32: Asia Pacific Orthotic Foot Insoles Industry Revenue (Million), by Application 2024 & 2032
- Figure 33: Asia Pacific Orthotic Foot Insoles Industry Revenue Share (%), by Application 2024 & 2032
- Figure 34: Asia Pacific Orthotic Foot Insoles Industry Revenue (Million), by Country 2024 & 2032
- Figure 35: Asia Pacific Orthotic Foot Insoles Industry Revenue Share (%), by Country 2024 & 2032
- Figure 36: Middle East and Africa Orthotic Foot Insoles Industry Revenue (Million), by Product 2024 & 2032
- Figure 37: Middle East and Africa Orthotic Foot Insoles Industry Revenue Share (%), by Product 2024 & 2032
- Figure 38: Middle East and Africa Orthotic Foot Insoles Industry Revenue (Million), by Material 2024 & 2032
- Figure 39: Middle East and Africa Orthotic Foot Insoles Industry Revenue Share (%), by Material 2024 & 2032
- Figure 40: Middle East and Africa Orthotic Foot Insoles Industry Revenue (Million), by Application 2024 & 2032
- Figure 41: Middle East and Africa Orthotic Foot Insoles Industry Revenue Share (%), by Application 2024 & 2032
- Figure 42: Middle East and Africa Orthotic Foot Insoles Industry Revenue (Million), by Country 2024 & 2032
- Figure 43: Middle East and Africa Orthotic Foot Insoles Industry Revenue Share (%), by Country 2024 & 2032
- Figure 44: South America Orthotic Foot Insoles Industry Revenue (Million), by Product 2024 & 2032
- Figure 45: South America Orthotic Foot Insoles Industry Revenue Share (%), by Product 2024 & 2032
- Figure 46: South America Orthotic Foot Insoles Industry Revenue (Million), by Material 2024 & 2032
- Figure 47: South America Orthotic Foot Insoles Industry Revenue Share (%), by Material 2024 & 2032
- Figure 48: South America Orthotic Foot Insoles Industry Revenue (Million), by Application 2024 & 2032
- Figure 49: South America Orthotic Foot Insoles Industry Revenue Share (%), by Application 2024 & 2032
- Figure 50: South America Orthotic Foot Insoles Industry Revenue (Million), by Country 2024 & 2032
- Figure 51: South America Orthotic Foot Insoles Industry Revenue Share (%), by Country 2024 & 2032
List of Tables
- Table 1: Global Orthotic Foot Insoles Industry Revenue Million Forecast, by Region 2019 & 2032
- Table 2: Global Orthotic Foot Insoles Industry Revenue Million Forecast, by Product 2019 & 2032
- Table 3: Global Orthotic Foot Insoles Industry Revenue Million Forecast, by Material 2019 & 2032
- Table 4: Global Orthotic Foot Insoles Industry Revenue Million Forecast, by Application 2019 & 2032
- Table 5: Global Orthotic Foot Insoles Industry Revenue Million Forecast, by Region 2019 & 2032
- Table 6: Global Orthotic Foot Insoles Industry Revenue Million Forecast, by Country 2019 & 2032
- Table 7: United States Orthotic Foot Insoles Industry Revenue (Million) Forecast, by Application 2019 & 2032
- Table 8: Canada Orthotic Foot Insoles Industry Revenue (Million) Forecast, by Application 2019 & 2032
- Table 9: Mexico Orthotic Foot Insoles Industry Revenue (Million) Forecast, by Application 2019 & 2032
- Table 10: Global Orthotic Foot Insoles Industry Revenue Million Forecast, by Country 2019 & 2032
- Table 11: Germany Orthotic Foot Insoles Industry Revenue (Million) Forecast, by Application 2019 & 2032
- Table 12: United Kingdom Orthotic Foot Insoles Industry Revenue (Million) Forecast, by Application 2019 & 2032
- Table 13: France Orthotic Foot Insoles Industry Revenue (Million) Forecast, by Application 2019 & 2032
- Table 14: Italy Orthotic Foot Insoles Industry Revenue (Million) Forecast, by Application 2019 & 2032
- Table 15: Spain Orthotic Foot Insoles Industry Revenue (Million) Forecast, by Application 2019 & 2032
- Table 16: Rest of Europe Orthotic Foot Insoles Industry Revenue (Million) Forecast, by Application 2019 & 2032
- Table 17: Global Orthotic Foot Insoles Industry Revenue Million Forecast, by Country 2019 & 2032
- Table 18: China Orthotic Foot Insoles Industry Revenue (Million) Forecast, by Application 2019 & 2032
- Table 19: Japan Orthotic Foot Insoles Industry Revenue (Million) Forecast, by Application 2019 & 2032
- Table 20: India Orthotic Foot Insoles Industry Revenue (Million) Forecast, by Application 2019 & 2032
- Table 21: Australia Orthotic Foot Insoles Industry Revenue (Million) Forecast, by Application 2019 & 2032
- Table 22: South Korea Orthotic Foot Insoles Industry Revenue (Million) Forecast, by Application 2019 & 2032
- Table 23: Rest of Asia Pacific Orthotic Foot Insoles Industry Revenue (Million) Forecast, by Application 2019 & 2032
- Table 24: Global Orthotic Foot Insoles Industry Revenue Million Forecast, by Country 2019 & 2032
- Table 25: GCC Orthotic Foot Insoles Industry Revenue (Million) Forecast, by Application 2019 & 2032
- Table 26: South Africa Orthotic Foot Insoles Industry Revenue (Million) Forecast, by Application 2019 & 2032
- Table 27: Rest of Middle East and Africa Orthotic Foot Insoles Industry Revenue (Million) Forecast, by Application 2019 & 2032
- Table 28: Global Orthotic Foot Insoles Industry Revenue Million Forecast, by Country 2019 & 2032
- Table 29: Brazil Orthotic Foot Insoles Industry Revenue (Million) Forecast, by Application 2019 & 2032
- Table 30: Argentina Orthotic Foot Insoles Industry Revenue (Million) Forecast, by Application 2019 & 2032
- Table 31: Rest of South America Orthotic Foot Insoles Industry Revenue (Million) Forecast, by Application 2019 & 2032
- Table 32: Global Orthotic Foot Insoles Industry Revenue Million Forecast, by Product 2019 & 2032
- Table 33: Global Orthotic Foot Insoles Industry Revenue Million Forecast, by Material 2019 & 2032
- Table 34: Global Orthotic Foot Insoles Industry Revenue Million Forecast, by Application 2019 & 2032
- Table 35: Global Orthotic Foot Insoles Industry Revenue Million Forecast, by Country 2019 & 2032
- Table 36: United States Orthotic Foot Insoles Industry Revenue (Million) Forecast, by Application 2019 & 2032
- Table 37: Canada Orthotic Foot Insoles Industry Revenue (Million) Forecast, by Application 2019 & 2032
- Table 38: Mexico Orthotic Foot Insoles Industry Revenue (Million) Forecast, by Application 2019 & 2032
- Table 39: Global Orthotic Foot Insoles Industry Revenue Million Forecast, by Product 2019 & 2032
- Table 40: Global Orthotic Foot Insoles Industry Revenue Million Forecast, by Material 2019 & 2032
- Table 41: Global Orthotic Foot Insoles Industry Revenue Million Forecast, by Application 2019 & 2032
- Table 42: Global Orthotic Foot Insoles Industry Revenue Million Forecast, by Country 2019 & 2032
- Table 43: Germany Orthotic Foot Insoles Industry Revenue (Million) Forecast, by Application 2019 & 2032
- Table 44: United Kingdom Orthotic Foot Insoles Industry Revenue (Million) Forecast, by Application 2019 & 2032
- Table 45: France Orthotic Foot Insoles Industry Revenue (Million) Forecast, by Application 2019 & 2032
- Table 46: Italy Orthotic Foot Insoles Industry Revenue (Million) Forecast, by Application 2019 & 2032
- Table 47: Spain Orthotic Foot Insoles Industry Revenue (Million) Forecast, by Application 2019 & 2032
- Table 48: Rest of Europe Orthotic Foot Insoles Industry Revenue (Million) Forecast, by Application 2019 & 2032
- Table 49: Global Orthotic Foot Insoles Industry Revenue Million Forecast, by Product 2019 & 2032
- Table 50: Global Orthotic Foot Insoles Industry Revenue Million Forecast, by Material 2019 & 2032
- Table 51: Global Orthotic Foot Insoles Industry Revenue Million Forecast, by Application 2019 & 2032
- Table 52: Global Orthotic Foot Insoles Industry Revenue Million Forecast, by Country 2019 & 2032
- Table 53: China Orthotic Foot Insoles Industry Revenue (Million) Forecast, by Application 2019 & 2032
- Table 54: Japan Orthotic Foot Insoles Industry Revenue (Million) Forecast, by Application 2019 & 2032
- Table 55: India Orthotic Foot Insoles Industry Revenue (Million) Forecast, by Application 2019 & 2032
- Table 56: Australia Orthotic Foot Insoles Industry Revenue (Million) Forecast, by Application 2019 & 2032
- Table 57: South Korea Orthotic Foot Insoles Industry Revenue (Million) Forecast, by Application 2019 & 2032
- Table 58: Rest of Asia Pacific Orthotic Foot Insoles Industry Revenue (Million) Forecast, by Application 2019 & 2032
- Table 59: Global Orthotic Foot Insoles Industry Revenue Million Forecast, by Product 2019 & 2032
- Table 60: Global Orthotic Foot Insoles Industry Revenue Million Forecast, by Material 2019 & 2032
- Table 61: Global Orthotic Foot Insoles Industry Revenue Million Forecast, by Application 2019 & 2032
- Table 62: Global Orthotic Foot Insoles Industry Revenue Million Forecast, by Country 2019 & 2032
- Table 63: GCC Orthotic Foot Insoles Industry Revenue (Million) Forecast, by Application 2019 & 2032
- Table 64: South Africa Orthotic Foot Insoles Industry Revenue (Million) Forecast, by Application 2019 & 2032
- Table 65: Rest of Middle East and Africa Orthotic Foot Insoles Industry Revenue (Million) Forecast, by Application 2019 & 2032
- Table 66: Global Orthotic Foot Insoles Industry Revenue Million Forecast, by Product 2019 & 2032
- Table 67: Global Orthotic Foot Insoles Industry Revenue Million Forecast, by Material 2019 & 2032
- Table 68: Global Orthotic Foot Insoles Industry Revenue Million Forecast, by Application 2019 & 2032
- Table 69: Global Orthotic Foot Insoles Industry Revenue Million Forecast, by Country 2019 & 2032
- Table 70: Brazil Orthotic Foot Insoles Industry Revenue (Million) Forecast, by Application 2019 & 2032
- Table 71: Argentina Orthotic Foot Insoles Industry Revenue (Million) Forecast, by Application 2019 & 2032
- Table 72: Rest of South America Orthotic Foot Insoles Industry Revenue (Million) Forecast, by Application 2019 & 2032
Frequently Asked Questions
1. What is the projected Compound Annual Growth Rate (CAGR) of the Orthotic Foot Insoles Industry?
The projected CAGR is approximately 6.90%.
2. Which companies are prominent players in the Orthotic Foot Insoles Industry?
Key companies in the market include Bauerfeind AG, Aetrex Worldwide Inc, ComfortFit Orthotic Labs Inc, Arden Orthotics Ltd, Bolton Bros, Dr Scholl's, DJO Global Inc, Acor Orthopedic Inc, Algeo Limited, KLM Laboratories Inc.
3. What are the main segments of the Orthotic Foot Insoles Industry?
The market segments include Product, Material, Application.
4. Can you provide details about the market size?
The market size is estimated to be USD 3.73 Million as of 2022.
5. What are some drivers contributing to market growth?
Rising Adoption of Customized Orthotic Insoles to Reduce Pain; Significant Rise in Geriatric Population and Prevalence of Diabetes; Increasing Health Issues Coupled with Increasing Incidence of Chronic Pain.
6. What are the notable trends driving market growth?
Sports and Athletics by End-User Segment is Expected to Witness Significant Growth in the Market.
7. Are there any restraints impacting market growth?
Limited Awareness About Orthotics Among Population.
8. Can you provide examples of recent developments in the market?
November 2022: Insoles company Upstep launched the first technology system of its kind with artificial intelligence, which enables a 50% reduction in the time it takes to manufacture customized insoles.
9. What pricing options are available for accessing the report?
Pricing options include single-user, multi-user, and enterprise licenses priced at USD 4750, USD 5250, and USD 8750 respectively.
10. Is the market size provided in terms of value or volume?
The market size is provided in terms of value, measured in Million.
11. Are there any specific market keywords associated with the report?
Yes, the market keyword associated with the report is "Orthotic Foot Insoles Industry," which aids in identifying and referencing the specific market segment covered.
12. How do I determine which pricing option suits my needs best?
The pricing options vary based on user requirements and access needs. Individual users may opt for single-user licenses, while businesses requiring broader access may choose multi-user or enterprise licenses for cost-effective access to the report.
13. Are there any additional resources or data provided in the Orthotic Foot Insoles Industry report?
While the report offers comprehensive insights, it's advisable to review the specific contents or supplementary materials provided to ascertain if additional resources or data are available.
14. How can I stay updated on further developments or reports in the Orthotic Foot Insoles Industry?
To stay informed about further developments, trends, and reports in the Orthotic Foot Insoles Industry, consider subscribing to industry newsletters, following relevant companies and organizations, or regularly checking reputable industry news sources and publications.
Methodology
Step 1 - Identification of Relevant Samples Size from Population Database


Step 2 - Approaches for Defining Global Market Size (Value, Volume* & Price*)

Note*: In applicable scenarios
Step 3 - Data Sources
Primary Research
- Web Analytics
- Survey Reports
- Research Institute
- Latest Research Reports
- Opinion Leaders
Secondary Research
- Annual Reports
- White Paper
- Latest Press Release
- Industry Association
- Paid Database
- Investor Presentations

Step 4 - Data Triangulation
Involves using different sources of information in order to increase the validity of a study
These sources are likely to be stakeholders in a program - participants, other researchers, program staff, other community members, and so on.
Then we put all data in single framework & apply various statistical tools to find out the dynamic on the market.
During the analysis stage, feedback from the stakeholder groups would be compared to determine areas of agreement as well as areas of divergence


