Emerging Trends in On-Site Photovoltaic Solar Power For Data Centers Market: A Technology Perspective 2025-2033

On-Site Photovoltaic Solar Power For Data Centers Market by Production Analysis, by Consumption Analysis, by Import Market Analysis (Value & Volume), by Export Market Analysis (Value & Volume), by Price Trend Analysis, by North America (United States, Canada, Rest of North America), by Europe (Germany, France, United Kingdom, Italy, Spain, NORDIC, Turkey, Russia, Rest of Europe), by Asia Pacific (China, India, Japan, Australia, Malaysia, Thailand, Indonesia, Vietnam, Rest of Asia Pacific), by South America (Brazil, Argentina, Chile, Colombia, Rest of South America), by Middle East and Africa (United Arab Emirates, Qatar, Saudi Arabia, South Africa, Nigeria, Egypt) Forecast 2025-2033

Jul 2 2025
Base Year: 2024

234 Pages
Main Logo

Emerging Trends in On-Site Photovoltaic Solar Power For Data Centers Market: A Technology Perspective 2025-2033


Home
Industries
Energy & Power
sponsor image
sponsor image
sponsor image
sponsor image
sponsor image

Tailored for you

  • In-depth Analysis Tailored to Specified Regions or Segments
  • Company Profiles Customized to User Preferences
  • Comprehensive Insights Focused on Specific Segments or Regions
  • Customized Evaluation of Competitive Landscape to Meet Your Needs
  • Tailored Customization to Address Other Specific Requirements
Ask for customization


Key Insights

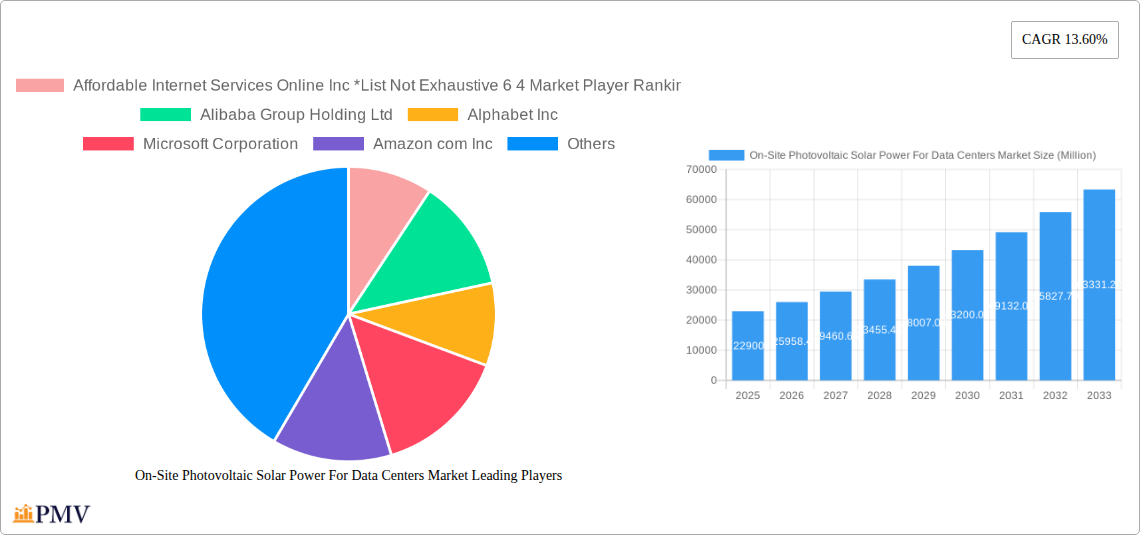
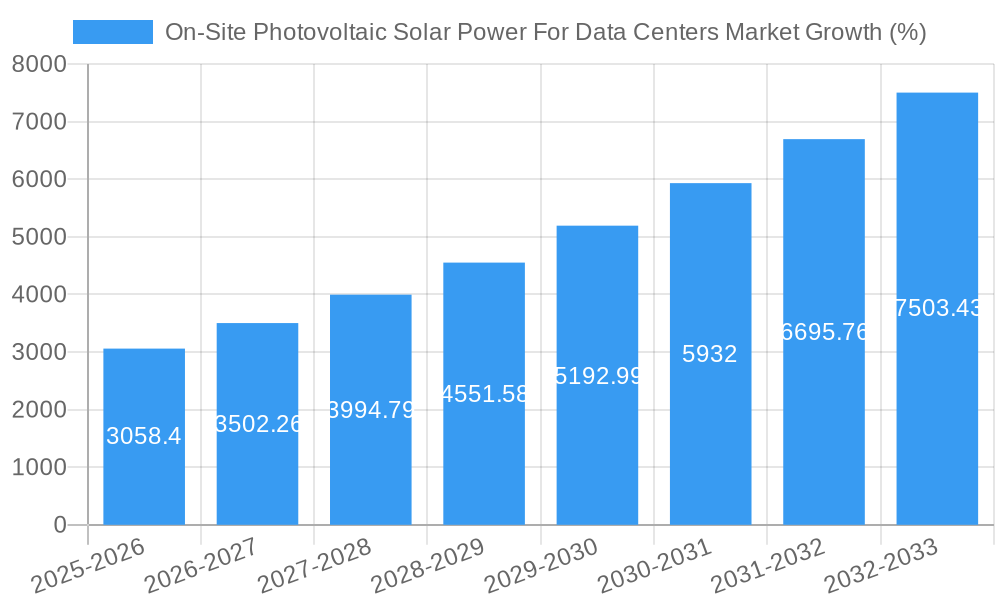
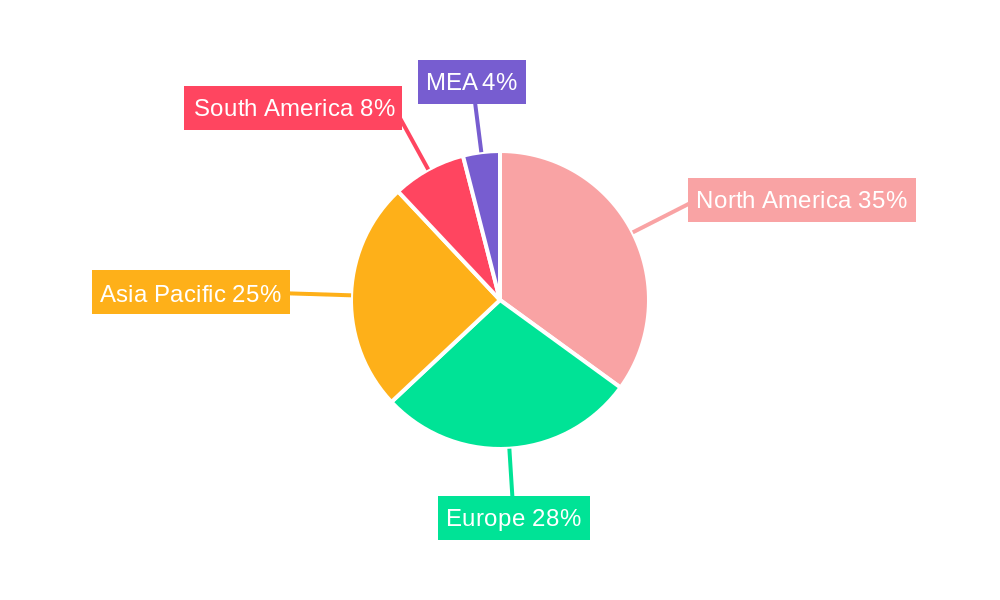
The On-Site Photovoltaic Solar Power for Data Centers market is experiencing robust growth, projected to reach $22.90 billion in 2025 and exhibiting a Compound Annual Growth Rate (CAGR) of 13.60% from 2025 to 2033. This expansion is driven by several key factors. The increasing demand for renewable energy sources to reduce carbon footprints and operational costs within the data center industry is a primary driver. Stringent environmental regulations and rising electricity prices further incentivize the adoption of on-site solar power. Technological advancements in thin-film and crystalline solar cell technologies are improving efficiency and reducing the cost of deployment, making solar power a more competitive option compared to traditional grid electricity. The market is segmented by solar cell type (thin-film and crystalline) and application (data centers, telecom towers, and other commercial applications). North America, Europe, and Asia-Pacific are the leading regions driving market growth, fueled by substantial data center infrastructure development and government support for renewable energy initiatives. Competition is intensifying among major players including Alibaba, Alphabet, Microsoft, Amazon, and Facebook, alongside specialized providers like Affordable Internet Services Online Inc., who are focused on developing and deploying cost-effective on-site solar solutions tailored to the specific needs of the data center industry.

The market's continued growth trajectory is expected to be influenced by several trends. The increasing adoption of hybrid energy solutions, combining solar power with battery storage systems, will enhance reliability and grid independence for data centers. Furthermore, advancements in energy management systems will optimize energy consumption and integration of solar power within data center operations. Potential restraints include the high initial investment costs associated with solar power installations, permitting complexities, and the intermittent nature of solar energy. However, ongoing technological innovations, supportive government policies, and decreasing solar panel costs are likely to mitigate these challenges and sustain market growth throughout the forecast period. The strategic partnerships between solar technology providers and data center operators will play a crucial role in expanding the market's reach and accelerating adoption.

This in-depth report provides a comprehensive analysis of the On-Site Photovoltaic (PV) Solar Power for Data Centers market, offering invaluable insights for investors, industry professionals, and strategic decision-makers. Covering the period 2019-2033, with a focus on 2025, this report meticulously examines market trends, competitive dynamics, technological advancements, and growth opportunities within this rapidly evolving sector. The report leverages extensive data analysis and expert insights to provide a clear and actionable understanding of the market landscape.

On-Site Photovoltaic Solar Power For Data Centers Market Research Report - Market Size, Growth & Forecast

On-Site Photovoltaic Solar Power For Data Centers Market Market Structure & Competitive Dynamics

This section delves into the competitive landscape of the on-site photovoltaic solar power market for data centers. We analyze market concentration, identifying key players and their market share. The report assesses the innovation ecosystem, exploring technological advancements and their impact on market dynamics. Regulatory frameworks influencing market growth are also examined, along with an analysis of product substitutes and their competitive threat. Further, we analyze end-user trends, including the increasing adoption of renewable energy solutions by data center operators. Finally, the report includes a review of recent mergers and acquisitions (M&A) activities within the sector, including deal values and their strategic implications. The level of market concentration is estimated at xx%, indicating a [describe as concentrated, fragmented etc.] market. Significant M&A activity has been observed, with deal values exceeding $xx Million in the last five years.

  • Market Concentration: xx%
  • Key Players & Market Share: A detailed breakdown of market share for leading players, including estimates for Alibaba Group Holding Ltd, Alphabet Inc, Microsoft Corporation, Amazon.com Inc, Facebook Inc, and Dell Technologies Inc, will be provided.
  • M&A Activity: Analysis of recent mergers and acquisitions, including deal values and strategic implications.

On-Site Photovoltaic Solar Power For Data Centers Market Industry Trends & Insights

This section presents a comprehensive overview of the key trends shaping the on-site photovoltaic solar power market for data centers. We analyze market growth drivers, including the increasing demand for sustainable energy solutions, government incentives promoting renewable energy adoption, and the rising operational costs of traditional power sources. Technological disruptions, such as advancements in solar panel efficiency and energy storage solutions, are also examined. Furthermore, we explore evolving consumer preferences, focusing on the growing preference for environmentally friendly data center operations. Competitive dynamics, including pricing strategies, technological innovation, and market penetration by key players, are analyzed. The market is projected to exhibit a Compound Annual Growth Rate (CAGR) of xx% during the forecast period (2025-2033), with market penetration expected to reach xx% by 2033.

On-Site Photovoltaic Solar Power For Data Centers Market Growth

Dominant Markets & Segments in On-Site Photovoltaic Solar Power For Data Centers Market

This section identifies the leading regions, countries, and market segments within the on-site photovoltaic solar power market for data centers. We analyze the dominance of specific regions based on factors such as supportive government policies, robust infrastructure development, and high demand from data center operators. For the segments (Type: Thin-film solar cells and crystalline solar cells; Application: Data centers, telecom towers, and other commercial applications), a detailed analysis of key drivers is provided.

  • Key Drivers:

    • Economic Policies: Government incentives and subsidies for renewable energy adoption.
    • Infrastructure: Availability of grid infrastructure and supportive regulatory frameworks.
    • Technological Advancements: Improvements in solar panel efficiency and energy storage technology.
  • Dominance Analysis: A detailed paragraph analyzing the reasons behind the dominance of specific regions and segments will be included. For example, [Region X] is projected to be the leading market due to [Specific reasons].

On-Site Photovoltaic Solar Power For Data Centers Market Product Innovations

This section examines recent product innovations, focusing on advancements in solar panel technology, energy storage systems, and smart grid integration. We highlight the competitive advantages offered by these innovations and their market fit. Technological trends such as the increasing adoption of higher-efficiency solar cells and the development of more sophisticated energy management systems are discussed. The increasing integration of AI and IoT to optimize energy production and consumption is also addressed.

Report Segmentation & Scope

This report segments the on-site photovoltaic solar power market for data centers based on solar cell type (thin-film solar cells and crystalline solar cells) and application (data centers, telecom towers, and other commercial applications). Each segment's growth projections, market size estimates, and competitive dynamics are thoroughly analyzed.

  • Type: A detailed analysis of the thin-film and crystalline solar cell markets, including market size projections and competitive landscape.
  • Application: A detailed breakdown of the market by application, including growth projections and competitive analysis for data centers, telecom towers, and other commercial applications.

Key Drivers of On-Site Photovoltaic Solar Power For Data Centers Market Growth

Several factors drive the growth of the on-site photovoltaic solar power market for data centers. These include the increasing focus on reducing carbon footprint, government regulations promoting renewable energy adoption, and decreasing costs of solar PV systems. Technological advancements leading to increased efficiency and reduced production costs further accelerate market growth. Furthermore, the growing demand for reliable and cost-effective power sources for data centers acts as a significant catalyst.

Challenges in the On-Site Photovoltaic Solar Power For Data Centers Market Sector

Despite significant growth potential, the market faces certain challenges. High initial investment costs for solar PV systems can deter some data center operators. Intermittency of solar power and the need for reliable energy storage solutions pose another challenge. Furthermore, regulatory uncertainties and potential grid integration issues can hinder wider adoption. The impact of these challenges on market growth is quantified.

Leading Players in the On-Site Photovoltaic Solar Power For Data Centers Market Market

The following companies are key players in the on-site photovoltaic solar power market for data centers:

  • Alibaba Group Holding Ltd
  • Alphabet Inc
  • Microsoft Corporation
  • Amazon.com Inc
  • Facebook Inc
  • Dell Technologies Inc
  • Affordable Internet Services Online Inc

Key Developments in On-Site Photovoltaic Solar Power For Data Centers Market Sector

  • September 2023: Power Capital Renewable Energy (PCRE) signed a 58 MW PPA with Google for powering Google's data center and offices in Ireland.
  • August 2023: SCC installed a 737kWp solar PV system on its Birmingham data center, covering over 5% of its energy needs.

Strategic On-Site Photovoltaic Solar Power For Data Centers Market Market Outlook

The on-site photovoltaic solar power market for data centers presents significant growth opportunities. Continued technological advancements, increasing environmental concerns, and supportive government policies will drive market expansion. Strategic partnerships between solar PV providers and data center operators will play a crucial role in accelerating market growth. Exploring innovative financing models and optimizing energy storage solutions will unlock further market potential.

On-Site Photovoltaic Solar Power For Data Centers Market Segmentation

  • 1. Production Analysis
  • 2. Consumption Analysis
  • 3. Import Market Analysis (Value & Volume)
  • 4. Export Market Analysis (Value & Volume)
  • 5. Price Trend Analysis

On-Site Photovoltaic Solar Power For Data Centers Market Segmentation By Geography

  • 1. North America
    • 1.1. United States
    • 1.2. Canada
    • 1.3. Rest of North America
  • 2. Europe
    • 2.1. Germany
    • 2.2. France
    • 2.3. United Kingdom
    • 2.4. Italy
    • 2.5. Spain
    • 2.6. NORDIC
    • 2.7. Turkey
    • 2.8. Russia
    • 2.9. Rest of Europe
  • 3. Asia Pacific
    • 3.1. China
    • 3.2. India
    • 3.3. Japan
    • 3.4. Australia
    • 3.5. Malaysia
    • 3.6. Thailand
    • 3.7. Indonesia
    • 3.8. Vietnam
    • 3.9. Rest of Asia Pacific
  • 4. South America
    • 4.1. Brazil
    • 4.2. Argentina
    • 4.3. Chile
    • 4.4. Colombia
    • 4.5. Rest of South America
  • 5. Middle East and Africa
    • 5.1. United Arab Emirates
    • 5.2. Qatar
    • 5.3. Saudi Arabia
    • 5.4. South Africa
    • 5.5. Nigeria
    • 5.6. Egypt
On-Site Photovoltaic Solar Power For Data Centers Market Regional Share


On-Site Photovoltaic Solar Power For Data Centers Market REPORT HIGHLIGHTS

AspectsDetails
Study Period 2019-2033
Base Year 2024
Estimated Year 2025
Forecast Period2025-2033
Historical Period2019-2024
Growth RateCAGR of 13.60% from 2019-2033
Segmentation
    • By Production Analysis
    • By Consumption Analysis
    • By Import Market Analysis (Value & Volume)
    • By Export Market Analysis (Value & Volume)
    • By Price Trend Analysis
  • By Geography
    • North America
      • United States
      • Canada
      • Rest of North America
    • Europe
      • Germany
      • France
      • United Kingdom
      • Italy
      • Spain
      • NORDIC
      • Turkey
      • Russia
      • Rest of Europe
    • Asia Pacific
      • China
      • India
      • Japan
      • Australia
      • Malaysia
      • Thailand
      • Indonesia
      • Vietnam
      • Rest of Asia Pacific
    • South America
      • Brazil
      • Argentina
      • Chile
      • Colombia
      • Rest of South America
    • Middle East and Africa
      • United Arab Emirates
      • Qatar
      • Saudi Arabia
      • South Africa
      • Nigeria
      • Egypt


Table of Contents

  1. 1. Introduction
    • 1.1. Research Scope
    • 1.2. Market Segmentation
    • 1.3. Research Methodology
    • 1.4. Definitions and Assumptions
  2. 2. Executive Summary
    • 2.1. Introduction
  3. 3. Market Dynamics
    • 3.1. Introduction
      • 3.2. Market Drivers
        • 3.2.1. 4.; Decreasing Solar Power Installation Costs 4.; Growing focus on Implementing Sustainable Business Practices
      • 3.3. Market Restrains
        • 3.3.1. 4.; Lack of Space for Small Data Centers to Install Solar Panels
      • 3.4. Market Trends
        • 3.4.1. Decrease in Solar Power Installation Cost is Likely to Drive the Market
  4. 4. Market Factor Analysis
    • 4.1. Porters Five Forces
    • 4.2. Supply/Value Chain
    • 4.3. PESTEL analysis
    • 4.4. Market Entropy
    • 4.5. Patent/Trademark Analysis
  5. 5. Global On-Site Photovoltaic Solar Power For Data Centers Market Analysis, Insights and Forecast, 2019-2031
    • 5.1. Market Analysis, Insights and Forecast - by Production Analysis
      • 5.2. Market Analysis, Insights and Forecast - by Consumption Analysis
        • 5.3. Market Analysis, Insights and Forecast - by Import Market Analysis (Value & Volume)
          • 5.4. Market Analysis, Insights and Forecast - by Export Market Analysis (Value & Volume)
            • 5.5. Market Analysis, Insights and Forecast - by Price Trend Analysis
              • 5.6. Market Analysis, Insights and Forecast - by Region
                • 5.6.1. North America
                • 5.6.2. Europe
                • 5.6.3. Asia Pacific
                • 5.6.4. South America
                • 5.6.5. Middle East and Africa
            • 6. North America On-Site Photovoltaic Solar Power For Data Centers Market Analysis, Insights and Forecast, 2019-2031
              • 6.1. Market Analysis, Insights and Forecast - by Production Analysis
                • 6.2. Market Analysis, Insights and Forecast - by Consumption Analysis
                  • 6.3. Market Analysis, Insights and Forecast - by Import Market Analysis (Value & Volume)
                    • 6.4. Market Analysis, Insights and Forecast - by Export Market Analysis (Value & Volume)
                      • 6.5. Market Analysis, Insights and Forecast - by Price Trend Analysis
                      • 7. Europe On-Site Photovoltaic Solar Power For Data Centers Market Analysis, Insights and Forecast, 2019-2031
                        • 7.1. Market Analysis, Insights and Forecast - by Production Analysis
                          • 7.2. Market Analysis, Insights and Forecast - by Consumption Analysis
                            • 7.3. Market Analysis, Insights and Forecast - by Import Market Analysis (Value & Volume)
                              • 7.4. Market Analysis, Insights and Forecast - by Export Market Analysis (Value & Volume)
                                • 7.5. Market Analysis, Insights and Forecast - by Price Trend Analysis
                                • 8. Asia Pacific On-Site Photovoltaic Solar Power For Data Centers Market Analysis, Insights and Forecast, 2019-2031
                                  • 8.1. Market Analysis, Insights and Forecast - by Production Analysis
                                    • 8.2. Market Analysis, Insights and Forecast - by Consumption Analysis
                                      • 8.3. Market Analysis, Insights and Forecast - by Import Market Analysis (Value & Volume)
                                        • 8.4. Market Analysis, Insights and Forecast - by Export Market Analysis (Value & Volume)
                                          • 8.5. Market Analysis, Insights and Forecast - by Price Trend Analysis
                                          • 9. South America On-Site Photovoltaic Solar Power For Data Centers Market Analysis, Insights and Forecast, 2019-2031
                                            • 9.1. Market Analysis, Insights and Forecast - by Production Analysis
                                              • 9.2. Market Analysis, Insights and Forecast - by Consumption Analysis
                                                • 9.3. Market Analysis, Insights and Forecast - by Import Market Analysis (Value & Volume)
                                                  • 9.4. Market Analysis, Insights and Forecast - by Export Market Analysis (Value & Volume)
                                                    • 9.5. Market Analysis, Insights and Forecast - by Price Trend Analysis
                                                    • 10. Middle East and Africa On-Site Photovoltaic Solar Power For Data Centers Market Analysis, Insights and Forecast, 2019-2031
                                                      • 10.1. Market Analysis, Insights and Forecast - by Production Analysis
                                                        • 10.2. Market Analysis, Insights and Forecast - by Consumption Analysis
                                                          • 10.3. Market Analysis, Insights and Forecast - by Import Market Analysis (Value & Volume)
                                                            • 10.4. Market Analysis, Insights and Forecast - by Export Market Analysis (Value & Volume)
                                                              • 10.5. Market Analysis, Insights and Forecast - by Price Trend Analysis
                                                              • 11. North America On-Site Photovoltaic Solar Power For Data Centers Market Analysis, Insights and Forecast, 2019-2031
                                                                  • 11.1. Market Analysis, Insights and Forecast - By Country/Sub-region
                                                                    • 11.1.1 United States
                                                                    • 11.1.2 Canada
                                                                    • 11.1.3 Mexico
                                                              • 12. Europe On-Site Photovoltaic Solar Power For Data Centers Market Analysis, Insights and Forecast, 2019-2031
                                                                  • 12.1. Market Analysis, Insights and Forecast - By Country/Sub-region
                                                                    • 12.1.1 Germany
                                                                    • 12.1.2 United Kingdom
                                                                    • 12.1.3 France
                                                                    • 12.1.4 Spain
                                                                    • 12.1.5 Italy
                                                                    • 12.1.6 Spain
                                                                    • 12.1.7 Belgium
                                                                    • 12.1.8 Netherland
                                                                    • 12.1.9 Nordics
                                                                    • 12.1.10 Rest of Europe
                                                              • 13. Asia Pacific On-Site Photovoltaic Solar Power For Data Centers Market Analysis, Insights and Forecast, 2019-2031
                                                                  • 13.1. Market Analysis, Insights and Forecast - By Country/Sub-region
                                                                    • 13.1.1 China
                                                                    • 13.1.2 Japan
                                                                    • 13.1.3 India
                                                                    • 13.1.4 South Korea
                                                                    • 13.1.5 Southeast Asia
                                                                    • 13.1.6 Australia
                                                                    • 13.1.7 Indonesia
                                                                    • 13.1.8 Phillipes
                                                                    • 13.1.9 Singapore
                                                                    • 13.1.10 Thailandc
                                                                    • 13.1.11 Rest of Asia Pacific
                                                              • 14. South America On-Site Photovoltaic Solar Power For Data Centers Market Analysis, Insights and Forecast, 2019-2031
                                                                  • 14.1. Market Analysis, Insights and Forecast - By Country/Sub-region
                                                                    • 14.1.1 Brazil
                                                                    • 14.1.2 Argentina
                                                                    • 14.1.3 Peru
                                                                    • 14.1.4 Chile
                                                                    • 14.1.5 Colombia
                                                                    • 14.1.6 Ecuador
                                                                    • 14.1.7 Venezuela
                                                                    • 14.1.8 Rest of South America
                                                              • 15. MEA On-Site Photovoltaic Solar Power For Data Centers Market Analysis, Insights and Forecast, 2019-2031
                                                                  • 15.1. Market Analysis, Insights and Forecast - By Country/Sub-region
                                                                    • 15.1.1 United Arab Emirates
                                                                    • 15.1.2 Saudi Arabia
                                                                    • 15.1.3 South Africa
                                                                    • 15.1.4 Rest of Middle East and Africa
                                                              • 16. Competitive Analysis
                                                                • 16.1. Global Market Share Analysis 2024
                                                                  • 16.2. Company Profiles
                                                                    • 16.2.1 Affordable Internet Services Online Inc *List Not Exhaustive 6 4 Market Player Rankin
                                                                      • 16.2.1.1. Overview
                                                                      • 16.2.1.2. Products
                                                                      • 16.2.1.3. SWOT Analysis
                                                                      • 16.2.1.4. Recent Developments
                                                                      • 16.2.1.5. Financials (Based on Availability)
                                                                    • 16.2.2 Alibaba Group Holding Ltd
                                                                      • 16.2.2.1. Overview
                                                                      • 16.2.2.2. Products
                                                                      • 16.2.2.3. SWOT Analysis
                                                                      • 16.2.2.4. Recent Developments
                                                                      • 16.2.2.5. Financials (Based on Availability)
                                                                    • 16.2.3 Alphabet Inc
                                                                      • 16.2.3.1. Overview
                                                                      • 16.2.3.2. Products
                                                                      • 16.2.3.3. SWOT Analysis
                                                                      • 16.2.3.4. Recent Developments
                                                                      • 16.2.3.5. Financials (Based on Availability)
                                                                    • 16.2.4 Microsoft Corporation
                                                                      • 16.2.4.1. Overview
                                                                      • 16.2.4.2. Products
                                                                      • 16.2.4.3. SWOT Analysis
                                                                      • 16.2.4.4. Recent Developments
                                                                      • 16.2.4.5. Financials (Based on Availability)
                                                                    • 16.2.5 Amazon com Inc
                                                                      • 16.2.5.1. Overview
                                                                      • 16.2.5.2. Products
                                                                      • 16.2.5.3. SWOT Analysis
                                                                      • 16.2.5.4. Recent Developments
                                                                      • 16.2.5.5. Financials (Based on Availability)
                                                                    • 16.2.6 Facebook Inc
                                                                      • 16.2.6.1. Overview
                                                                      • 16.2.6.2. Products
                                                                      • 16.2.6.3. SWOT Analysis
                                                                      • 16.2.6.4. Recent Developments
                                                                      • 16.2.6.5. Financials (Based on Availability)
                                                                    • 16.2.7 Dell Technologies Inc
                                                                      • 16.2.7.1. Overview
                                                                      • 16.2.7.2. Products
                                                                      • 16.2.7.3. SWOT Analysis
                                                                      • 16.2.7.4. Recent Developments
                                                                      • 16.2.7.5. Financials (Based on Availability)

                                                              List of Figures

                                                              1. Figure 1: Global On-Site Photovoltaic Solar Power For Data Centers Market Revenue Breakdown (Million, %) by Region 2024 & 2032
                                                              2. Figure 2: North America On-Site Photovoltaic Solar Power For Data Centers Market Revenue (Million), by Country 2024 & 2032
                                                              3. Figure 3: North America On-Site Photovoltaic Solar Power For Data Centers Market Revenue Share (%), by Country 2024 & 2032
                                                              4. Figure 4: Europe On-Site Photovoltaic Solar Power For Data Centers Market Revenue (Million), by Country 2024 & 2032
                                                              5. Figure 5: Europe On-Site Photovoltaic Solar Power For Data Centers Market Revenue Share (%), by Country 2024 & 2032
                                                              6. Figure 6: Asia Pacific On-Site Photovoltaic Solar Power For Data Centers Market Revenue (Million), by Country 2024 & 2032
                                                              7. Figure 7: Asia Pacific On-Site Photovoltaic Solar Power For Data Centers Market Revenue Share (%), by Country 2024 & 2032
                                                              8. Figure 8: South America On-Site Photovoltaic Solar Power For Data Centers Market Revenue (Million), by Country 2024 & 2032
                                                              9. Figure 9: South America On-Site Photovoltaic Solar Power For Data Centers Market Revenue Share (%), by Country 2024 & 2032
                                                              10. Figure 10: MEA On-Site Photovoltaic Solar Power For Data Centers Market Revenue (Million), by Country 2024 & 2032
                                                              11. Figure 11: MEA On-Site Photovoltaic Solar Power For Data Centers Market Revenue Share (%), by Country 2024 & 2032
                                                              12. Figure 12: North America On-Site Photovoltaic Solar Power For Data Centers Market Revenue (Million), by Production Analysis 2024 & 2032
                                                              13. Figure 13: North America On-Site Photovoltaic Solar Power For Data Centers Market Revenue Share (%), by Production Analysis 2024 & 2032
                                                              14. Figure 14: North America On-Site Photovoltaic Solar Power For Data Centers Market Revenue (Million), by Consumption Analysis 2024 & 2032
                                                              15. Figure 15: North America On-Site Photovoltaic Solar Power For Data Centers Market Revenue Share (%), by Consumption Analysis 2024 & 2032
                                                              16. Figure 16: North America On-Site Photovoltaic Solar Power For Data Centers Market Revenue (Million), by Import Market Analysis (Value & Volume) 2024 & 2032
                                                              17. Figure 17: North America On-Site Photovoltaic Solar Power For Data Centers Market Revenue Share (%), by Import Market Analysis (Value & Volume) 2024 & 2032
                                                              18. Figure 18: North America On-Site Photovoltaic Solar Power For Data Centers Market Revenue (Million), by Export Market Analysis (Value & Volume) 2024 & 2032
                                                              19. Figure 19: North America On-Site Photovoltaic Solar Power For Data Centers Market Revenue Share (%), by Export Market Analysis (Value & Volume) 2024 & 2032
                                                              20. Figure 20: North America On-Site Photovoltaic Solar Power For Data Centers Market Revenue (Million), by Price Trend Analysis 2024 & 2032
                                                              21. Figure 21: North America On-Site Photovoltaic Solar Power For Data Centers Market Revenue Share (%), by Price Trend Analysis 2024 & 2032
                                                              22. Figure 22: North America On-Site Photovoltaic Solar Power For Data Centers Market Revenue (Million), by Country 2024 & 2032
                                                              23. Figure 23: North America On-Site Photovoltaic Solar Power For Data Centers Market Revenue Share (%), by Country 2024 & 2032
                                                              24. Figure 24: Europe On-Site Photovoltaic Solar Power For Data Centers Market Revenue (Million), by Production Analysis 2024 & 2032
                                                              25. Figure 25: Europe On-Site Photovoltaic Solar Power For Data Centers Market Revenue Share (%), by Production Analysis 2024 & 2032
                                                              26. Figure 26: Europe On-Site Photovoltaic Solar Power For Data Centers Market Revenue (Million), by Consumption Analysis 2024 & 2032
                                                              27. Figure 27: Europe On-Site Photovoltaic Solar Power For Data Centers Market Revenue Share (%), by Consumption Analysis 2024 & 2032
                                                              28. Figure 28: Europe On-Site Photovoltaic Solar Power For Data Centers Market Revenue (Million), by Import Market Analysis (Value & Volume) 2024 & 2032
                                                              29. Figure 29: Europe On-Site Photovoltaic Solar Power For Data Centers Market Revenue Share (%), by Import Market Analysis (Value & Volume) 2024 & 2032
                                                              30. Figure 30: Europe On-Site Photovoltaic Solar Power For Data Centers Market Revenue (Million), by Export Market Analysis (Value & Volume) 2024 & 2032
                                                              31. Figure 31: Europe On-Site Photovoltaic Solar Power For Data Centers Market Revenue Share (%), by Export Market Analysis (Value & Volume) 2024 & 2032
                                                              32. Figure 32: Europe On-Site Photovoltaic Solar Power For Data Centers Market Revenue (Million), by Price Trend Analysis 2024 & 2032
                                                              33. Figure 33: Europe On-Site Photovoltaic Solar Power For Data Centers Market Revenue Share (%), by Price Trend Analysis 2024 & 2032
                                                              34. Figure 34: Europe On-Site Photovoltaic Solar Power For Data Centers Market Revenue (Million), by Country 2024 & 2032
                                                              35. Figure 35: Europe On-Site Photovoltaic Solar Power For Data Centers Market Revenue Share (%), by Country 2024 & 2032
                                                              36. Figure 36: Asia Pacific On-Site Photovoltaic Solar Power For Data Centers Market Revenue (Million), by Production Analysis 2024 & 2032
                                                              37. Figure 37: Asia Pacific On-Site Photovoltaic Solar Power For Data Centers Market Revenue Share (%), by Production Analysis 2024 & 2032
                                                              38. Figure 38: Asia Pacific On-Site Photovoltaic Solar Power For Data Centers Market Revenue (Million), by Consumption Analysis 2024 & 2032
                                                              39. Figure 39: Asia Pacific On-Site Photovoltaic Solar Power For Data Centers Market Revenue Share (%), by Consumption Analysis 2024 & 2032
                                                              40. Figure 40: Asia Pacific On-Site Photovoltaic Solar Power For Data Centers Market Revenue (Million), by Import Market Analysis (Value & Volume) 2024 & 2032
                                                              41. Figure 41: Asia Pacific On-Site Photovoltaic Solar Power For Data Centers Market Revenue Share (%), by Import Market Analysis (Value & Volume) 2024 & 2032
                                                              42. Figure 42: Asia Pacific On-Site Photovoltaic Solar Power For Data Centers Market Revenue (Million), by Export Market Analysis (Value & Volume) 2024 & 2032
                                                              43. Figure 43: Asia Pacific On-Site Photovoltaic Solar Power For Data Centers Market Revenue Share (%), by Export Market Analysis (Value & Volume) 2024 & 2032
                                                              44. Figure 44: Asia Pacific On-Site Photovoltaic Solar Power For Data Centers Market Revenue (Million), by Price Trend Analysis 2024 & 2032
                                                              45. Figure 45: Asia Pacific On-Site Photovoltaic Solar Power For Data Centers Market Revenue Share (%), by Price Trend Analysis 2024 & 2032
                                                              46. Figure 46: Asia Pacific On-Site Photovoltaic Solar Power For Data Centers Market Revenue (Million), by Country 2024 & 2032
                                                              47. Figure 47: Asia Pacific On-Site Photovoltaic Solar Power For Data Centers Market Revenue Share (%), by Country 2024 & 2032
                                                              48. Figure 48: South America On-Site Photovoltaic Solar Power For Data Centers Market Revenue (Million), by Production Analysis 2024 & 2032
                                                              49. Figure 49: South America On-Site Photovoltaic Solar Power For Data Centers Market Revenue Share (%), by Production Analysis 2024 & 2032
                                                              50. Figure 50: South America On-Site Photovoltaic Solar Power For Data Centers Market Revenue (Million), by Consumption Analysis 2024 & 2032
                                                              51. Figure 51: South America On-Site Photovoltaic Solar Power For Data Centers Market Revenue Share (%), by Consumption Analysis 2024 & 2032
                                                              52. Figure 52: South America On-Site Photovoltaic Solar Power For Data Centers Market Revenue (Million), by Import Market Analysis (Value & Volume) 2024 & 2032
                                                              53. Figure 53: South America On-Site Photovoltaic Solar Power For Data Centers Market Revenue Share (%), by Import Market Analysis (Value & Volume) 2024 & 2032
                                                              54. Figure 54: South America On-Site Photovoltaic Solar Power For Data Centers Market Revenue (Million), by Export Market Analysis (Value & Volume) 2024 & 2032
                                                              55. Figure 55: South America On-Site Photovoltaic Solar Power For Data Centers Market Revenue Share (%), by Export Market Analysis (Value & Volume) 2024 & 2032
                                                              56. Figure 56: South America On-Site Photovoltaic Solar Power For Data Centers Market Revenue (Million), by Price Trend Analysis 2024 & 2032
                                                              57. Figure 57: South America On-Site Photovoltaic Solar Power For Data Centers Market Revenue Share (%), by Price Trend Analysis 2024 & 2032
                                                              58. Figure 58: South America On-Site Photovoltaic Solar Power For Data Centers Market Revenue (Million), by Country 2024 & 2032
                                                              59. Figure 59: South America On-Site Photovoltaic Solar Power For Data Centers Market Revenue Share (%), by Country 2024 & 2032
                                                              60. Figure 60: Middle East and Africa On-Site Photovoltaic Solar Power For Data Centers Market Revenue (Million), by Production Analysis 2024 & 2032
                                                              61. Figure 61: Middle East and Africa On-Site Photovoltaic Solar Power For Data Centers Market Revenue Share (%), by Production Analysis 2024 & 2032
                                                              62. Figure 62: Middle East and Africa On-Site Photovoltaic Solar Power For Data Centers Market Revenue (Million), by Consumption Analysis 2024 & 2032
                                                              63. Figure 63: Middle East and Africa On-Site Photovoltaic Solar Power For Data Centers Market Revenue Share (%), by Consumption Analysis 2024 & 2032
                                                              64. Figure 64: Middle East and Africa On-Site Photovoltaic Solar Power For Data Centers Market Revenue (Million), by Import Market Analysis (Value & Volume) 2024 & 2032
                                                              65. Figure 65: Middle East and Africa On-Site Photovoltaic Solar Power For Data Centers Market Revenue Share (%), by Import Market Analysis (Value & Volume) 2024 & 2032
                                                              66. Figure 66: Middle East and Africa On-Site Photovoltaic Solar Power For Data Centers Market Revenue (Million), by Export Market Analysis (Value & Volume) 2024 & 2032
                                                              67. Figure 67: Middle East and Africa On-Site Photovoltaic Solar Power For Data Centers Market Revenue Share (%), by Export Market Analysis (Value & Volume) 2024 & 2032
                                                              68. Figure 68: Middle East and Africa On-Site Photovoltaic Solar Power For Data Centers Market Revenue (Million), by Price Trend Analysis 2024 & 2032
                                                              69. Figure 69: Middle East and Africa On-Site Photovoltaic Solar Power For Data Centers Market Revenue Share (%), by Price Trend Analysis 2024 & 2032
                                                              70. Figure 70: Middle East and Africa On-Site Photovoltaic Solar Power For Data Centers Market Revenue (Million), by Country 2024 & 2032
                                                              71. Figure 71: Middle East and Africa On-Site Photovoltaic Solar Power For Data Centers Market Revenue Share (%), by Country 2024 & 2032

                                                              List of Tables

                                                              1. Table 1: Global On-Site Photovoltaic Solar Power For Data Centers Market Revenue Million Forecast, by Region 2019 & 2032
                                                              2. Table 2: Global On-Site Photovoltaic Solar Power For Data Centers Market Revenue Million Forecast, by Production Analysis 2019 & 2032
                                                              3. Table 3: Global On-Site Photovoltaic Solar Power For Data Centers Market Revenue Million Forecast, by Consumption Analysis 2019 & 2032
                                                              4. Table 4: Global On-Site Photovoltaic Solar Power For Data Centers Market Revenue Million Forecast, by Import Market Analysis (Value & Volume) 2019 & 2032
                                                              5. Table 5: Global On-Site Photovoltaic Solar Power For Data Centers Market Revenue Million Forecast, by Export Market Analysis (Value & Volume) 2019 & 2032
                                                              6. Table 6: Global On-Site Photovoltaic Solar Power For Data Centers Market Revenue Million Forecast, by Price Trend Analysis 2019 & 2032
                                                              7. Table 7: Global On-Site Photovoltaic Solar Power For Data Centers Market Revenue Million Forecast, by Region 2019 & 2032
                                                              8. Table 8: Global On-Site Photovoltaic Solar Power For Data Centers Market Revenue Million Forecast, by Country 2019 & 2032
                                                              9. Table 9: United States On-Site Photovoltaic Solar Power For Data Centers Market Revenue (Million) Forecast, by Application 2019 & 2032
                                                              10. Table 10: Canada On-Site Photovoltaic Solar Power For Data Centers Market Revenue (Million) Forecast, by Application 2019 & 2032
                                                              11. Table 11: Mexico On-Site Photovoltaic Solar Power For Data Centers Market Revenue (Million) Forecast, by Application 2019 & 2032
                                                              12. Table 12: Global On-Site Photovoltaic Solar Power For Data Centers Market Revenue Million Forecast, by Country 2019 & 2032
                                                              13. Table 13: Germany On-Site Photovoltaic Solar Power For Data Centers Market Revenue (Million) Forecast, by Application 2019 & 2032
                                                              14. Table 14: United Kingdom On-Site Photovoltaic Solar Power For Data Centers Market Revenue (Million) Forecast, by Application 2019 & 2032
                                                              15. Table 15: France On-Site Photovoltaic Solar Power For Data Centers Market Revenue (Million) Forecast, by Application 2019 & 2032
                                                              16. Table 16: Spain On-Site Photovoltaic Solar Power For Data Centers Market Revenue (Million) Forecast, by Application 2019 & 2032
                                                              17. Table 17: Italy On-Site Photovoltaic Solar Power For Data Centers Market Revenue (Million) Forecast, by Application 2019 & 2032
                                                              18. Table 18: Spain On-Site Photovoltaic Solar Power For Data Centers Market Revenue (Million) Forecast, by Application 2019 & 2032
                                                              19. Table 19: Belgium On-Site Photovoltaic Solar Power For Data Centers Market Revenue (Million) Forecast, by Application 2019 & 2032
                                                              20. Table 20: Netherland On-Site Photovoltaic Solar Power For Data Centers Market Revenue (Million) Forecast, by Application 2019 & 2032
                                                              21. Table 21: Nordics On-Site Photovoltaic Solar Power For Data Centers Market Revenue (Million) Forecast, by Application 2019 & 2032
                                                              22. Table 22: Rest of Europe On-Site Photovoltaic Solar Power For Data Centers Market Revenue (Million) Forecast, by Application 2019 & 2032
                                                              23. Table 23: Global On-Site Photovoltaic Solar Power For Data Centers Market Revenue Million Forecast, by Country 2019 & 2032
                                                              24. Table 24: China On-Site Photovoltaic Solar Power For Data Centers Market Revenue (Million) Forecast, by Application 2019 & 2032
                                                              25. Table 25: Japan On-Site Photovoltaic Solar Power For Data Centers Market Revenue (Million) Forecast, by Application 2019 & 2032
                                                              26. Table 26: India On-Site Photovoltaic Solar Power For Data Centers Market Revenue (Million) Forecast, by Application 2019 & 2032
                                                              27. Table 27: South Korea On-Site Photovoltaic Solar Power For Data Centers Market Revenue (Million) Forecast, by Application 2019 & 2032
                                                              28. Table 28: Southeast Asia On-Site Photovoltaic Solar Power For Data Centers Market Revenue (Million) Forecast, by Application 2019 & 2032
                                                              29. Table 29: Australia On-Site Photovoltaic Solar Power For Data Centers Market Revenue (Million) Forecast, by Application 2019 & 2032
                                                              30. Table 30: Indonesia On-Site Photovoltaic Solar Power For Data Centers Market Revenue (Million) Forecast, by Application 2019 & 2032
                                                              31. Table 31: Phillipes On-Site Photovoltaic Solar Power For Data Centers Market Revenue (Million) Forecast, by Application 2019 & 2032
                                                              32. Table 32: Singapore On-Site Photovoltaic Solar Power For Data Centers Market Revenue (Million) Forecast, by Application 2019 & 2032
                                                              33. Table 33: Thailandc On-Site Photovoltaic Solar Power For Data Centers Market Revenue (Million) Forecast, by Application 2019 & 2032
                                                              34. Table 34: Rest of Asia Pacific On-Site Photovoltaic Solar Power For Data Centers Market Revenue (Million) Forecast, by Application 2019 & 2032
                                                              35. Table 35: Global On-Site Photovoltaic Solar Power For Data Centers Market Revenue Million Forecast, by Country 2019 & 2032
                                                              36. Table 36: Brazil On-Site Photovoltaic Solar Power For Data Centers Market Revenue (Million) Forecast, by Application 2019 & 2032
                                                              37. Table 37: Argentina On-Site Photovoltaic Solar Power For Data Centers Market Revenue (Million) Forecast, by Application 2019 & 2032
                                                              38. Table 38: Peru On-Site Photovoltaic Solar Power For Data Centers Market Revenue (Million) Forecast, by Application 2019 & 2032
                                                              39. Table 39: Chile On-Site Photovoltaic Solar Power For Data Centers Market Revenue (Million) Forecast, by Application 2019 & 2032
                                                              40. Table 40: Colombia On-Site Photovoltaic Solar Power For Data Centers Market Revenue (Million) Forecast, by Application 2019 & 2032
                                                              41. Table 41: Ecuador On-Site Photovoltaic Solar Power For Data Centers Market Revenue (Million) Forecast, by Application 2019 & 2032
                                                              42. Table 42: Venezuela On-Site Photovoltaic Solar Power For Data Centers Market Revenue (Million) Forecast, by Application 2019 & 2032
                                                              43. Table 43: Rest of South America On-Site Photovoltaic Solar Power For Data Centers Market Revenue (Million) Forecast, by Application 2019 & 2032
                                                              44. Table 44: Global On-Site Photovoltaic Solar Power For Data Centers Market Revenue Million Forecast, by Country 2019 & 2032
                                                              45. Table 45: United Arab Emirates On-Site Photovoltaic Solar Power For Data Centers Market Revenue (Million) Forecast, by Application 2019 & 2032
                                                              46. Table 46: Saudi Arabia On-Site Photovoltaic Solar Power For Data Centers Market Revenue (Million) Forecast, by Application 2019 & 2032
                                                              47. Table 47: South Africa On-Site Photovoltaic Solar Power For Data Centers Market Revenue (Million) Forecast, by Application 2019 & 2032
                                                              48. Table 48: Rest of Middle East and Africa On-Site Photovoltaic Solar Power For Data Centers Market Revenue (Million) Forecast, by Application 2019 & 2032
                                                              49. Table 49: Global On-Site Photovoltaic Solar Power For Data Centers Market Revenue Million Forecast, by Production Analysis 2019 & 2032
                                                              50. Table 50: Global On-Site Photovoltaic Solar Power For Data Centers Market Revenue Million Forecast, by Consumption Analysis 2019 & 2032
                                                              51. Table 51: Global On-Site Photovoltaic Solar Power For Data Centers Market Revenue Million Forecast, by Import Market Analysis (Value & Volume) 2019 & 2032
                                                              52. Table 52: Global On-Site Photovoltaic Solar Power For Data Centers Market Revenue Million Forecast, by Export Market Analysis (Value & Volume) 2019 & 2032
                                                              53. Table 53: Global On-Site Photovoltaic Solar Power For Data Centers Market Revenue Million Forecast, by Price Trend Analysis 2019 & 2032
                                                              54. Table 54: Global On-Site Photovoltaic Solar Power For Data Centers Market Revenue Million Forecast, by Country 2019 & 2032
                                                              55. Table 55: United States On-Site Photovoltaic Solar Power For Data Centers Market Revenue (Million) Forecast, by Application 2019 & 2032
                                                              56. Table 56: Canada On-Site Photovoltaic Solar Power For Data Centers Market Revenue (Million) Forecast, by Application 2019 & 2032
                                                              57. Table 57: Rest of North America On-Site Photovoltaic Solar Power For Data Centers Market Revenue (Million) Forecast, by Application 2019 & 2032
                                                              58. Table 58: Global On-Site Photovoltaic Solar Power For Data Centers Market Revenue Million Forecast, by Production Analysis 2019 & 2032
                                                              59. Table 59: Global On-Site Photovoltaic Solar Power For Data Centers Market Revenue Million Forecast, by Consumption Analysis 2019 & 2032
                                                              60. Table 60: Global On-Site Photovoltaic Solar Power For Data Centers Market Revenue Million Forecast, by Import Market Analysis (Value & Volume) 2019 & 2032
                                                              61. Table 61: Global On-Site Photovoltaic Solar Power For Data Centers Market Revenue Million Forecast, by Export Market Analysis (Value & Volume) 2019 & 2032
                                                              62. Table 62: Global On-Site Photovoltaic Solar Power For Data Centers Market Revenue Million Forecast, by Price Trend Analysis 2019 & 2032
                                                              63. Table 63: Global On-Site Photovoltaic Solar Power For Data Centers Market Revenue Million Forecast, by Country 2019 & 2032
                                                              64. Table 64: Germany On-Site Photovoltaic Solar Power For Data Centers Market Revenue (Million) Forecast, by Application 2019 & 2032
                                                              65. Table 65: France On-Site Photovoltaic Solar Power For Data Centers Market Revenue (Million) Forecast, by Application 2019 & 2032
                                                              66. Table 66: United Kingdom On-Site Photovoltaic Solar Power For Data Centers Market Revenue (Million) Forecast, by Application 2019 & 2032
                                                              67. Table 67: Italy On-Site Photovoltaic Solar Power For Data Centers Market Revenue (Million) Forecast, by Application 2019 & 2032
                                                              68. Table 68: Spain On-Site Photovoltaic Solar Power For Data Centers Market Revenue (Million) Forecast, by Application 2019 & 2032
                                                              69. Table 69: NORDIC On-Site Photovoltaic Solar Power For Data Centers Market Revenue (Million) Forecast, by Application 2019 & 2032
                                                              70. Table 70: Turkey On-Site Photovoltaic Solar Power For Data Centers Market Revenue (Million) Forecast, by Application 2019 & 2032
                                                              71. Table 71: Russia On-Site Photovoltaic Solar Power For Data Centers Market Revenue (Million) Forecast, by Application 2019 & 2032
                                                              72. Table 72: Rest of Europe On-Site Photovoltaic Solar Power For Data Centers Market Revenue (Million) Forecast, by Application 2019 & 2032
                                                              73. Table 73: Global On-Site Photovoltaic Solar Power For Data Centers Market Revenue Million Forecast, by Production Analysis 2019 & 2032
                                                              74. Table 74: Global On-Site Photovoltaic Solar Power For Data Centers Market Revenue Million Forecast, by Consumption Analysis 2019 & 2032
                                                              75. Table 75: Global On-Site Photovoltaic Solar Power For Data Centers Market Revenue Million Forecast, by Import Market Analysis (Value & Volume) 2019 & 2032
                                                              76. Table 76: Global On-Site Photovoltaic Solar Power For Data Centers Market Revenue Million Forecast, by Export Market Analysis (Value & Volume) 2019 & 2032
                                                              77. Table 77: Global On-Site Photovoltaic Solar Power For Data Centers Market Revenue Million Forecast, by Price Trend Analysis 2019 & 2032
                                                              78. Table 78: Global On-Site Photovoltaic Solar Power For Data Centers Market Revenue Million Forecast, by Country 2019 & 2032
                                                              79. Table 79: China On-Site Photovoltaic Solar Power For Data Centers Market Revenue (Million) Forecast, by Application 2019 & 2032
                                                              80. Table 80: India On-Site Photovoltaic Solar Power For Data Centers Market Revenue (Million) Forecast, by Application 2019 & 2032
                                                              81. Table 81: Japan On-Site Photovoltaic Solar Power For Data Centers Market Revenue (Million) Forecast, by Application 2019 & 2032
                                                              82. Table 82: Australia On-Site Photovoltaic Solar Power For Data Centers Market Revenue (Million) Forecast, by Application 2019 & 2032
                                                              83. Table 83: Malaysia On-Site Photovoltaic Solar Power For Data Centers Market Revenue (Million) Forecast, by Application 2019 & 2032
                                                              84. Table 84: Thailand On-Site Photovoltaic Solar Power For Data Centers Market Revenue (Million) Forecast, by Application 2019 & 2032
                                                              85. Table 85: Indonesia On-Site Photovoltaic Solar Power For Data Centers Market Revenue (Million) Forecast, by Application 2019 & 2032
                                                              86. Table 86: Vietnam On-Site Photovoltaic Solar Power For Data Centers Market Revenue (Million) Forecast, by Application 2019 & 2032
                                                              87. Table 87: Rest of Asia Pacific On-Site Photovoltaic Solar Power For Data Centers Market Revenue (Million) Forecast, by Application 2019 & 2032
                                                              88. Table 88: Global On-Site Photovoltaic Solar Power For Data Centers Market Revenue Million Forecast, by Production Analysis 2019 & 2032
                                                              89. Table 89: Global On-Site Photovoltaic Solar Power For Data Centers Market Revenue Million Forecast, by Consumption Analysis 2019 & 2032
                                                              90. Table 90: Global On-Site Photovoltaic Solar Power For Data Centers Market Revenue Million Forecast, by Import Market Analysis (Value & Volume) 2019 & 2032
                                                              91. Table 91: Global On-Site Photovoltaic Solar Power For Data Centers Market Revenue Million Forecast, by Export Market Analysis (Value & Volume) 2019 & 2032
                                                              92. Table 92: Global On-Site Photovoltaic Solar Power For Data Centers Market Revenue Million Forecast, by Price Trend Analysis 2019 & 2032
                                                              93. Table 93: Global On-Site Photovoltaic Solar Power For Data Centers Market Revenue Million Forecast, by Country 2019 & 2032
                                                              94. Table 94: Brazil On-Site Photovoltaic Solar Power For Data Centers Market Revenue (Million) Forecast, by Application 2019 & 2032
                                                              95. Table 95: Argentina On-Site Photovoltaic Solar Power For Data Centers Market Revenue (Million) Forecast, by Application 2019 & 2032
                                                              96. Table 96: Chile On-Site Photovoltaic Solar Power For Data Centers Market Revenue (Million) Forecast, by Application 2019 & 2032
                                                              97. Table 97: Colombia On-Site Photovoltaic Solar Power For Data Centers Market Revenue (Million) Forecast, by Application 2019 & 2032
                                                              98. Table 98: Rest of South America On-Site Photovoltaic Solar Power For Data Centers Market Revenue (Million) Forecast, by Application 2019 & 2032
                                                              99. Table 99: Global On-Site Photovoltaic Solar Power For Data Centers Market Revenue Million Forecast, by Production Analysis 2019 & 2032
                                                              100. Table 100: Global On-Site Photovoltaic Solar Power For Data Centers Market Revenue Million Forecast, by Consumption Analysis 2019 & 2032
                                                              101. Table 101: Global On-Site Photovoltaic Solar Power For Data Centers Market Revenue Million Forecast, by Import Market Analysis (Value & Volume) 2019 & 2032
                                                              102. Table 102: Global On-Site Photovoltaic Solar Power For Data Centers Market Revenue Million Forecast, by Export Market Analysis (Value & Volume) 2019 & 2032
                                                              103. Table 103: Global On-Site Photovoltaic Solar Power For Data Centers Market Revenue Million Forecast, by Price Trend Analysis 2019 & 2032
                                                              104. Table 104: Global On-Site Photovoltaic Solar Power For Data Centers Market Revenue Million Forecast, by Country 2019 & 2032
                                                              105. Table 105: United Arab Emirates On-Site Photovoltaic Solar Power For Data Centers Market Revenue (Million) Forecast, by Application 2019 & 2032
                                                              106. Table 106: Qatar On-Site Photovoltaic Solar Power For Data Centers Market Revenue (Million) Forecast, by Application 2019 & 2032
                                                              107. Table 107: Saudi Arabia On-Site Photovoltaic Solar Power For Data Centers Market Revenue (Million) Forecast, by Application 2019 & 2032
                                                              108. Table 108: South Africa On-Site Photovoltaic Solar Power For Data Centers Market Revenue (Million) Forecast, by Application 2019 & 2032
                                                              109. Table 109: Nigeria On-Site Photovoltaic Solar Power For Data Centers Market Revenue (Million) Forecast, by Application 2019 & 2032
                                                              110. Table 110: Egypt On-Site Photovoltaic Solar Power For Data Centers Market Revenue (Million) Forecast, by Application 2019 & 2032


                                                              Frequently Asked Questions

                                                              1. What is the projected Compound Annual Growth Rate (CAGR) of the On-Site Photovoltaic Solar Power For Data Centers Market?

                                                              The projected CAGR is approximately 13.60%.

                                                              2. Which companies are prominent players in the On-Site Photovoltaic Solar Power For Data Centers Market?

                                                              Key companies in the market include Affordable Internet Services Online Inc *List Not Exhaustive 6 4 Market Player Rankin, Alibaba Group Holding Ltd, Alphabet Inc, Microsoft Corporation, Amazon com Inc, Facebook Inc, Dell Technologies Inc.

                                                              3. What are the main segments of the On-Site Photovoltaic Solar Power For Data Centers Market?

                                                              The market segments include Production Analysis, Consumption Analysis, Import Market Analysis (Value & Volume), Export Market Analysis (Value & Volume), Price Trend Analysis.

                                                              4. Can you provide details about the market size?

                                                              The market size is estimated to be USD 22.90 Million as of 2022.

                                                              5. What are some drivers contributing to market growth?

                                                              4.; Decreasing Solar Power Installation Costs 4.; Growing focus on Implementing Sustainable Business Practices.

                                                              6. What are the notable trends driving market growth?

                                                              Decrease in Solar Power Installation Cost is Likely to Drive the Market.

                                                              7. Are there any restraints impacting market growth?

                                                              4.; Lack of Space for Small Data Centers to Install Solar Panels.

                                                              8. Can you provide examples of recent developments in the market?

                                                              In September 2023, Ireland-based Power Capital Renewable Energy (PCRE) signed a power purchase agreement (PPA) with American multinational technology firm Google. The agreement will help power up the data centre and offices of Google in Ireland with solar energy worth 58 MW capacity.

                                                              9. What pricing options are available for accessing the report?

                                                              Pricing options include single-user, multi-user, and enterprise licenses priced at USD 4750, USD 5250, and USD 8750 respectively.

                                                              10. Is the market size provided in terms of value or volume?

                                                              The market size is provided in terms of value, measured in Million.

                                                              11. Are there any specific market keywords associated with the report?

                                                              Yes, the market keyword associated with the report is "On-Site Photovoltaic Solar Power For Data Centers Market," which aids in identifying and referencing the specific market segment covered.

                                                              12. How do I determine which pricing option suits my needs best?

                                                              The pricing options vary based on user requirements and access needs. Individual users may opt for single-user licenses, while businesses requiring broader access may choose multi-user or enterprise licenses for cost-effective access to the report.

                                                              13. Are there any additional resources or data provided in the On-Site Photovoltaic Solar Power For Data Centers Market report?

                                                              While the report offers comprehensive insights, it's advisable to review the specific contents or supplementary materials provided to ascertain if additional resources or data are available.

                                                              14. How can I stay updated on further developments or reports in the On-Site Photovoltaic Solar Power For Data Centers Market?

                                                              To stay informed about further developments, trends, and reports in the On-Site Photovoltaic Solar Power For Data Centers Market, consider subscribing to industry newsletters, following relevant companies and organizations, or regularly checking reputable industry news sources and publications.


                                                              Methodology

                                                              Step 1 - Identification of Relevant Samples Size from Population Database

                                                              Step Chart
                                                              Bar Chart
                                                              Method Chart

                                                              Step 2 - Approaches for Defining Global Market Size (Value, Volume* & Price*)

                                                              Approach Chart
                                                              Top-down and bottom-up approaches are used to validate the global market size and estimate the market size for manufactures, regional segments, product, and application.

                                                              Note*: In applicable scenarios

                                                              Step 3 - Data Sources

                                                              Primary Research

                                                              • Web Analytics
                                                              • Survey Reports
                                                              • Research Institute
                                                              • Latest Research Reports
                                                              • Opinion Leaders

                                                              Secondary Research

                                                              • Annual Reports
                                                              • White Paper
                                                              • Latest Press Release
                                                              • Industry Association
                                                              • Paid Database
                                                              • Investor Presentations
                                                              Analyst Chart

                                                              Step 4 - Data Triangulation

                                                              Involves using different sources of information in order to increase the validity of a study

                                                              These sources are likely to be stakeholders in a program - participants, other researchers, program staff, other community members, and so on.

                                                              Then we put all data in single framework & apply various statistical tools to find out the dynamic on the market.

                                                              During the analysis stage, feedback from the stakeholder groups would be compared to determine areas of agreement as well as areas of divergence

                                                              Additionally, after gathering mixed and scattered data from a wide range of sources, data is triangulated and correlated to come up with estimated figures which are further validated through primary mediums or industry experts, opinion leaders.

                                                              About Precision Market View

                                                              Precision Market View offers precise market research, industry intelligence, and data analysis for healthcare, manufacturing, technology, and energy. Our reports provide the clarity you need to make informed decisions and drive growth.

                                                              Our team combines primary research, advanced analytics, and industry expertise to deliver actionable intelligence. We offer syndicated reports, custom research, and consulting services tailored to your business needs.

                                                              At Precision Market View, we are committed to quality, transparency, and client satisfaction. Every report is rigorously validated to ensure accuracy and relevance. Our global perspective and local expertise help you understand both the big picture and the finer details of your market.

                                                              Stay informed with Precision Market View. Subscribe to our newsletter for the latest updates and research highlights, and follow us on social media for real-time insights.

                                                              Precision Market View – Clarity for Your Strategic Decisions.

                                                              artwork spiralartwork spiralRelated Reports
                                                              artwork underline

                                                              MEA Diesel Genset Industry Strategic Insights: Analysis 2025 and Forecasts 2033

                                                              The MEA diesel genset market is booming, projected to reach $395 million by 2033 with a CAGR exceeding 4.10%. Driven by infrastructure growth and unreliable power grids, this report analyzes market trends, key players (like Caterpillar and Cummins), and regional breakdowns (UAE, Saudi Arabia). Discover market insights and growth projections for this lucrative sector.

                                                              July 2025
                                                              Base Year: 2024
                                                              No Of Pages: 180
                                                              Price: $4750

                                                              Clean Coal Technology Industry Growth Projections: Trends to Watch

                                                              Discover the booming Clean Coal Technology market: A comprehensive analysis reveals a CAGR exceeding 4.50% through 2033, driven by CCS, advanced combustion, and stringent environmental regulations. Explore regional trends, key players (Shell, Siemens, GE), and market segmentation for this crucial sector.

                                                              July 2025
                                                              Base Year: 2024
                                                              No Of Pages: 234
                                                              Price: $4750

                                                              Unlocking Insights for East Africa Diesel Genset Market Growth Strategies

                                                              Discover the booming East African diesel genset market! Our comprehensive analysis reveals a CAGR of 4.39% driven by infrastructure development and unreliable power grids. Explore market size, segmentation, key players (Caterpillar, Kirloskar, Wartsila), and growth forecasts for 2025-2033.

                                                              July 2025
                                                              Base Year: 2024
                                                              No Of Pages: 234
                                                              Price: $4750

                                                              Europe Small Wind Turbine Market Charting Growth Trajectories: Analysis and Forecasts 2025-2033

                                                              Discover the booming European small wind turbine market! This comprehensive analysis reveals key trends, growth drivers, and leading companies, projecting significant expansion through 2033. Explore market segmentation, regional breakdowns, and future opportunities in this sustainable energy sector.

                                                              July 2025
                                                              Base Year: 2024
                                                              No Of Pages: 234
                                                              Price: $4750

                                                              Japan Nuclear Power Reactor Decommissioning Market Market Valuation to Hit XXX Million by 2033

                                                              The Japan Nuclear Power Reactor Decommissioning market is booming, driven by aging infrastructure and stringent regulations. Explore market size, CAGR, key players (GE-Hitachi, Toshiba), and regional insights (Asia Pacific) in this comprehensive analysis forecasting growth to 2033. Learn about reactor types, applications, and capacity segments impacting this multi-billion dollar industry.

                                                              July 2025
                                                              Base Year: 2024
                                                              No Of Pages: 197
                                                              Price: $3800

                                                              Turbomachinery Control Systems, Retrofitting, and Ancillary Services Market Dynamics and Forecasts: 2025-2033 Strategic Insights

                                                              Discover the booming Turbomachinery Control Systems market! Our analysis reveals a steady CAGR of 2.94%, driven by retrofitting, ancillary services, and rising demand across power, oil & gas, and chemical sectors. Explore market size, key players, and regional trends through 2033.

                                                              July 2025
                                                              Base Year: 2024
                                                              No Of Pages: 234
                                                              Price: $4750

                                                              Deep Dive into DC Circuit Breaker Industry: Comprehensive Growth Analysis 2025-2033

                                                              The DC Circuit Breaker market is booming, projected to reach \$9.5 billion by 2033, driven by renewable energy growth and technological advancements. Explore market trends, key players (ABB, Siemens, Eaton), and regional insights in this comprehensive analysis.

                                                              July 2025
                                                              Base Year: 2024
                                                              No Of Pages: 234
                                                              Price: $4750

                                                              Cordless Power Tool Battery Industry Growth Opportunities and Market Forecast 2025-2033: A Strategic Analysis

                                                              The cordless power tool battery market is booming, projected to reach [estimated 2033 market size based on CAGR calculation] by 2033, driven by lithium-ion technology advancements and increased demand. Explore market trends, key players (Ryobi, Samsung SDI, Stanley Black & Decker), and regional growth in our comprehensive analysis.

                                                              July 2025
                                                              Base Year: 2024
                                                              No Of Pages: 234
                                                              Price: $4750

                                                              APAC Onshore Wind Turbine Industry Trends and Opportunities for Growth

                                                              Discover the booming APAC onshore wind turbine market! Our analysis projects significant growth from 2025-2033, driven by renewable energy initiatives and technological advancements. Learn about market size, CAGR, and key regional players in this comprehensive report.

                                                              July 2025
                                                              Base Year: 2024
                                                              No Of Pages: 234
                                                              Price: $4750

                                                              Japan High Voltage Direct Current (HVDC) Transmission Systems Market Navigating Dynamics Comprehensive Analysis and Forecasts 2025-2033

                                                              Discover the booming Japan High Voltage Direct Current (HVDC) Transmission Systems market! Learn about its projected 6.51% CAGR, key drivers like renewable energy integration, and leading companies shaping its future. Explore regional breakdowns and market segmentation for insightful analysis.

                                                              July 2025
                                                              Base Year: 2024
                                                              No Of Pages: 197
                                                              Price: $3800

                                                              Netherlands Combined Heat and Power Market Market’s Evolutionary Trends 2025-2033

                                                              Discover the growth potential of the Netherlands combined heat and power (CHP) market. This in-depth analysis reveals key trends, drivers, and restraints impacting this €250 million market, forecasting steady growth through 2033. Explore market segmentation, key players, and the increasing role of renewable energy.

                                                              July 2025
                                                              Base Year: 2024
                                                              No Of Pages: 197
                                                              Price: $3800

                                                              Equatorial Guinea Power EPC Market Industry’s Evolution and Growth Pathways

                                                              Discover the booming Equatorial Guinea power EPC market. This in-depth analysis reveals a $150 million (2025) market projected for strong growth (CAGR > 4.5%), driven by industrial expansion and renewable energy initiatives. Explore key players, market segments (turnkey, EPC), and future trends.

                                                              July 2025
                                                              Base Year: 2024
                                                              No Of Pages: 197
                                                              Price: $3800

                                                              Denmark Offshore Oil And Gas Decommissioning Market Market’s Growth Blueprint

                                                              The Denmark offshore oil and gas decommissioning market is booming, projected to reach €191.5 million by 2033 with a CAGR exceeding 6%. Learn about market drivers, trends, key players (Aker Solutions, Saipem, Halliburton), and the opportunities in this rapidly growing sector.

                                                              July 2025
                                                              Base Year: 2024
                                                              No Of Pages: 197
                                                              Price: $3800

                                                              Solar Backsheet Industry Market Expansion: Growth Outlook 2025-2033

                                                              The global solar backsheet market is booming, with a CAGR exceeding 15.5% to 2033. Discover key market trends, drivers, restraints, and leading companies in this rapidly expanding sector. Learn about fluoropolymer vs. non-fluoropolymer backsheets and regional market analysis.

                                                              July 2025
                                                              Base Year: 2024
                                                              No Of Pages: 180
                                                              Price: $4750

                                                              Argentina Solar Energy Market to Grow at XX CAGR: Market Size Analysis and Forecasts 2025-2033

                                                              Discover the booming Argentina solar energy market! Explore its impressive 13%+ CAGR, key drivers, leading companies (Central Puerto SA, YPF Luz, etc.), and future projections to 2033. Learn about investment opportunities and market trends in this rapidly expanding sector.

                                                              July 2025
                                                              Base Year: 2024
                                                              No Of Pages: 197
                                                              Price: $3800

                                                              Strategic Trends in US Oil & Gas Upstream Market Market 2025-2033

                                                              Dive into the dynamic US Oil & Gas Upstream market analysis. Explore a projected $500B market in 2025, growing at a CAGR of 2.30% until 2033. Discover key drivers, restraints, regional breakdowns, and the dominant players shaping this crucial energy sector.

                                                              July 2025
                                                              Base Year: 2024
                                                              No Of Pages: 197
                                                              Price: $3800

                                                              Unlocking the Future of Measurement While Drilling Industry: Growth and Trends 2025-2033

                                                              The Measurement While Drilling (MWD) market is booming, projected to exceed a multi-billion dollar valuation by 2033 with a CAGR >7%. This in-depth analysis explores key drivers, trends, restraints, and regional market share, highlighting opportunities for leading companies like Schlumberger and Halliburton. Discover the latest insights on MWD technology and its impact on the oil & gas industry.

                                                              July 2025
                                                              Base Year: 2024
                                                              No Of Pages: 234
                                                              Price: $4750

                                                              France Biomass Energy Industry Industry Analysis and Consumer Behavior

                                                              Discover the booming France biomass energy market! Our analysis reveals a CAGR exceeding 7.40%, driven by strong government support and environmental concerns. Explore market size projections, key players (Andritz Group, Engie SA, Vestas), and future trends in this dynamic sector.

                                                              July 2025
                                                              Base Year: 2024
                                                              No Of Pages: 197
                                                              Price: $3800

                                                              Comprehensive Review of France Tidal Power Market Growth Potential

                                                              Discover the booming France Tidal Power Market forecast to 2033! This in-depth analysis reveals a CAGR of 4.54%, driven by government incentives and technological advancements in tidal stream generation. Explore key players, market segments (tidal barrage, stream generation, converters), and growth challenges.

                                                              July 2025
                                                              Base Year: 2024
                                                              No Of Pages: 197
                                                              Price: $3800

                                                              Exploring Global Power Factor Correction Units Market Market Evolution 2025-2033

                                                              Discover the booming global Power Factor Correction (PFC) Units market, projected to reach [estimated 2033 market size] by 2033, growing at a CAGR of 7.10%. This in-depth analysis explores key drivers, trends, restraints, and leading companies like ABB, Schneider Electric, and Siemens, shaping the future of energy efficiency. Learn more about PFC unit market size, growth, and regional shares.

                                                              July 2025
                                                              Base Year: 2024
                                                              No Of Pages: 234
                                                              Price: $4750

                                                              Business Address

                                                              Head Office

                                                              Office no. A 5010, fifth floor, Solitaire Business Hub, Near Phoenix mall, Pune, Maharashtra 411014

                                                              Contact Information

                                                              Craig Francis

                                                              Business Development Head

                                                              +17162654855

                                                              [email protected]

                                                              Connect With Us

                                                              Secure Payment Partners

                                                              payment image
                                                              RetailLogisticsPackagingAutomotiveHealthcareAgricultureEnergy & PowerFood & BeverageAerospace & DefenseChemicals & MaterialsHospitality and TourismAnimal Nutrition & WellnessConsumer Goods and ServicesReal Estate and ConstructionHome and Property ImprovementTechnology, Media and TelecomManufacturing Products and ServicesFinancial Services and Investment Intelligence

                                                              © 2025 All rights reserved


                                                              Privacy Policy
                                                              Terms and Conditions
                                                              FAQ
                                                              • Home
                                                              • About Us
                                                              • Industries
                                                                • Aerospace & Defense
                                                                • Agriculture
                                                                • Animal Nutrition & Wellness
                                                                • Automotive
                                                                • Chemicals & Materials
                                                                • Consumer Goods and Services
                                                                • Energy & Power
                                                                • Financial Services and Investment Intelligence
                                                                • Food & Beverage
                                                                • Home and Property Improvement
                                                                • Hospitality and Tourism
                                                                • Logistics
                                                                • Manufacturing Products and Services
                                                                • Packaging
                                                                • Professional and Commercial Services
                                                                • Real Estate and Construction
                                                                • Retail
                                                                • Technology, Media and Telecom
                                                                • Healthcare
                                                              • Services
                                                              • Contact
                                                              Main Logo
                                                              • Home
                                                              • About Us
                                                              • Industries
                                                                • Aerospace & Defense
                                                                • Agriculture
                                                                • Animal Nutrition & Wellness
                                                                • Automotive
                                                                • Chemicals & Materials
                                                                • Consumer Goods and Services
                                                                • Energy & Power
                                                                • Financial Services and Investment Intelligence
                                                                • Food & Beverage
                                                                • Home and Property Improvement
                                                                • Hospitality and Tourism
                                                                • Logistics
                                                                • Manufacturing Products and Services
                                                                • Packaging
                                                                • Professional and Commercial Services
                                                                • Real Estate and Construction
                                                                • Retail
                                                                • Technology, Media and Telecom
                                                                • Healthcare
                                                              • Services
                                                              • Contact
                                                              +17162654855
                                                              [email protected]

                                                              +17162654855

                                                              [email protected]