
Key Insights
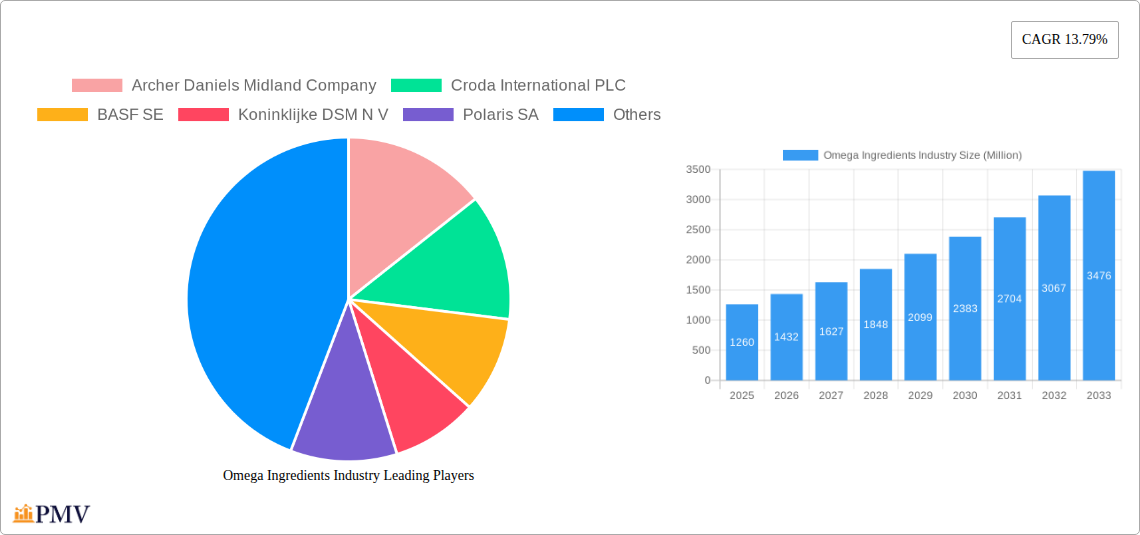
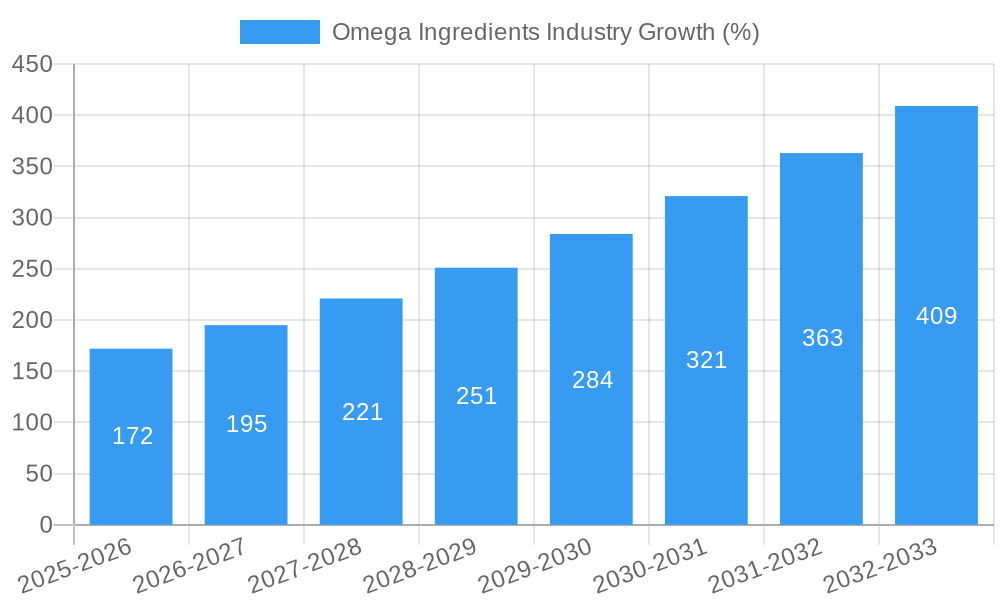
The global omega-3 ingredients market, valued at $1.26 billion in 2025, is projected to experience robust growth, exhibiting a compound annual growth rate (CAGR) of 13.79% from 2025 to 2033. This expansion is driven by several key factors. The increasing awareness of the health benefits associated with omega-3 fatty acids, particularly their role in reducing cardiovascular disease risk and improving cognitive function, is a major catalyst. The rising prevalence of chronic diseases globally further fuels demand for omega-3 supplements and functional foods enriched with these essential fatty acids. Growing consumer preference for natural and clean-label products is also shaping market trends, leading to increased demand for sustainably sourced omega-3 ingredients like algal oil and krill oil. The significant investments in research and development focused on enhancing the bioavailability and efficacy of omega-3 supplements also contribute to market growth. Furthermore, the expanding pet food and animal feed sectors present a promising avenue for omega-3 ingredient manufacturers. However, challenges such as price volatility of raw materials, stringent regulatory requirements, and potential concerns about sustainability of certain sourcing methods pose restraints to market expansion. The market is segmented by type (concentrates, algal oil, cod liver oil, krill oil, menhaden oil, refined tuna oil, anchovy oil, others) and application (functional food and beverage, dietary supplements, infant nutrition, pet food and feed, pharmaceutical, clinical nutrition). Major players like Archer Daniels Midland, Croda International, BASF, and DSM are actively involved in product innovation and market expansion to capitalize on these growth opportunities.
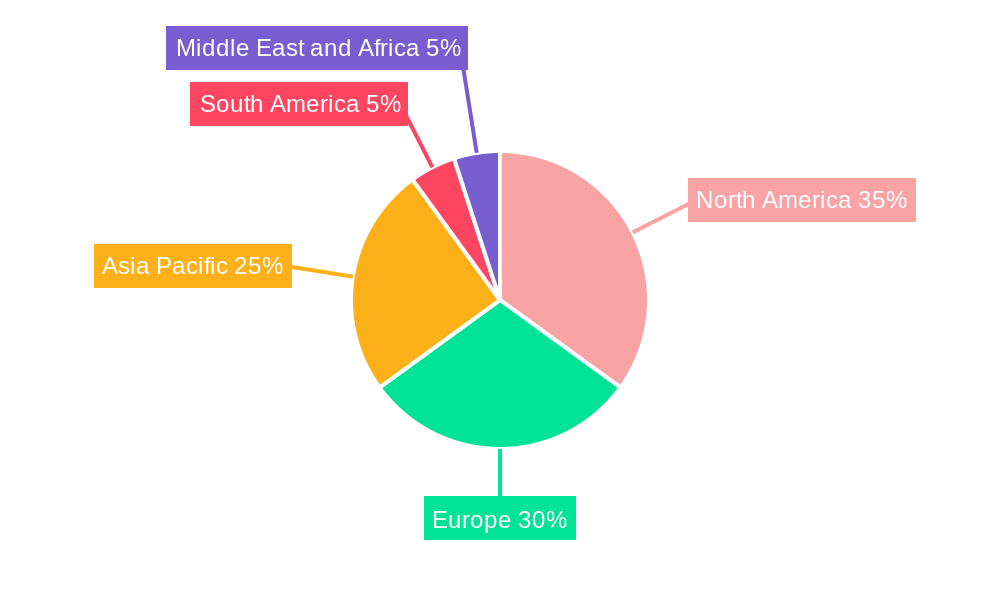
The geographical distribution of the market reflects varying levels of consumer awareness and purchasing power. North America and Europe currently hold significant market shares, driven by high per capita consumption of omega-3 supplements and fortified foods. However, the Asia-Pacific region is anticipated to witness substantial growth in the coming years, fueled by rising disposable incomes and increasing health consciousness among consumers. South America and the Middle East and Africa also present emerging market opportunities, although these regions may face challenges related to infrastructure and consumer education. The overall market outlook remains positive, with continued innovation in product formulations and delivery systems expected to drive further expansion throughout the forecast period. The focus on sustainability and traceability of omega-3 sources is expected to play a significant role in shaping the competitive landscape and consumer choices in the years to come.
Omega Ingredients Industry Market Report: 2019-2033
This comprehensive report provides a detailed analysis of the Omega Ingredients industry, covering market size, segmentation, competitive landscape, and future growth prospects from 2019 to 2033. The report utilizes a robust methodology, incorporating historical data (2019-2024), a base year of 2025, and forecasts extending to 2033. This in-depth analysis is crucial for businesses seeking to navigate the dynamic Omega-3 market, understand evolving consumer preferences, and identify lucrative investment opportunities. The report values are expressed in Millions USD.
Omega Ingredients Industry Market Structure & Competitive Dynamics
The global Omega Ingredients market is characterized by a moderately concentrated structure with several key players holding significant market share. While precise market share figures for each company are proprietary, Archer Daniels Midland Company, Cargill Inc, BASF SE, Koninklijke DSM N V, and Croda International PLC are recognized as major players, commanding a combined xx Million USD in revenue in 2025 (estimated). The industry exhibits a dynamic competitive landscape with ongoing mergers and acquisitions (M&A) activity. Recent M&A deal values have averaged xx Million USD, reflecting the strategic importance of consolidation and expansion within the sector. Innovation ecosystems are vibrant, driven by advancements in extraction technologies, sustainable sourcing practices, and the development of novel omega-3 delivery systems. Regulatory frameworks, particularly concerning food safety and labeling, are rigorously enforced, influencing product development and market access. The industry faces competition from substitutes, including plant-based omega-3 sources, which are gaining traction due to health and ethical considerations. End-user trends reflect a growing demand for functional foods, dietary supplements, and infant nutrition products enriched with omega-3 fatty acids.
- Market Concentration: Moderately concentrated, with top 5 players holding xx% market share (estimated).
- M&A Activity: Average deal value of xx Million USD in recent years.
- Innovation Ecosystems: Strong focus on sustainable sourcing, novel delivery systems, and extraction technologies.
- Regulatory Landscape: Stringent regulations impacting product development and market access.
- Product Substitutes: Increased competition from plant-based omega-3 sources.
- End-User Trends: Rising demand for omega-3 enriched functional foods, dietary supplements, and infant nutrition.
Omega Ingredients Industry Industry Trends & Insights
The Omega Ingredients market is experiencing robust growth, driven by increasing consumer awareness of the health benefits of omega-3 fatty acids. This awareness is fueling demand across various applications, including functional food and beverages, dietary supplements, and infant nutrition. The market is projected to achieve a CAGR of xx% during the forecast period (2025-2033), reaching a value of xx Million USD by 2033. Technological disruptions, such as advancements in algae-based omega-3 production and improved extraction techniques, are enhancing efficiency and sustainability. Consumer preferences are shifting towards sustainably sourced and ethically produced omega-3 ingredients, creating opportunities for companies committed to responsible practices. Competitive dynamics are characterized by innovation, product differentiation, and strategic partnerships, as companies strive to meet evolving consumer demands and secure market share. Market penetration of algal-based omega-3s is steadily increasing, projected to reach xx% by 2033.
Dominant Markets & Segments in Omega Ingredients Industry
The North American region currently dominates the Omega Ingredients market, driven by high consumer demand for omega-3 supplements and functional foods. However, Asia Pacific is anticipated to experience significant growth in the coming years, fueled by rising disposable incomes and increasing health consciousness.
Leading Segments by Type:
- Concentrates: This segment holds the largest market share, driven by its versatility and use in various applications.
- Algal Oil: Experiencing rapid growth due to its sustainable nature and vegan-friendly properties.
- Other Significant Segments: Cod Liver Oil, Krill Oil, Menhaden Oil, Refined Tuna Oil, Anchovy Oil. Each segment exhibits unique growth dynamics based on regional preferences and sourcing conditions.
Leading Segments by Application:
- Dietary Supplements: Remains a dominant application, boosted by consumer self-medication trends.
- Functional Food and Beverage: Shows strong growth potential due to the increasing incorporation of omega-3s in food products.
- Other Significant Segments: Infant nutrition, pet food and feed, pharmaceutical, clinical nutrition. Growth in these segments is driven by specific health benefits and regulatory approvals.
Key Drivers for Dominant Regions and Segments:
- North America: High per capita consumption of dietary supplements, strong regulatory environment.
- Asia Pacific: Rising disposable incomes, growing health awareness, increasing demand for functional foods.
- Europe: Strong regulatory framework promoting sustainable sourcing practices.
Omega Ingredients Industry Product Innovations
Recent years have witnessed significant innovations in omega-3 product development. The introduction of sustainable and vegan omega-3 alternatives, such as Alga3 by KD Pharma Group, represents a key development. Companies are focusing on improving the bioavailability and stability of omega-3 ingredients through advanced encapsulation and delivery systems. These innovations cater to growing consumer demand for convenient, effective, and ethically sourced products, while also addressing supply chain challenges associated with traditional fish oil sourcing.
Report Segmentation & Scope
This report comprehensively segments the Omega Ingredients market by Type (Concentrates, Algal Oil, Cod Liver Oil, Krill Oil, Menhaden Oil, Refined Tuna Oil, Anchovy Oil, Others Oil Types) and Application (Functional Food and Beverage, Dietary Supplements, Infant Nutrition, Pet food and Feed, Pharmaceutical, Clinical Nutrition). Each segment's market size, growth projections, and competitive dynamics are analyzed in detail. The report projects significant growth across all segments, with algal oil and concentrates showing the highest growth potential. Competitive intensity varies across segments, with some characterized by a higher degree of concentration than others.
Key Drivers of Omega Ingredients Industry Growth
The Omega Ingredients market's growth is propelled by several key factors: increasing consumer awareness of omega-3 benefits, rising demand for functional foods and dietary supplements, technological advancements leading to more sustainable and efficient production methods, and supportive regulatory environments promoting omega-3 consumption. The expanding global population and the growing prevalence of chronic diseases further contribute to market expansion.
Challenges in the Omega Ingredients Industry Sector
The Omega Ingredients industry faces challenges related to fluctuating raw material prices, maintaining consistent product quality, ensuring sustainable sourcing practices, complying with stringent regulatory requirements, and managing intense competition from both established players and emerging competitors. Supply chain disruptions can significantly impact production costs and market availability.
Leading Players in the Omega Ingredients Industry Market
- Archer Daniels Midland Company
- Croda International PLC
- BASF SE
- Koninklijke DSM N V
- Polaris SA
- Aker BioMarine
- Corbion N V
- Omega Protein Corporation
- Cargill Inc
- Pelagia AS
Key Developments in Omega Ingredients Industry Sector
- October 2021: GC Rieber VivoMega announced expansion plans for production facilities.
- September 2021: KD Pharma Group launched Alga3, a sustainable vegan omega-3 solution.
- May 2021: AlgaeCytes Limited announced plans for a new commercial plant in Germany.
Strategic Omega Ingredients Industry Market Outlook
The Omega Ingredients market presents significant growth opportunities in the coming years. Continued innovation in sustainable sourcing, improved extraction technologies, and the development of novel delivery systems will drive market expansion. Companies focusing on product differentiation, strong branding, and strategic partnerships will be best positioned to capture market share. The growing demand for omega-3s across various applications and regions presents a promising outlook for industry players.
Omega Ingredients Industry Segmentation
-
1. Type
- 1.1. Concentrates
- 1.2. Algal Oil
- 1.3. Cod Liver Oil
- 1.4. Krill Oil
- 1.5. Menhaden Oil
- 1.6. Refined Tuna Oil
- 1.7. Anchovy Oil
- 1.8. Others Oil Types
-
2. Application
- 2.1. Functional Food and Beverage
- 2.2. Dietary Supplements
- 2.3. Infant Nutrition
- 2.4. Pet food and Feed
- 2.5. Pharmaceutical
- 2.6. Clinical Nutrition
Omega Ingredients Industry Segmentation By Geography
-
1. North America
- 1.1. United States
- 1.2. Canada
- 1.3. Mexico
- 1.4. Rest of North America
-
2. Europe
- 2.1. United Kingdom
- 2.2. Germany
- 2.3. Spain
- 2.4. France
- 2.5. Italy
- 2.6. Russia
- 2.7. Rest of Europe
-
3. Asia Pacific
- 3.1. China
- 3.2. Japan
- 3.3. India
- 3.4. Australia
- 3.5. Rest of Asia Pacific
-
4. South America
- 4.1. Brazil
- 4.2. Argentina
- 4.3. Rest of South America
-
5. Middle East and Africa
- 5.1. United Arab Emirates
- 5.2. South Africa
- 5.3. Rest of Middle East and Africa
Omega Ingredients Industry REPORT HIGHLIGHTS
| Aspects | Details |
|---|---|
| Study Period | 2019-2033 |
| Base Year | 2024 |
| Estimated Year | 2025 |
| Forecast Period | 2025-2033 |
| Historical Period | 2019-2024 |
| Growth Rate | CAGR of 13.79% from 2019-2033 |
| Segmentation |
|
Table of Contents
- 1. Introduction
- 1.1. Research Scope
- 1.2. Market Segmentation
- 1.3. Research Methodology
- 1.4. Definitions and Assumptions
- 2. Executive Summary
- 2.1. Introduction
- 3. Market Dynamics
- 3.1. Introduction
- 3.2. Market Drivers
- 3.2.1. The Rising Awareness of the Health Benefits Associated with Collagen Consumption; Rising Sport and Fitness Trends Drives the Market Growth
- 3.3. Market Restrains
- 3.3.1. Concerns over the Source and Animal Welfare in Collagen Extraction Limit the Market Growth
- 3.4. Market Trends
- 3.4.1. Immense Growth in Concentrated Forms of Algal Omega-3 Ingredients
- 4. Market Factor Analysis
- 4.1. Porters Five Forces
- 4.2. Supply/Value Chain
- 4.3. PESTEL analysis
- 4.4. Market Entropy
- 4.5. Patent/Trademark Analysis
- 5. Global Omega Ingredients Industry Analysis, Insights and Forecast, 2019-2031
- 5.1. Market Analysis, Insights and Forecast - by Type
- 5.1.1. Concentrates
- 5.1.2. Algal Oil
- 5.1.3. Cod Liver Oil
- 5.1.4. Krill Oil
- 5.1.5. Menhaden Oil
- 5.1.6. Refined Tuna Oil
- 5.1.7. Anchovy Oil
- 5.1.8. Others Oil Types
- 5.2. Market Analysis, Insights and Forecast - by Application
- 5.2.1. Functional Food and Beverage
- 5.2.2. Dietary Supplements
- 5.2.3. Infant Nutrition
- 5.2.4. Pet food and Feed
- 5.2.5. Pharmaceutical
- 5.2.6. Clinical Nutrition
- 5.3. Market Analysis, Insights and Forecast - by Region
- 5.3.1. North America
- 5.3.2. Europe
- 5.3.3. Asia Pacific
- 5.3.4. South America
- 5.3.5. Middle East and Africa
- 5.1. Market Analysis, Insights and Forecast - by Type
- 6. North America Omega Ingredients Industry Analysis, Insights and Forecast, 2019-2031
- 6.1. Market Analysis, Insights and Forecast - by Type
- 6.1.1. Concentrates
- 6.1.2. Algal Oil
- 6.1.3. Cod Liver Oil
- 6.1.4. Krill Oil
- 6.1.5. Menhaden Oil
- 6.1.6. Refined Tuna Oil
- 6.1.7. Anchovy Oil
- 6.1.8. Others Oil Types
- 6.2. Market Analysis, Insights and Forecast - by Application
- 6.2.1. Functional Food and Beverage
- 6.2.2. Dietary Supplements
- 6.2.3. Infant Nutrition
- 6.2.4. Pet food and Feed
- 6.2.5. Pharmaceutical
- 6.2.6. Clinical Nutrition
- 6.1. Market Analysis, Insights and Forecast - by Type
- 7. Europe Omega Ingredients Industry Analysis, Insights and Forecast, 2019-2031
- 7.1. Market Analysis, Insights and Forecast - by Type
- 7.1.1. Concentrates
- 7.1.2. Algal Oil
- 7.1.3. Cod Liver Oil
- 7.1.4. Krill Oil
- 7.1.5. Menhaden Oil
- 7.1.6. Refined Tuna Oil
- 7.1.7. Anchovy Oil
- 7.1.8. Others Oil Types
- 7.2. Market Analysis, Insights and Forecast - by Application
- 7.2.1. Functional Food and Beverage
- 7.2.2. Dietary Supplements
- 7.2.3. Infant Nutrition
- 7.2.4. Pet food and Feed
- 7.2.5. Pharmaceutical
- 7.2.6. Clinical Nutrition
- 7.1. Market Analysis, Insights and Forecast - by Type
- 8. Asia Pacific Omega Ingredients Industry Analysis, Insights and Forecast, 2019-2031
- 8.1. Market Analysis, Insights and Forecast - by Type
- 8.1.1. Concentrates
- 8.1.2. Algal Oil
- 8.1.3. Cod Liver Oil
- 8.1.4. Krill Oil
- 8.1.5. Menhaden Oil
- 8.1.6. Refined Tuna Oil
- 8.1.7. Anchovy Oil
- 8.1.8. Others Oil Types
- 8.2. Market Analysis, Insights and Forecast - by Application
- 8.2.1. Functional Food and Beverage
- 8.2.2. Dietary Supplements
- 8.2.3. Infant Nutrition
- 8.2.4. Pet food and Feed
- 8.2.5. Pharmaceutical
- 8.2.6. Clinical Nutrition
- 8.1. Market Analysis, Insights and Forecast - by Type
- 9. South America Omega Ingredients Industry Analysis, Insights and Forecast, 2019-2031
- 9.1. Market Analysis, Insights and Forecast - by Type
- 9.1.1. Concentrates
- 9.1.2. Algal Oil
- 9.1.3. Cod Liver Oil
- 9.1.4. Krill Oil
- 9.1.5. Menhaden Oil
- 9.1.6. Refined Tuna Oil
- 9.1.7. Anchovy Oil
- 9.1.8. Others Oil Types
- 9.2. Market Analysis, Insights and Forecast - by Application
- 9.2.1. Functional Food and Beverage
- 9.2.2. Dietary Supplements
- 9.2.3. Infant Nutrition
- 9.2.4. Pet food and Feed
- 9.2.5. Pharmaceutical
- 9.2.6. Clinical Nutrition
- 9.1. Market Analysis, Insights and Forecast - by Type
- 10. Middle East and Africa Omega Ingredients Industry Analysis, Insights and Forecast, 2019-2031
- 10.1. Market Analysis, Insights and Forecast - by Type
- 10.1.1. Concentrates
- 10.1.2. Algal Oil
- 10.1.3. Cod Liver Oil
- 10.1.4. Krill Oil
- 10.1.5. Menhaden Oil
- 10.1.6. Refined Tuna Oil
- 10.1.7. Anchovy Oil
- 10.1.8. Others Oil Types
- 10.2. Market Analysis, Insights and Forecast - by Application
- 10.2.1. Functional Food and Beverage
- 10.2.2. Dietary Supplements
- 10.2.3. Infant Nutrition
- 10.2.4. Pet food and Feed
- 10.2.5. Pharmaceutical
- 10.2.6. Clinical Nutrition
- 10.1. Market Analysis, Insights and Forecast - by Type
- 11. North America Omega Ingredients Industry Analysis, Insights and Forecast, 2019-2031
- 11.1. Market Analysis, Insights and Forecast - By Country/Sub-region
- 11.1.1 United States
- 11.1.2 Canada
- 11.1.3 Mexico
- 11.1.4 Rest of North America
- 12. Europe Omega Ingredients Industry Analysis, Insights and Forecast, 2019-2031
- 12.1. Market Analysis, Insights and Forecast - By Country/Sub-region
- 12.1.1 United Kingdom
- 12.1.2 Germany
- 12.1.3 Spain
- 12.1.4 France
- 12.1.5 Italy
- 12.1.6 Russia
- 12.1.7 Rest of Europe
- 13. Asia Pacific Omega Ingredients Industry Analysis, Insights and Forecast, 2019-2031
- 13.1. Market Analysis, Insights and Forecast - By Country/Sub-region
- 13.1.1 China
- 13.1.2 Japan
- 13.1.3 India
- 13.1.4 Australia
- 13.1.5 Rest of Asia Pacific
- 14. South America Omega Ingredients Industry Analysis, Insights and Forecast, 2019-2031
- 14.1. Market Analysis, Insights and Forecast - By Country/Sub-region
- 14.1.1 Brazil
- 14.1.2 Argentina
- 14.1.3 Rest of South America
- 15. Middle East and Africa Omega Ingredients Industry Analysis, Insights and Forecast, 2019-2031
- 15.1. Market Analysis, Insights and Forecast - By Country/Sub-region
- 15.1.1 United Arab Emirates
- 15.1.2 South Africa
- 15.1.3 Rest of Middle East and Africa
- 16. Competitive Analysis
- 16.1. Global Market Share Analysis 2024
- 16.2. Company Profiles
- 16.2.1 Archer Daniels Midland Company
- 16.2.1.1. Overview
- 16.2.1.2. Products
- 16.2.1.3. SWOT Analysis
- 16.2.1.4. Recent Developments
- 16.2.1.5. Financials (Based on Availability)
- 16.2.2 Croda International PLC
- 16.2.2.1. Overview
- 16.2.2.2. Products
- 16.2.2.3. SWOT Analysis
- 16.2.2.4. Recent Developments
- 16.2.2.5. Financials (Based on Availability)
- 16.2.3 BASF SE
- 16.2.3.1. Overview
- 16.2.3.2. Products
- 16.2.3.3. SWOT Analysis
- 16.2.3.4. Recent Developments
- 16.2.3.5. Financials (Based on Availability)
- 16.2.4 Koninklijke DSM N V
- 16.2.4.1. Overview
- 16.2.4.2. Products
- 16.2.4.3. SWOT Analysis
- 16.2.4.4. Recent Developments
- 16.2.4.5. Financials (Based on Availability)
- 16.2.5 Polaris SA
- 16.2.5.1. Overview
- 16.2.5.2. Products
- 16.2.5.3. SWOT Analysis
- 16.2.5.4. Recent Developments
- 16.2.5.5. Financials (Based on Availability)
- 16.2.6 Aker BioMarine*List Not Exhaustive
- 16.2.6.1. Overview
- 16.2.6.2. Products
- 16.2.6.3. SWOT Analysis
- 16.2.6.4. Recent Developments
- 16.2.6.5. Financials (Based on Availability)
- 16.2.7 Corbion N V
- 16.2.7.1. Overview
- 16.2.7.2. Products
- 16.2.7.3. SWOT Analysis
- 16.2.7.4. Recent Developments
- 16.2.7.5. Financials (Based on Availability)
- 16.2.8 Omega Protein Corporation
- 16.2.8.1. Overview
- 16.2.8.2. Products
- 16.2.8.3. SWOT Analysis
- 16.2.8.4. Recent Developments
- 16.2.8.5. Financials (Based on Availability)
- 16.2.9 Cargill Inc
- 16.2.9.1. Overview
- 16.2.9.2. Products
- 16.2.9.3. SWOT Analysis
- 16.2.9.4. Recent Developments
- 16.2.9.5. Financials (Based on Availability)
- 16.2.10 Pelagia AS
- 16.2.10.1. Overview
- 16.2.10.2. Products
- 16.2.10.3. SWOT Analysis
- 16.2.10.4. Recent Developments
- 16.2.10.5. Financials (Based on Availability)
- 16.2.1 Archer Daniels Midland Company
List of Figures
- Figure 1: Global Omega Ingredients Industry Revenue Breakdown (Million, %) by Region 2024 & 2032
- Figure 2: North America Omega Ingredients Industry Revenue (Million), by Country 2024 & 2032
- Figure 3: North America Omega Ingredients Industry Revenue Share (%), by Country 2024 & 2032
- Figure 4: Europe Omega Ingredients Industry Revenue (Million), by Country 2024 & 2032
- Figure 5: Europe Omega Ingredients Industry Revenue Share (%), by Country 2024 & 2032
- Figure 6: Asia Pacific Omega Ingredients Industry Revenue (Million), by Country 2024 & 2032
- Figure 7: Asia Pacific Omega Ingredients Industry Revenue Share (%), by Country 2024 & 2032
- Figure 8: South America Omega Ingredients Industry Revenue (Million), by Country 2024 & 2032
- Figure 9: South America Omega Ingredients Industry Revenue Share (%), by Country 2024 & 2032
- Figure 10: Middle East and Africa Omega Ingredients Industry Revenue (Million), by Country 2024 & 2032
- Figure 11: Middle East and Africa Omega Ingredients Industry Revenue Share (%), by Country 2024 & 2032
- Figure 12: North America Omega Ingredients Industry Revenue (Million), by Type 2024 & 2032
- Figure 13: North America Omega Ingredients Industry Revenue Share (%), by Type 2024 & 2032
- Figure 14: North America Omega Ingredients Industry Revenue (Million), by Application 2024 & 2032
- Figure 15: North America Omega Ingredients Industry Revenue Share (%), by Application 2024 & 2032
- Figure 16: North America Omega Ingredients Industry Revenue (Million), by Country 2024 & 2032
- Figure 17: North America Omega Ingredients Industry Revenue Share (%), by Country 2024 & 2032
- Figure 18: Europe Omega Ingredients Industry Revenue (Million), by Type 2024 & 2032
- Figure 19: Europe Omega Ingredients Industry Revenue Share (%), by Type 2024 & 2032
- Figure 20: Europe Omega Ingredients Industry Revenue (Million), by Application 2024 & 2032
- Figure 21: Europe Omega Ingredients Industry Revenue Share (%), by Application 2024 & 2032
- Figure 22: Europe Omega Ingredients Industry Revenue (Million), by Country 2024 & 2032
- Figure 23: Europe Omega Ingredients Industry Revenue Share (%), by Country 2024 & 2032
- Figure 24: Asia Pacific Omega Ingredients Industry Revenue (Million), by Type 2024 & 2032
- Figure 25: Asia Pacific Omega Ingredients Industry Revenue Share (%), by Type 2024 & 2032
- Figure 26: Asia Pacific Omega Ingredients Industry Revenue (Million), by Application 2024 & 2032
- Figure 27: Asia Pacific Omega Ingredients Industry Revenue Share (%), by Application 2024 & 2032
- Figure 28: Asia Pacific Omega Ingredients Industry Revenue (Million), by Country 2024 & 2032
- Figure 29: Asia Pacific Omega Ingredients Industry Revenue Share (%), by Country 2024 & 2032
- Figure 30: South America Omega Ingredients Industry Revenue (Million), by Type 2024 & 2032
- Figure 31: South America Omega Ingredients Industry Revenue Share (%), by Type 2024 & 2032
- Figure 32: South America Omega Ingredients Industry Revenue (Million), by Application 2024 & 2032
- Figure 33: South America Omega Ingredients Industry Revenue Share (%), by Application 2024 & 2032
- Figure 34: South America Omega Ingredients Industry Revenue (Million), by Country 2024 & 2032
- Figure 35: South America Omega Ingredients Industry Revenue Share (%), by Country 2024 & 2032
- Figure 36: Middle East and Africa Omega Ingredients Industry Revenue (Million), by Type 2024 & 2032
- Figure 37: Middle East and Africa Omega Ingredients Industry Revenue Share (%), by Type 2024 & 2032
- Figure 38: Middle East and Africa Omega Ingredients Industry Revenue (Million), by Application 2024 & 2032
- Figure 39: Middle East and Africa Omega Ingredients Industry Revenue Share (%), by Application 2024 & 2032
- Figure 40: Middle East and Africa Omega Ingredients Industry Revenue (Million), by Country 2024 & 2032
- Figure 41: Middle East and Africa Omega Ingredients Industry Revenue Share (%), by Country 2024 & 2032
List of Tables
- Table 1: Global Omega Ingredients Industry Revenue Million Forecast, by Region 2019 & 2032
- Table 2: Global Omega Ingredients Industry Revenue Million Forecast, by Type 2019 & 2032
- Table 3: Global Omega Ingredients Industry Revenue Million Forecast, by Application 2019 & 2032
- Table 4: Global Omega Ingredients Industry Revenue Million Forecast, by Region 2019 & 2032
- Table 5: Global Omega Ingredients Industry Revenue Million Forecast, by Country 2019 & 2032
- Table 6: United States Omega Ingredients Industry Revenue (Million) Forecast, by Application 2019 & 2032
- Table 7: Canada Omega Ingredients Industry Revenue (Million) Forecast, by Application 2019 & 2032
- Table 8: Mexico Omega Ingredients Industry Revenue (Million) Forecast, by Application 2019 & 2032
- Table 9: Rest of North America Omega Ingredients Industry Revenue (Million) Forecast, by Application 2019 & 2032
- Table 10: Global Omega Ingredients Industry Revenue Million Forecast, by Country 2019 & 2032
- Table 11: United Kingdom Omega Ingredients Industry Revenue (Million) Forecast, by Application 2019 & 2032
- Table 12: Germany Omega Ingredients Industry Revenue (Million) Forecast, by Application 2019 & 2032
- Table 13: Spain Omega Ingredients Industry Revenue (Million) Forecast, by Application 2019 & 2032
- Table 14: France Omega Ingredients Industry Revenue (Million) Forecast, by Application 2019 & 2032
- Table 15: Italy Omega Ingredients Industry Revenue (Million) Forecast, by Application 2019 & 2032
- Table 16: Russia Omega Ingredients Industry Revenue (Million) Forecast, by Application 2019 & 2032
- Table 17: Rest of Europe Omega Ingredients Industry Revenue (Million) Forecast, by Application 2019 & 2032
- Table 18: Global Omega Ingredients Industry Revenue Million Forecast, by Country 2019 & 2032
- Table 19: China Omega Ingredients Industry Revenue (Million) Forecast, by Application 2019 & 2032
- Table 20: Japan Omega Ingredients Industry Revenue (Million) Forecast, by Application 2019 & 2032
- Table 21: India Omega Ingredients Industry Revenue (Million) Forecast, by Application 2019 & 2032
- Table 22: Australia Omega Ingredients Industry Revenue (Million) Forecast, by Application 2019 & 2032
- Table 23: Rest of Asia Pacific Omega Ingredients Industry Revenue (Million) Forecast, by Application 2019 & 2032
- Table 24: Global Omega Ingredients Industry Revenue Million Forecast, by Country 2019 & 2032
- Table 25: Brazil Omega Ingredients Industry Revenue (Million) Forecast, by Application 2019 & 2032
- Table 26: Argentina Omega Ingredients Industry Revenue (Million) Forecast, by Application 2019 & 2032
- Table 27: Rest of South America Omega Ingredients Industry Revenue (Million) Forecast, by Application 2019 & 2032
- Table 28: Global Omega Ingredients Industry Revenue Million Forecast, by Country 2019 & 2032
- Table 29: United Arab Emirates Omega Ingredients Industry Revenue (Million) Forecast, by Application 2019 & 2032
- Table 30: South Africa Omega Ingredients Industry Revenue (Million) Forecast, by Application 2019 & 2032
- Table 31: Rest of Middle East and Africa Omega Ingredients Industry Revenue (Million) Forecast, by Application 2019 & 2032
- Table 32: Global Omega Ingredients Industry Revenue Million Forecast, by Type 2019 & 2032
- Table 33: Global Omega Ingredients Industry Revenue Million Forecast, by Application 2019 & 2032
- Table 34: Global Omega Ingredients Industry Revenue Million Forecast, by Country 2019 & 2032
- Table 35: United States Omega Ingredients Industry Revenue (Million) Forecast, by Application 2019 & 2032
- Table 36: Canada Omega Ingredients Industry Revenue (Million) Forecast, by Application 2019 & 2032
- Table 37: Mexico Omega Ingredients Industry Revenue (Million) Forecast, by Application 2019 & 2032
- Table 38: Rest of North America Omega Ingredients Industry Revenue (Million) Forecast, by Application 2019 & 2032
- Table 39: Global Omega Ingredients Industry Revenue Million Forecast, by Type 2019 & 2032
- Table 40: Global Omega Ingredients Industry Revenue Million Forecast, by Application 2019 & 2032
- Table 41: Global Omega Ingredients Industry Revenue Million Forecast, by Country 2019 & 2032
- Table 42: United Kingdom Omega Ingredients Industry Revenue (Million) Forecast, by Application 2019 & 2032
- Table 43: Germany Omega Ingredients Industry Revenue (Million) Forecast, by Application 2019 & 2032
- Table 44: Spain Omega Ingredients Industry Revenue (Million) Forecast, by Application 2019 & 2032
- Table 45: France Omega Ingredients Industry Revenue (Million) Forecast, by Application 2019 & 2032
- Table 46: Italy Omega Ingredients Industry Revenue (Million) Forecast, by Application 2019 & 2032
- Table 47: Russia Omega Ingredients Industry Revenue (Million) Forecast, by Application 2019 & 2032
- Table 48: Rest of Europe Omega Ingredients Industry Revenue (Million) Forecast, by Application 2019 & 2032
- Table 49: Global Omega Ingredients Industry Revenue Million Forecast, by Type 2019 & 2032
- Table 50: Global Omega Ingredients Industry Revenue Million Forecast, by Application 2019 & 2032
- Table 51: Global Omega Ingredients Industry Revenue Million Forecast, by Country 2019 & 2032
- Table 52: China Omega Ingredients Industry Revenue (Million) Forecast, by Application 2019 & 2032
- Table 53: Japan Omega Ingredients Industry Revenue (Million) Forecast, by Application 2019 & 2032
- Table 54: India Omega Ingredients Industry Revenue (Million) Forecast, by Application 2019 & 2032
- Table 55: Australia Omega Ingredients Industry Revenue (Million) Forecast, by Application 2019 & 2032
- Table 56: Rest of Asia Pacific Omega Ingredients Industry Revenue (Million) Forecast, by Application 2019 & 2032
- Table 57: Global Omega Ingredients Industry Revenue Million Forecast, by Type 2019 & 2032
- Table 58: Global Omega Ingredients Industry Revenue Million Forecast, by Application 2019 & 2032
- Table 59: Global Omega Ingredients Industry Revenue Million Forecast, by Country 2019 & 2032
- Table 60: Brazil Omega Ingredients Industry Revenue (Million) Forecast, by Application 2019 & 2032
- Table 61: Argentina Omega Ingredients Industry Revenue (Million) Forecast, by Application 2019 & 2032
- Table 62: Rest of South America Omega Ingredients Industry Revenue (Million) Forecast, by Application 2019 & 2032
- Table 63: Global Omega Ingredients Industry Revenue Million Forecast, by Type 2019 & 2032
- Table 64: Global Omega Ingredients Industry Revenue Million Forecast, by Application 2019 & 2032
- Table 65: Global Omega Ingredients Industry Revenue Million Forecast, by Country 2019 & 2032
- Table 66: United Arab Emirates Omega Ingredients Industry Revenue (Million) Forecast, by Application 2019 & 2032
- Table 67: South Africa Omega Ingredients Industry Revenue (Million) Forecast, by Application 2019 & 2032
- Table 68: Rest of Middle East and Africa Omega Ingredients Industry Revenue (Million) Forecast, by Application 2019 & 2032
Frequently Asked Questions
1. What is the projected Compound Annual Growth Rate (CAGR) of the Omega Ingredients Industry?
The projected CAGR is approximately 13.79%.
2. Which companies are prominent players in the Omega Ingredients Industry?
Key companies in the market include Archer Daniels Midland Company, Croda International PLC, BASF SE, Koninklijke DSM N V, Polaris SA, Aker BioMarine*List Not Exhaustive, Corbion N V, Omega Protein Corporation, Cargill Inc, Pelagia AS.
3. What are the main segments of the Omega Ingredients Industry?
The market segments include Type, Application.
4. Can you provide details about the market size?
The market size is estimated to be USD 1.26 Million as of 2022.
5. What are some drivers contributing to market growth?
The Rising Awareness of the Health Benefits Associated with Collagen Consumption; Rising Sport and Fitness Trends Drives the Market Growth.
6. What are the notable trends driving market growth?
Immense Growth in Concentrated Forms of Algal Omega-3 Ingredients.
7. Are there any restraints impacting market growth?
Concerns over the Source and Animal Welfare in Collagen Extraction Limit the Market Growth.
8. Can you provide examples of recent developments in the market?
In October 2021, Omega-3 concentrates supplier GC Rieber VivoMega announced its plans to expand production facilities and storage tanks to accommodate more ingredients in the upcoming years.
9. What pricing options are available for accessing the report?
Pricing options include single-user, multi-user, and enterprise licenses priced at USD 4750, USD 5250, and USD 8750 respectively.
10. Is the market size provided in terms of value or volume?
The market size is provided in terms of value, measured in Million.
11. Are there any specific market keywords associated with the report?
Yes, the market keyword associated with the report is "Omega Ingredients Industry," which aids in identifying and referencing the specific market segment covered.
12. How do I determine which pricing option suits my needs best?
The pricing options vary based on user requirements and access needs. Individual users may opt for single-user licenses, while businesses requiring broader access may choose multi-user or enterprise licenses for cost-effective access to the report.
13. Are there any additional resources or data provided in the Omega Ingredients Industry report?
While the report offers comprehensive insights, it's advisable to review the specific contents or supplementary materials provided to ascertain if additional resources or data are available.
14. How can I stay updated on further developments or reports in the Omega Ingredients Industry?
To stay informed about further developments, trends, and reports in the Omega Ingredients Industry, consider subscribing to industry newsletters, following relevant companies and organizations, or regularly checking reputable industry news sources and publications.
Methodology
Step 1 - Identification of Relevant Samples Size from Population Database


Step 2 - Approaches for Defining Global Market Size (Value, Volume* & Price*)

Note*: In applicable scenarios
Step 3 - Data Sources
Primary Research
- Web Analytics
- Survey Reports
- Research Institute
- Latest Research Reports
- Opinion Leaders
Secondary Research
- Annual Reports
- White Paper
- Latest Press Release
- Industry Association
- Paid Database
- Investor Presentations

Step 4 - Data Triangulation
Involves using different sources of information in order to increase the validity of a study
These sources are likely to be stakeholders in a program - participants, other researchers, program staff, other community members, and so on.
Then we put all data in single framework & apply various statistical tools to find out the dynamic on the market.
During the analysis stage, feedback from the stakeholder groups would be compared to determine areas of agreement as well as areas of divergence


