
Key Insights
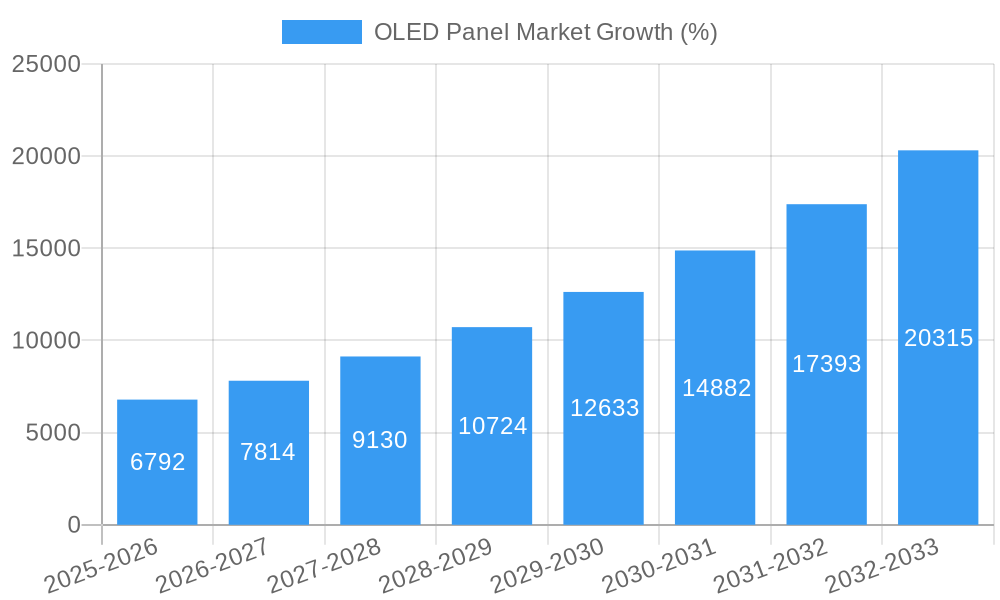
The OLED panel market, valued at $51.63 billion in 2025, is projected to experience robust growth, driven by increasing demand across various applications. A Compound Annual Growth Rate (CAGR) of 13.19% from 2025 to 2033 indicates a significant expansion, propelled by several key factors. The rising adoption of OLED technology in smartphones, tablets, and televisions fuels market expansion. Furthermore, the automotive industry's increasing integration of OLED displays in dashboards and infotainment systems contributes significantly to market growth. The burgeoning wearable technology sector, with its demand for high-quality, energy-efficient displays, also presents a substantial opportunity. Flexible and transparent OLED panels are emerging as key trends, opening doors to innovative product designs and applications in diverse sectors, including healthcare and home appliances. While potential production costs and the competitive landscape pose some challenges, the overall market outlook remains optimistic, fueled by ongoing technological advancements and increasing consumer preference for superior display quality.
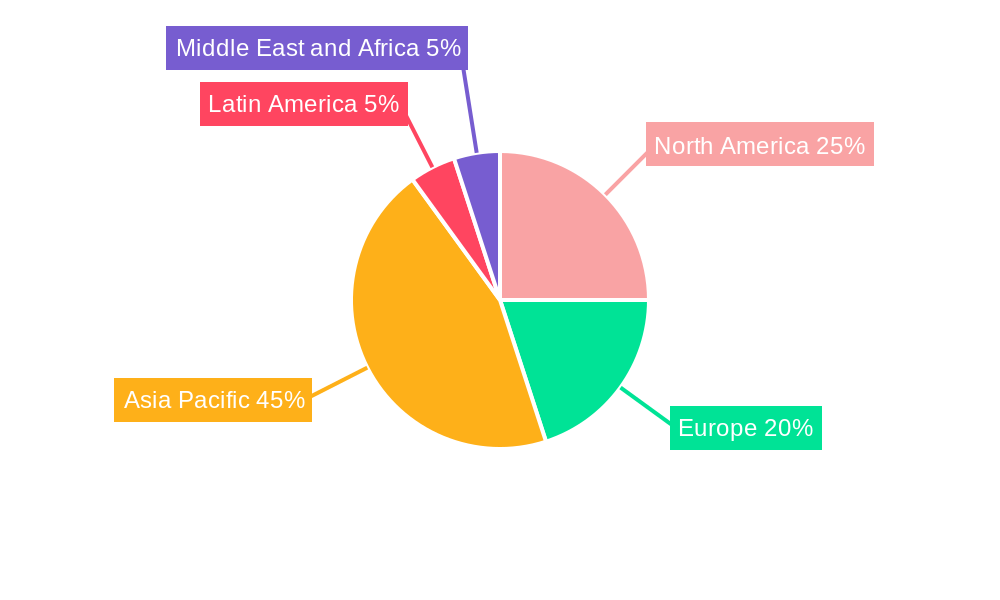
Segment-wise, the large-sized OLED panel segment is expected to dominate due to its widespread use in televisions. The AMOLED display type will likely maintain a leading position owing to its superior performance characteristics. Geographically, Asia Pacific, particularly China and South Korea, are anticipated to hold the largest market share, driven by significant manufacturing capabilities and high consumer demand. North America and Europe are also expected to witness substantial growth, fueled by increasing adoption of OLED technology across various applications. However, maintaining consistent growth will require navigating challenges like supply chain complexities and competition from alternative display technologies. Strategic collaborations, technological innovations, and focusing on niche applications will be crucial for market players to thrive in this dynamic and rapidly evolving market.

OLED Panel Market: A Comprehensive Report (2019-2033)
This in-depth report provides a comprehensive analysis of the global OLED Panel market, covering historical data (2019-2024), the estimated year (2025), and a detailed forecast (2025-2033). It delves into market segmentation, competitive dynamics, technological advancements, and key growth drivers, offering invaluable insights for industry professionals, investors, and strategic decision-makers. The report projects a xx Million market value by 2033, exhibiting a CAGR of xx% during the forecast period.
OLED Panel Market Market Structure & Competitive Dynamics
The OLED panel market is characterized by a moderately concentrated structure, with a few major players holding significant market share. LG Display Co Ltd and Samsung Display Co Ltd are dominant forces, shaping technological advancements and setting industry standards. However, smaller players like Visionox Co Ltd, OSRAM OLED GmbH, and others are actively contributing to innovation and expansion, fostering a dynamic competitive landscape.
Market concentration is further influenced by mergers and acquisitions (M&A) activities. While precise deal values are not publicly available for all transactions, significant M&A activity has been observed in recent years, driving consolidation and shaping market power dynamics. The average deal value is estimated to be around xx Million.
Innovation ecosystems play a vital role, with collaborative efforts between panel manufacturers, material suppliers, and equipment providers fueling technological progress. Regulatory frameworks, such as environmental regulations and safety standards, impact the production and adoption of OLED panels. Product substitutes, including LCD and micro-LED technologies, pose a competitive threat, although OLED's superior image quality remains a significant advantage. End-user trends, particularly the increasing demand for high-resolution displays in consumer electronics and automotive applications, drive market growth.
- Key Metrics:
- LG Display and Samsung Display combined hold approximately xx% of the market share (estimated).
- Average M&A deal value: xx Million (estimated).
- Number of M&A deals in the last 5 years: xx (estimated).
OLED Panel Market Industry Trends & Insights
The OLED panel market is experiencing robust growth, driven by several key factors. The increasing demand for high-resolution, energy-efficient displays across various applications, including smartphones, televisions, and automobiles, is a major catalyst. Technological advancements, such as the development of flexible and foldable OLED panels, are further fueling market expansion. Consumer preferences are shifting towards premium displays with superior picture quality, contrast, and viewing angles, bolstering the adoption of OLED technology. The rising disposable incomes in emerging economies also contribute to the market's growth trajectory.
The competitive landscape is highly dynamic, with leading players investing heavily in research and development to enhance display performance and reduce manufacturing costs. The introduction of innovative features like self-emissive pixels, wide color gamut capabilities, and improved burn-in resistance solidifies the technology's appeal. Market penetration is rapidly increasing, particularly in high-value segments such as premium smartphones and high-end televisions. The CAGR for the forecast period is estimated at xx%, driven by the aforementioned factors.
Dominant Markets & Segments in OLED Panel Market
The dominant segment within the OLED Panel market varies depending on the categorization:
By Size: Large-sized OLED panels (primarily for televisions) currently hold the largest market share due to their increasing demand in premium TV segments. Key drivers include the growing popularity of home entertainment systems and the increasing affordability of large OLED TVs.
By Product: Televisions constitute the largest segment, driven by the superior picture quality and features offered by OLED TVs. Mobile and Tablet segments are also significant contributors but are experiencing slower growth compared to the TV segment. The automotive segment is witnessing a rapid increase due to the growing demand for advanced driver-assistance systems (ADAS).
By Type: Rigid OLED panels presently dominate the market due to their established manufacturing processes and cost-effectiveness. However, the flexible OLED panel segment is witnessing high growth, spurred by innovations in foldable and flexible displays.
By Display Address Scheme: AMOLED (Active-Matrix Organic Light-Emitting Diode) displays constitute the majority of the market, offering higher resolutions and faster response times.
Geographic Dominance: The Asia-Pacific region is currently the leading market for OLED panels, driven by high demand from China, South Korea, and Japan. Key drivers include strong consumer electronics manufacturing bases and supportive government policies. North America and Europe also represent important markets, exhibiting substantial demand for OLED displays.
OLED Panel Market Product Innovations
Recent innovations in OLED panel technology include advancements in pixel structure, leading to enhanced brightness, reduced power consumption, and improved color accuracy. The introduction of Quantum Dot OLED (QD-OLED) technology further enhances color performance and brightness. These technological advancements have broadened OLED’s applications across various sectors, including healthcare (medical displays), lighting products, and home appliances. The market fit for new innovations is largely determined by their cost-effectiveness and ability to meet specific end-user requirements, such as increased brightness, improved longevity, and flexibility.
Report Segmentation & Scope
This report offers a granular segmentation of the OLED panel market. Each segment includes growth projections, market sizes, and analysis of competitive dynamics.
- By Size: Small-sized, Medium-sized, Large-sized OLED Panels.
- By Product: Mobile and Tablet, Television, Automotive, Wearable, Other Products (Lighting Products, Healthcare, and Home Appliances).
- By Type: Flexible, Rigid, Transparent OLED Panels.
- By Display Address Scheme: PMOLED Display, AMOLED Display.
Key Drivers of OLED Panel Market Growth
Several factors propel the growth of the OLED panel market. Technological advancements, such as the development of flexible and foldable displays, enhance product appeal and expand application possibilities. Strong consumer demand for premium quality displays, driven by rising disposable incomes in developing economies, further accelerates market expansion. Favorable government policies supporting the development of advanced display technologies in certain regions also contribute to market growth.
Challenges in the OLED Panel Market Sector
The OLED panel market faces challenges like high manufacturing costs, which can impact affordability. Supply chain disruptions can affect production and delivery timelines. Intense competition from existing and emerging display technologies, such as LCD and MicroLED, poses a significant challenge. Strict environmental regulations influence production processes and material selection, impacting manufacturing costs and timelines.
Leading Players in the OLED Panel Market Market
- Visionox Co Ltd
- LG Display Co Ltd
- OSRAM OLED GmbH
- Ritek Corporation
- Samsung Display Co Ltd
- Raystar Optronics Inc
- Winstar Display Co Ltd
- Pioneer Corporation
- WiseChip Semiconductor Inc
- Sony Corporation
Key Developments in OLED Panel Market Sector
- January 2023: LG Display unveiled its third-generation OLED TV panel with META Technology, offering 60% brighter images and 30% wider viewing angles.
- January 2023: Samsung Display announced the production of a 77-inch Quantum Dot OLED panel.
- June 2022: LG Electronics launched the CineBeam Projector and UltraFine Display OLED in India.
Strategic OLED Panel Market Market Outlook
The OLED panel market is poised for sustained growth, driven by continuous technological innovations and expanding applications. Strategic opportunities lie in developing cost-effective manufacturing processes, exploring new applications in emerging sectors, and strengthening collaborations across the value chain. The market's future potential is significant, with continued penetration into high-growth segments like automotive displays and foldable smartphones.
OLED Panel Market Segmentation
-
1. Type
- 1.1. Flexible
- 1.2. Rigid
- 1.3. Transparent
-
2. Display Address Scheme
- 2.1. PMOLED Display
- 2.2. AMOLED Display
-
3. Size
- 3.1. Small-sized OLED Panel
- 3.2. Medium-sized OLED Panel
- 3.3. Large-sized OLED Panel
-
4. Product
- 4.1. Mobile and Tablet
- 4.2. Television
- 4.3. Automotive
- 4.4. Wearable
- 4.5. Other Pr
OLED Panel Market Segmentation By Geography
-
1. North America
- 1.1. United States
- 1.2. Canada
-
2. Europe
- 2.1. United Kingdom
- 2.2. Germany
- 2.3. Italy
- 2.4. France
-
3. Asia
- 3.1. China
- 3.2. India
- 3.3. Japan
- 3.4. South Korea
- 4. Australia and New Zealand
-
5. Latin America
- 5.1. Brazil
- 5.2. Mexico
- 6. Middle East and Africa
OLED Panel Market REPORT HIGHLIGHTS
| Aspects | Details |
|---|---|
| Study Period | 2019-2033 |
| Base Year | 2024 |
| Estimated Year | 2025 |
| Forecast Period | 2025-2033 |
| Historical Period | 2019-2024 |
| Growth Rate | CAGR of 13.19% from 2019-2033 |
| Segmentation |
|
Table of Contents
- 1. Introduction
- 1.1. Research Scope
- 1.2. Market Segmentation
- 1.3. Research Methodology
- 1.4. Definitions and Assumptions
- 2. Executive Summary
- 2.1. Introduction
- 3. Market Dynamics
- 3.1. Introduction
- 3.2. Market Drivers
- 3.2.1. Increasing Adoption of OLEDs in Smartphones; Government Support for the Development of OLED Technology in Various Countries
- 3.3. Market Restrains
- 3.3.1. ; High Cost of Implementation and Maintenance
- 3.4. Market Trends
- 3.4.1. AMOLED Display in Smartphone is Expected to Witness High Growth
- 4. Market Factor Analysis
- 4.1. Porters Five Forces
- 4.2. Supply/Value Chain
- 4.3. PESTEL analysis
- 4.4. Market Entropy
- 4.5. Patent/Trademark Analysis
- 5. Global OLED Panel Market Analysis, Insights and Forecast, 2019-2031
- 5.1. Market Analysis, Insights and Forecast - by Type
- 5.1.1. Flexible
- 5.1.2. Rigid
- 5.1.3. Transparent
- 5.2. Market Analysis, Insights and Forecast - by Display Address Scheme
- 5.2.1. PMOLED Display
- 5.2.2. AMOLED Display
- 5.3. Market Analysis, Insights and Forecast - by Size
- 5.3.1. Small-sized OLED Panel
- 5.3.2. Medium-sized OLED Panel
- 5.3.3. Large-sized OLED Panel
- 5.4. Market Analysis, Insights and Forecast - by Product
- 5.4.1. Mobile and Tablet
- 5.4.2. Television
- 5.4.3. Automotive
- 5.4.4. Wearable
- 5.4.5. Other Pr
- 5.5. Market Analysis, Insights and Forecast - by Region
- 5.5.1. North America
- 5.5.2. Europe
- 5.5.3. Asia
- 5.5.4. Australia and New Zealand
- 5.5.5. Latin America
- 5.5.6. Middle East and Africa
- 5.1. Market Analysis, Insights and Forecast - by Type
- 6. North America OLED Panel Market Analysis, Insights and Forecast, 2019-2031
- 6.1. Market Analysis, Insights and Forecast - by Type
- 6.1.1. Flexible
- 6.1.2. Rigid
- 6.1.3. Transparent
- 6.2. Market Analysis, Insights and Forecast - by Display Address Scheme
- 6.2.1. PMOLED Display
- 6.2.2. AMOLED Display
- 6.3. Market Analysis, Insights and Forecast - by Size
- 6.3.1. Small-sized OLED Panel
- 6.3.2. Medium-sized OLED Panel
- 6.3.3. Large-sized OLED Panel
- 6.4. Market Analysis, Insights and Forecast - by Product
- 6.4.1. Mobile and Tablet
- 6.4.2. Television
- 6.4.3. Automotive
- 6.4.4. Wearable
- 6.4.5. Other Pr
- 6.1. Market Analysis, Insights and Forecast - by Type
- 7. Europe OLED Panel Market Analysis, Insights and Forecast, 2019-2031
- 7.1. Market Analysis, Insights and Forecast - by Type
- 7.1.1. Flexible
- 7.1.2. Rigid
- 7.1.3. Transparent
- 7.2. Market Analysis, Insights and Forecast - by Display Address Scheme
- 7.2.1. PMOLED Display
- 7.2.2. AMOLED Display
- 7.3. Market Analysis, Insights and Forecast - by Size
- 7.3.1. Small-sized OLED Panel
- 7.3.2. Medium-sized OLED Panel
- 7.3.3. Large-sized OLED Panel
- 7.4. Market Analysis, Insights and Forecast - by Product
- 7.4.1. Mobile and Tablet
- 7.4.2. Television
- 7.4.3. Automotive
- 7.4.4. Wearable
- 7.4.5. Other Pr
- 7.1. Market Analysis, Insights and Forecast - by Type
- 8. Asia OLED Panel Market Analysis, Insights and Forecast, 2019-2031
- 8.1. Market Analysis, Insights and Forecast - by Type
- 8.1.1. Flexible
- 8.1.2. Rigid
- 8.1.3. Transparent
- 8.2. Market Analysis, Insights and Forecast - by Display Address Scheme
- 8.2.1. PMOLED Display
- 8.2.2. AMOLED Display
- 8.3. Market Analysis, Insights and Forecast - by Size
- 8.3.1. Small-sized OLED Panel
- 8.3.2. Medium-sized OLED Panel
- 8.3.3. Large-sized OLED Panel
- 8.4. Market Analysis, Insights and Forecast - by Product
- 8.4.1. Mobile and Tablet
- 8.4.2. Television
- 8.4.3. Automotive
- 8.4.4. Wearable
- 8.4.5. Other Pr
- 8.1. Market Analysis, Insights and Forecast - by Type
- 9. Australia and New Zealand OLED Panel Market Analysis, Insights and Forecast, 2019-2031
- 9.1. Market Analysis, Insights and Forecast - by Type
- 9.1.1. Flexible
- 9.1.2. Rigid
- 9.1.3. Transparent
- 9.2. Market Analysis, Insights and Forecast - by Display Address Scheme
- 9.2.1. PMOLED Display
- 9.2.2. AMOLED Display
- 9.3. Market Analysis, Insights and Forecast - by Size
- 9.3.1. Small-sized OLED Panel
- 9.3.2. Medium-sized OLED Panel
- 9.3.3. Large-sized OLED Panel
- 9.4. Market Analysis, Insights and Forecast - by Product
- 9.4.1. Mobile and Tablet
- 9.4.2. Television
- 9.4.3. Automotive
- 9.4.4. Wearable
- 9.4.5. Other Pr
- 9.1. Market Analysis, Insights and Forecast - by Type
- 10. Latin America OLED Panel Market Analysis, Insights and Forecast, 2019-2031
- 10.1. Market Analysis, Insights and Forecast - by Type
- 10.1.1. Flexible
- 10.1.2. Rigid
- 10.1.3. Transparent
- 10.2. Market Analysis, Insights and Forecast - by Display Address Scheme
- 10.2.1. PMOLED Display
- 10.2.2. AMOLED Display
- 10.3. Market Analysis, Insights and Forecast - by Size
- 10.3.1. Small-sized OLED Panel
- 10.3.2. Medium-sized OLED Panel
- 10.3.3. Large-sized OLED Panel
- 10.4. Market Analysis, Insights and Forecast - by Product
- 10.4.1. Mobile and Tablet
- 10.4.2. Television
- 10.4.3. Automotive
- 10.4.4. Wearable
- 10.4.5. Other Pr
- 10.1. Market Analysis, Insights and Forecast - by Type
- 11. Middle East and Africa OLED Panel Market Analysis, Insights and Forecast, 2019-2031
- 11.1. Market Analysis, Insights and Forecast - by Type
- 11.1.1. Flexible
- 11.1.2. Rigid
- 11.1.3. Transparent
- 11.2. Market Analysis, Insights and Forecast - by Display Address Scheme
- 11.2.1. PMOLED Display
- 11.2.2. AMOLED Display
- 11.3. Market Analysis, Insights and Forecast - by Size
- 11.3.1. Small-sized OLED Panel
- 11.3.2. Medium-sized OLED Panel
- 11.3.3. Large-sized OLED Panel
- 11.4. Market Analysis, Insights and Forecast - by Product
- 11.4.1. Mobile and Tablet
- 11.4.2. Television
- 11.4.3. Automotive
- 11.4.4. Wearable
- 11.4.5. Other Pr
- 11.1. Market Analysis, Insights and Forecast - by Type
- 12. North America OLED Panel Market Analysis, Insights and Forecast, 2019-2031
- 12.1. Market Analysis, Insights and Forecast - By Country/Sub-region
- 12.1.1 United States
- 12.1.2 Canada
- 13. Europe OLED Panel Market Analysis, Insights and Forecast, 2019-2031
- 13.1. Market Analysis, Insights and Forecast - By Country/Sub-region
- 13.1.1 United Kingdom
- 13.1.2 Germany
- 13.1.3 Italy
- 13.1.4 France
- 13.1.5 Rest of Europe
- 14. Asia Pacific OLED Panel Market Analysis, Insights and Forecast, 2019-2031
- 14.1. Market Analysis, Insights and Forecast - By Country/Sub-region
- 14.1.1 China
- 14.1.2 India
- 14.1.3 Japan
- 14.1.4 South Korea
- 14.1.5 Australia and New Zealand
- 14.1.6 Rest of Asia Pacific
- 15. Latin America OLED Panel Market Analysis, Insights and Forecast, 2019-2031
- 15.1. Market Analysis, Insights and Forecast - By Country/Sub-region
- 15.1.1 Brazil
- 15.1.2 Mexico
- 15.1.3 Rest of Latin America
- 16. Middle East and Africa OLED Panel Market Analysis, Insights and Forecast, 2019-2031
- 16.1. Market Analysis, Insights and Forecast - By Country/Sub-region
- 16.1.1.
- 17. Competitive Analysis
- 17.1. Global Market Share Analysis 2024
- 17.2. Company Profiles
- 17.2.1 Visionox Co Ltd*List Not Exhaustive
- 17.2.1.1. Overview
- 17.2.1.2. Products
- 17.2.1.3. SWOT Analysis
- 17.2.1.4. Recent Developments
- 17.2.1.5. Financials (Based on Availability)
- 17.2.2 LG Display Co Ltd
- 17.2.2.1. Overview
- 17.2.2.2. Products
- 17.2.2.3. SWOT Analysis
- 17.2.2.4. Recent Developments
- 17.2.2.5. Financials (Based on Availability)
- 17.2.3 OSRAM OLED GmbH
- 17.2.3.1. Overview
- 17.2.3.2. Products
- 17.2.3.3. SWOT Analysis
- 17.2.3.4. Recent Developments
- 17.2.3.5. Financials (Based on Availability)
- 17.2.4 Ritek Corporation
- 17.2.4.1. Overview
- 17.2.4.2. Products
- 17.2.4.3. SWOT Analysis
- 17.2.4.4. Recent Developments
- 17.2.4.5. Financials (Based on Availability)
- 17.2.5 Samsung Display Co Ltd
- 17.2.5.1. Overview
- 17.2.5.2. Products
- 17.2.5.3. SWOT Analysis
- 17.2.5.4. Recent Developments
- 17.2.5.5. Financials (Based on Availability)
- 17.2.6 Raystar Optronics Inc
- 17.2.6.1. Overview
- 17.2.6.2. Products
- 17.2.6.3. SWOT Analysis
- 17.2.6.4. Recent Developments
- 17.2.6.5. Financials (Based on Availability)
- 17.2.7 Winstar Display Co Ltd
- 17.2.7.1. Overview
- 17.2.7.2. Products
- 17.2.7.3. SWOT Analysis
- 17.2.7.4. Recent Developments
- 17.2.7.5. Financials (Based on Availability)
- 17.2.8 Pioneer Corporation
- 17.2.8.1. Overview
- 17.2.8.2. Products
- 17.2.8.3. SWOT Analysis
- 17.2.8.4. Recent Developments
- 17.2.8.5. Financials (Based on Availability)
- 17.2.9 WiseChip Semiconductor Inc
- 17.2.9.1. Overview
- 17.2.9.2. Products
- 17.2.9.3. SWOT Analysis
- 17.2.9.4. Recent Developments
- 17.2.9.5. Financials (Based on Availability)
- 17.2.10 Sony Corporation
- 17.2.10.1. Overview
- 17.2.10.2. Products
- 17.2.10.3. SWOT Analysis
- 17.2.10.4. Recent Developments
- 17.2.10.5. Financials (Based on Availability)
- 17.2.1 Visionox Co Ltd*List Not Exhaustive
List of Figures
- Figure 1: Global OLED Panel Market Revenue Breakdown (Million, %) by Region 2024 & 2032
- Figure 2: North America OLED Panel Market Revenue (Million), by Country 2024 & 2032
- Figure 3: North America OLED Panel Market Revenue Share (%), by Country 2024 & 2032
- Figure 4: Europe OLED Panel Market Revenue (Million), by Country 2024 & 2032
- Figure 5: Europe OLED Panel Market Revenue Share (%), by Country 2024 & 2032
- Figure 6: Asia Pacific OLED Panel Market Revenue (Million), by Country 2024 & 2032
- Figure 7: Asia Pacific OLED Panel Market Revenue Share (%), by Country 2024 & 2032
- Figure 8: Latin America OLED Panel Market Revenue (Million), by Country 2024 & 2032
- Figure 9: Latin America OLED Panel Market Revenue Share (%), by Country 2024 & 2032
- Figure 10: Middle East and Africa OLED Panel Market Revenue (Million), by Country 2024 & 2032
- Figure 11: Middle East and Africa OLED Panel Market Revenue Share (%), by Country 2024 & 2032
- Figure 12: North America OLED Panel Market Revenue (Million), by Type 2024 & 2032
- Figure 13: North America OLED Panel Market Revenue Share (%), by Type 2024 & 2032
- Figure 14: North America OLED Panel Market Revenue (Million), by Display Address Scheme 2024 & 2032
- Figure 15: North America OLED Panel Market Revenue Share (%), by Display Address Scheme 2024 & 2032
- Figure 16: North America OLED Panel Market Revenue (Million), by Size 2024 & 2032
- Figure 17: North America OLED Panel Market Revenue Share (%), by Size 2024 & 2032
- Figure 18: North America OLED Panel Market Revenue (Million), by Product 2024 & 2032
- Figure 19: North America OLED Panel Market Revenue Share (%), by Product 2024 & 2032
- Figure 20: North America OLED Panel Market Revenue (Million), by Country 2024 & 2032
- Figure 21: North America OLED Panel Market Revenue Share (%), by Country 2024 & 2032
- Figure 22: Europe OLED Panel Market Revenue (Million), by Type 2024 & 2032
- Figure 23: Europe OLED Panel Market Revenue Share (%), by Type 2024 & 2032
- Figure 24: Europe OLED Panel Market Revenue (Million), by Display Address Scheme 2024 & 2032
- Figure 25: Europe OLED Panel Market Revenue Share (%), by Display Address Scheme 2024 & 2032
- Figure 26: Europe OLED Panel Market Revenue (Million), by Size 2024 & 2032
- Figure 27: Europe OLED Panel Market Revenue Share (%), by Size 2024 & 2032
- Figure 28: Europe OLED Panel Market Revenue (Million), by Product 2024 & 2032
- Figure 29: Europe OLED Panel Market Revenue Share (%), by Product 2024 & 2032
- Figure 30: Europe OLED Panel Market Revenue (Million), by Country 2024 & 2032
- Figure 31: Europe OLED Panel Market Revenue Share (%), by Country 2024 & 2032
- Figure 32: Asia OLED Panel Market Revenue (Million), by Type 2024 & 2032
- Figure 33: Asia OLED Panel Market Revenue Share (%), by Type 2024 & 2032
- Figure 34: Asia OLED Panel Market Revenue (Million), by Display Address Scheme 2024 & 2032
- Figure 35: Asia OLED Panel Market Revenue Share (%), by Display Address Scheme 2024 & 2032
- Figure 36: Asia OLED Panel Market Revenue (Million), by Size 2024 & 2032
- Figure 37: Asia OLED Panel Market Revenue Share (%), by Size 2024 & 2032
- Figure 38: Asia OLED Panel Market Revenue (Million), by Product 2024 & 2032
- Figure 39: Asia OLED Panel Market Revenue Share (%), by Product 2024 & 2032
- Figure 40: Asia OLED Panel Market Revenue (Million), by Country 2024 & 2032
- Figure 41: Asia OLED Panel Market Revenue Share (%), by Country 2024 & 2032
- Figure 42: Australia and New Zealand OLED Panel Market Revenue (Million), by Type 2024 & 2032
- Figure 43: Australia and New Zealand OLED Panel Market Revenue Share (%), by Type 2024 & 2032
- Figure 44: Australia and New Zealand OLED Panel Market Revenue (Million), by Display Address Scheme 2024 & 2032
- Figure 45: Australia and New Zealand OLED Panel Market Revenue Share (%), by Display Address Scheme 2024 & 2032
- Figure 46: Australia and New Zealand OLED Panel Market Revenue (Million), by Size 2024 & 2032
- Figure 47: Australia and New Zealand OLED Panel Market Revenue Share (%), by Size 2024 & 2032
- Figure 48: Australia and New Zealand OLED Panel Market Revenue (Million), by Product 2024 & 2032
- Figure 49: Australia and New Zealand OLED Panel Market Revenue Share (%), by Product 2024 & 2032
- Figure 50: Australia and New Zealand OLED Panel Market Revenue (Million), by Country 2024 & 2032
- Figure 51: Australia and New Zealand OLED Panel Market Revenue Share (%), by Country 2024 & 2032
- Figure 52: Latin America OLED Panel Market Revenue (Million), by Type 2024 & 2032
- Figure 53: Latin America OLED Panel Market Revenue Share (%), by Type 2024 & 2032
- Figure 54: Latin America OLED Panel Market Revenue (Million), by Display Address Scheme 2024 & 2032
- Figure 55: Latin America OLED Panel Market Revenue Share (%), by Display Address Scheme 2024 & 2032
- Figure 56: Latin America OLED Panel Market Revenue (Million), by Size 2024 & 2032
- Figure 57: Latin America OLED Panel Market Revenue Share (%), by Size 2024 & 2032
- Figure 58: Latin America OLED Panel Market Revenue (Million), by Product 2024 & 2032
- Figure 59: Latin America OLED Panel Market Revenue Share (%), by Product 2024 & 2032
- Figure 60: Latin America OLED Panel Market Revenue (Million), by Country 2024 & 2032
- Figure 61: Latin America OLED Panel Market Revenue Share (%), by Country 2024 & 2032
- Figure 62: Middle East and Africa OLED Panel Market Revenue (Million), by Type 2024 & 2032
- Figure 63: Middle East and Africa OLED Panel Market Revenue Share (%), by Type 2024 & 2032
- Figure 64: Middle East and Africa OLED Panel Market Revenue (Million), by Display Address Scheme 2024 & 2032
- Figure 65: Middle East and Africa OLED Panel Market Revenue Share (%), by Display Address Scheme 2024 & 2032
- Figure 66: Middle East and Africa OLED Panel Market Revenue (Million), by Size 2024 & 2032
- Figure 67: Middle East and Africa OLED Panel Market Revenue Share (%), by Size 2024 & 2032
- Figure 68: Middle East and Africa OLED Panel Market Revenue (Million), by Product 2024 & 2032
- Figure 69: Middle East and Africa OLED Panel Market Revenue Share (%), by Product 2024 & 2032
- Figure 70: Middle East and Africa OLED Panel Market Revenue (Million), by Country 2024 & 2032
- Figure 71: Middle East and Africa OLED Panel Market Revenue Share (%), by Country 2024 & 2032
List of Tables
- Table 1: Global OLED Panel Market Revenue Million Forecast, by Region 2019 & 2032
- Table 2: Global OLED Panel Market Revenue Million Forecast, by Type 2019 & 2032
- Table 3: Global OLED Panel Market Revenue Million Forecast, by Display Address Scheme 2019 & 2032
- Table 4: Global OLED Panel Market Revenue Million Forecast, by Size 2019 & 2032
- Table 5: Global OLED Panel Market Revenue Million Forecast, by Product 2019 & 2032
- Table 6: Global OLED Panel Market Revenue Million Forecast, by Region 2019 & 2032
- Table 7: Global OLED Panel Market Revenue Million Forecast, by Country 2019 & 2032
- Table 8: United States OLED Panel Market Revenue (Million) Forecast, by Application 2019 & 2032
- Table 9: Canada OLED Panel Market Revenue (Million) Forecast, by Application 2019 & 2032
- Table 10: Global OLED Panel Market Revenue Million Forecast, by Country 2019 & 2032
- Table 11: United Kingdom OLED Panel Market Revenue (Million) Forecast, by Application 2019 & 2032
- Table 12: Germany OLED Panel Market Revenue (Million) Forecast, by Application 2019 & 2032
- Table 13: Italy OLED Panel Market Revenue (Million) Forecast, by Application 2019 & 2032
- Table 14: France OLED Panel Market Revenue (Million) Forecast, by Application 2019 & 2032
- Table 15: Rest of Europe OLED Panel Market Revenue (Million) Forecast, by Application 2019 & 2032
- Table 16: Global OLED Panel Market Revenue Million Forecast, by Country 2019 & 2032
- Table 17: China OLED Panel Market Revenue (Million) Forecast, by Application 2019 & 2032
- Table 18: India OLED Panel Market Revenue (Million) Forecast, by Application 2019 & 2032
- Table 19: Japan OLED Panel Market Revenue (Million) Forecast, by Application 2019 & 2032
- Table 20: South Korea OLED Panel Market Revenue (Million) Forecast, by Application 2019 & 2032
- Table 21: Australia and New Zealand OLED Panel Market Revenue (Million) Forecast, by Application 2019 & 2032
- Table 22: Rest of Asia Pacific OLED Panel Market Revenue (Million) Forecast, by Application 2019 & 2032
- Table 23: Global OLED Panel Market Revenue Million Forecast, by Country 2019 & 2032
- Table 24: Brazil OLED Panel Market Revenue (Million) Forecast, by Application 2019 & 2032
- Table 25: Mexico OLED Panel Market Revenue (Million) Forecast, by Application 2019 & 2032
- Table 26: Rest of Latin America OLED Panel Market Revenue (Million) Forecast, by Application 2019 & 2032
- Table 27: Global OLED Panel Market Revenue Million Forecast, by Country 2019 & 2032
- Table 28: OLED Panel Market Revenue (Million) Forecast, by Application 2019 & 2032
- Table 29: Global OLED Panel Market Revenue Million Forecast, by Type 2019 & 2032
- Table 30: Global OLED Panel Market Revenue Million Forecast, by Display Address Scheme 2019 & 2032
- Table 31: Global OLED Panel Market Revenue Million Forecast, by Size 2019 & 2032
- Table 32: Global OLED Panel Market Revenue Million Forecast, by Product 2019 & 2032
- Table 33: Global OLED Panel Market Revenue Million Forecast, by Country 2019 & 2032
- Table 34: United States OLED Panel Market Revenue (Million) Forecast, by Application 2019 & 2032
- Table 35: Canada OLED Panel Market Revenue (Million) Forecast, by Application 2019 & 2032
- Table 36: Global OLED Panel Market Revenue Million Forecast, by Type 2019 & 2032
- Table 37: Global OLED Panel Market Revenue Million Forecast, by Display Address Scheme 2019 & 2032
- Table 38: Global OLED Panel Market Revenue Million Forecast, by Size 2019 & 2032
- Table 39: Global OLED Panel Market Revenue Million Forecast, by Product 2019 & 2032
- Table 40: Global OLED Panel Market Revenue Million Forecast, by Country 2019 & 2032
- Table 41: United Kingdom OLED Panel Market Revenue (Million) Forecast, by Application 2019 & 2032
- Table 42: Germany OLED Panel Market Revenue (Million) Forecast, by Application 2019 & 2032
- Table 43: Italy OLED Panel Market Revenue (Million) Forecast, by Application 2019 & 2032
- Table 44: France OLED Panel Market Revenue (Million) Forecast, by Application 2019 & 2032
- Table 45: Global OLED Panel Market Revenue Million Forecast, by Type 2019 & 2032
- Table 46: Global OLED Panel Market Revenue Million Forecast, by Display Address Scheme 2019 & 2032
- Table 47: Global OLED Panel Market Revenue Million Forecast, by Size 2019 & 2032
- Table 48: Global OLED Panel Market Revenue Million Forecast, by Product 2019 & 2032
- Table 49: Global OLED Panel Market Revenue Million Forecast, by Country 2019 & 2032
- Table 50: China OLED Panel Market Revenue (Million) Forecast, by Application 2019 & 2032
- Table 51: India OLED Panel Market Revenue (Million) Forecast, by Application 2019 & 2032
- Table 52: Japan OLED Panel Market Revenue (Million) Forecast, by Application 2019 & 2032
- Table 53: South Korea OLED Panel Market Revenue (Million) Forecast, by Application 2019 & 2032
- Table 54: Global OLED Panel Market Revenue Million Forecast, by Type 2019 & 2032
- Table 55: Global OLED Panel Market Revenue Million Forecast, by Display Address Scheme 2019 & 2032
- Table 56: Global OLED Panel Market Revenue Million Forecast, by Size 2019 & 2032
- Table 57: Global OLED Panel Market Revenue Million Forecast, by Product 2019 & 2032
- Table 58: Global OLED Panel Market Revenue Million Forecast, by Country 2019 & 2032
- Table 59: Global OLED Panel Market Revenue Million Forecast, by Type 2019 & 2032
- Table 60: Global OLED Panel Market Revenue Million Forecast, by Display Address Scheme 2019 & 2032
- Table 61: Global OLED Panel Market Revenue Million Forecast, by Size 2019 & 2032
- Table 62: Global OLED Panel Market Revenue Million Forecast, by Product 2019 & 2032
- Table 63: Global OLED Panel Market Revenue Million Forecast, by Country 2019 & 2032
- Table 64: Brazil OLED Panel Market Revenue (Million) Forecast, by Application 2019 & 2032
- Table 65: Mexico OLED Panel Market Revenue (Million) Forecast, by Application 2019 & 2032
- Table 66: Global OLED Panel Market Revenue Million Forecast, by Type 2019 & 2032
- Table 67: Global OLED Panel Market Revenue Million Forecast, by Display Address Scheme 2019 & 2032
- Table 68: Global OLED Panel Market Revenue Million Forecast, by Size 2019 & 2032
- Table 69: Global OLED Panel Market Revenue Million Forecast, by Product 2019 & 2032
- Table 70: Global OLED Panel Market Revenue Million Forecast, by Country 2019 & 2032
Frequently Asked Questions
1. What is the projected Compound Annual Growth Rate (CAGR) of the OLED Panel Market?
The projected CAGR is approximately 13.19%.
2. Which companies are prominent players in the OLED Panel Market?
Key companies in the market include Visionox Co Ltd*List Not Exhaustive, LG Display Co Ltd, OSRAM OLED GmbH, Ritek Corporation, Samsung Display Co Ltd, Raystar Optronics Inc, Winstar Display Co Ltd, Pioneer Corporation, WiseChip Semiconductor Inc, Sony Corporation.
3. What are the main segments of the OLED Panel Market?
The market segments include Type, Display Address Scheme, Size, Product.
4. Can you provide details about the market size?
The market size is estimated to be USD 51.63 Million as of 2022.
5. What are some drivers contributing to market growth?
Increasing Adoption of OLEDs in Smartphones; Government Support for the Development of OLED Technology in Various Countries.
6. What are the notable trends driving market growth?
AMOLED Display in Smartphone is Expected to Witness High Growth.
7. Are there any restraints impacting market growth?
; High Cost of Implementation and Maintenance.
8. Can you provide examples of recent developments in the market?
January 2023: At CES 2023, LG Display, a pioneer in display technology, unveiled the third-generation OLED TV panel. The latest OLED TV panel from the manufacturer, based on "META Technology," offers the best possible image quality. The company's most recent OLED displays utilize META Technology to produce pictures that are 60% brighter than those produced by standard OLED productions and with viewing angles that are 30% broader.
9. What pricing options are available for accessing the report?
Pricing options include single-user, multi-user, and enterprise licenses priced at USD 4750, USD 5250, and USD 8750 respectively.
10. Is the market size provided in terms of value or volume?
The market size is provided in terms of value, measured in Million.
11. Are there any specific market keywords associated with the report?
Yes, the market keyword associated with the report is "OLED Panel Market," which aids in identifying and referencing the specific market segment covered.
12. How do I determine which pricing option suits my needs best?
The pricing options vary based on user requirements and access needs. Individual users may opt for single-user licenses, while businesses requiring broader access may choose multi-user or enterprise licenses for cost-effective access to the report.
13. Are there any additional resources or data provided in the OLED Panel Market report?
While the report offers comprehensive insights, it's advisable to review the specific contents or supplementary materials provided to ascertain if additional resources or data are available.
14. How can I stay updated on further developments or reports in the OLED Panel Market?
To stay informed about further developments, trends, and reports in the OLED Panel Market, consider subscribing to industry newsletters, following relevant companies and organizations, or regularly checking reputable industry news sources and publications.
Methodology
Step 1 - Identification of Relevant Samples Size from Population Database


Step 2 - Approaches for Defining Global Market Size (Value, Volume* & Price*)

Note*: In applicable scenarios
Step 3 - Data Sources
Primary Research
- Web Analytics
- Survey Reports
- Research Institute
- Latest Research Reports
- Opinion Leaders
Secondary Research
- Annual Reports
- White Paper
- Latest Press Release
- Industry Association
- Paid Database
- Investor Presentations

Step 4 - Data Triangulation
Involves using different sources of information in order to increase the validity of a study
These sources are likely to be stakeholders in a program - participants, other researchers, program staff, other community members, and so on.
Then we put all data in single framework & apply various statistical tools to find out the dynamic on the market.
During the analysis stage, feedback from the stakeholder groups would be compared to determine areas of agreement as well as areas of divergence


