
Key Insights
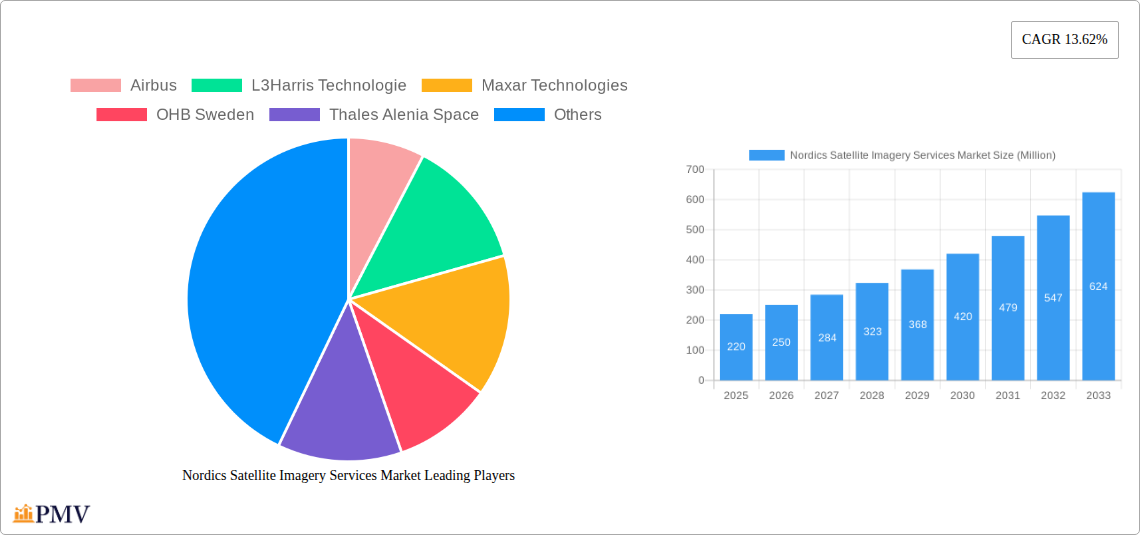
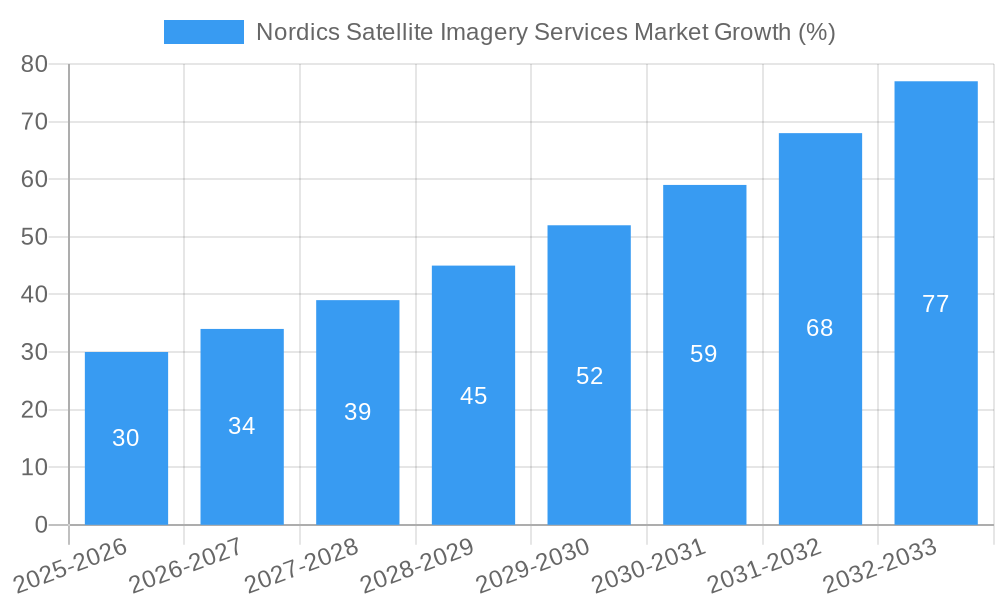
The Nordics satellite imagery services market, valued at $220 million in 2025, is projected to experience robust growth, exhibiting a compound annual growth rate (CAGR) of 13.62% from 2025 to 2033. This expansion is fueled by several key drivers. Increasing government investments in infrastructure development and resource management across Denmark, Sweden, Norway, and Finland are significantly boosting demand. The market is witnessing strong adoption across diverse sectors, including geospatial data acquisition and mapping for urban planning, precision agriculture leveraging satellite imagery for optimized farming practices in the region's extensive agricultural lands, and environmental monitoring for sustainable resource management and conservation efforts. Further fueling growth is the escalating need for enhanced surveillance and security solutions, particularly in maritime and border control, given the Nordic countries' extensive coastlines. The rise of advanced analytics capabilities applied to satellite data, facilitating more precise insights for decision-making across various sectors, also contributes positively to market expansion.
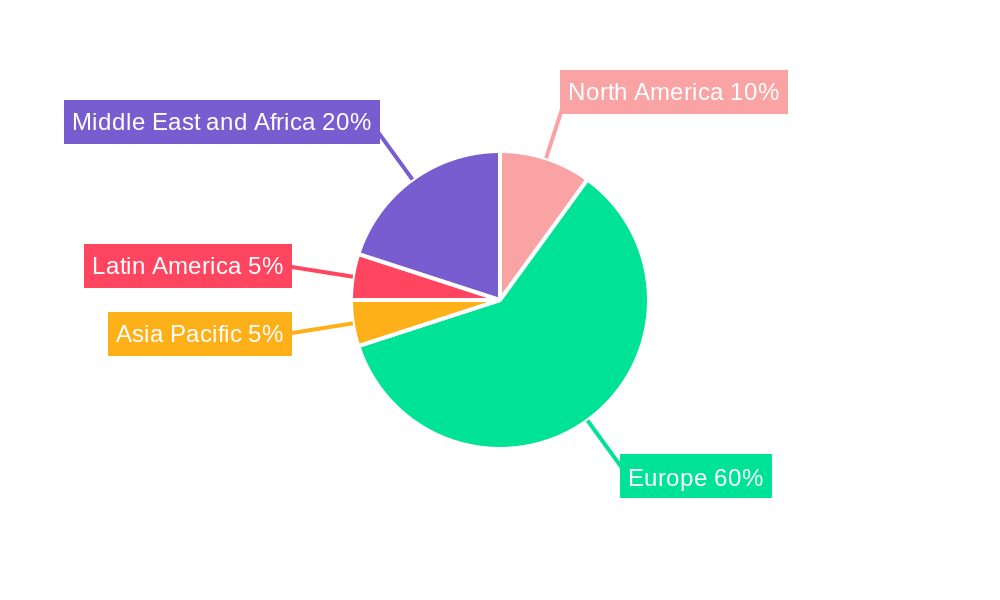
The market segmentation reveals a significant contribution from government end-users, driven by substantial public sector investment in national infrastructure projects and defense initiatives. The construction, transportation and logistics sectors are also crucial contributors, utilizing satellite imagery for project planning, monitoring, and asset management. While precise regional market shares within the Nordics are unavailable, it's reasonable to expect that Sweden and Norway, possessing advanced technological infrastructure and considerable government spending, will command larger shares. Growth will likely be tempered by factors such as data privacy concerns regarding the use of satellite imagery and the high initial investment costs associated with acquiring and processing satellite data. However, the overall market outlook remains positive, driven by continuous technological advancements and increasing demand for efficient and precise geospatial intelligence across diverse applications.
Nordics Satellite Imagery Services Market: A Comprehensive Report (2019-2033)
This in-depth report provides a comprehensive analysis of the Nordics satellite imagery services market, covering the period 2019-2033. It offers invaluable insights into market size, segmentation, growth drivers, challenges, competitive landscape, and future outlook, empowering stakeholders to make informed strategic decisions. The report utilizes data from the base year 2025, with estimations for 2025 and forecasts extending to 2033, encompassing the historical period of 2019-2024.
Nordics Satellite Imagery Services Market Structure & Competitive Dynamics
The Nordics satellite imagery services market exhibits a moderately concentrated structure, with key players like Airbus, L3Harris Technologies, Maxar Technologies, and OHB Sweden holding significant market share. However, the emergence of innovative startups like ICEYE and Planet Labs is intensifying competition and driving market dynamism. The market's innovation ecosystem is robust, fueled by government initiatives promoting space technology and substantial R&D investments. Regulatory frameworks, while generally supportive, vary across Nordic countries and impact market access and data usage. Product substitutes, such as aerial photography, exist but generally lack the scale, speed, and consistent coverage offered by satellite imagery. End-user trends show a growing demand for high-resolution, real-time data across various sectors. M&A activities have been relatively moderate in recent years, with deal values averaging xx Million USD per transaction. Future consolidation is anticipated as larger players seek to expand their service portfolios and geographical reach.
- Market Concentration: Moderately concentrated, with top players holding approximately xx% market share.
- Innovation Ecosystem: Strong, driven by government support and R&D investment.
- Regulatory Frameworks: Varied across Nordic countries, influencing market access.
- M&A Activity: Moderate, with an average deal value of xx Million USD.
- End-User Trends: Increasing demand for high-resolution, real-time data.
Nordics Satellite Imagery Services Market Industry Trends & Insights
The Nordics satellite imagery services market is experiencing robust growth, driven by increasing demand across diverse sectors. The market is projected to achieve a CAGR of xx% during the forecast period (2025-2033), propelled by several key factors. Technological advancements, particularly in sensor technology and data analytics, are enabling higher resolution imagery, faster processing times, and enhanced data insights. Consumer preferences are shifting towards cloud-based solutions and readily accessible data analytics tools. The competitive landscape is highly dynamic, with both established players and innovative startups vying for market share through strategic partnerships, product development, and service diversification. Market penetration is highest in the government sector due to significant adoption for surveillance, mapping, and environmental monitoring. However, increasing adoption in private sectors like construction and agriculture is expected to drive further growth.
Dominant Markets & Segments in Nordics Satellite Imagery Services Market
While all Nordic countries demonstrate significant demand for satellite imagery services, Sweden currently holds the largest market share driven by its strong technological sector and the presence of major players like OHB Sweden. The Geospatial Data Acquisition and Mapping segment holds the largest market share by application, fueled by the increasing need for precise maps and geographic information systems (GIS) data. Government and Military & Defense are the dominant end-user segments, with robust budgets and extensive reliance on satellite imagery for national security and infrastructure planning.
Key Drivers by Segment:
By Application:
- Geospatial Data Acquisition and Mapping: High demand for precise maps and GIS data, driven by urban planning and infrastructure development.
- Natural Resource Management: Increasing focus on sustainable resource management and environmental monitoring.
- Surveillance and Security: Government and military spending on security applications.
- Conservation and Research: Growing awareness of environmental issues and the need for accurate monitoring data.
- Disaster Management: Real-time monitoring and damage assessment capabilities.
- Intelligence: Demand for high-resolution imagery for intelligence gathering.
By End User:
- Government: Significant budgetary allocations for national security and infrastructure development.
- Military and Defense: Critical use of satellite imagery for surveillance and strategic decision-making.
- Construction: Growing reliance on satellite imagery for site planning, progress monitoring, and risk assessment.
- Transportation and Logistics: Optimizing route planning, monitoring infrastructure, and managing logistics.
- Forestry and Agriculture: Precision farming, forest monitoring, and yield estimation.
By Country:
- Sweden: Strong technological sector and presence of major players.
- Norway: Significant government investment in space technology and environmental monitoring.
- Finland: Active role in satellite technology development and increasing private sector adoption.
- Denmark: Steady growth driven by government initiatives and private sector demand.
Nordics Satellite Imagery Services Market Product Innovations
The market is witnessing significant technological advancements, focusing on higher resolution imagery, advanced analytics capabilities, and the integration of Artificial Intelligence (AI) and Machine Learning (ML) for automated data processing and analysis. New products emphasize real-time data delivery, cloud-based platforms, and customizable solutions tailored to specific end-user needs. The emphasis is on providing actionable insights rather than just raw imagery, improving market fit and competitive advantages.
Report Segmentation & Scope
This report segments the Nordics satellite imagery services market by application (Geospatial Data Acquisition and Mapping, Natural Resource Management, Surveillance and Security, Conservation and Research, Disaster Management, Intelligence), end-user (Government, Construction, Transportation and Logistics, Military and Defense, Forestry and Agriculture, Others), and country (Denmark, Sweden, Norway, Finland, Others). Each segment's growth projections, market size estimates, and competitive dynamics are thoroughly analyzed, providing a granular understanding of the market landscape. Growth rates vary across segments, with the Geospatial Data Acquisition and Mapping and Government segments demonstrating the strongest growth.
Key Drivers of Nordics Satellite Imagery Services Market Growth
Technological advancements, robust government support and investment in space technology, and increasing demand for high-resolution data across various sectors are key growth drivers. Specific examples include the development of next-generation satellites with improved sensors and the adoption of AI/ML for enhanced data analysis. Stringent environmental regulations and the need for precise monitoring of natural resources are also fueling market expansion.
Challenges in the Nordics Satellite Imagery Services Market Sector
Data security concerns and the need for robust data protection measures represent significant challenges. Competition from established players and the emergence of new entrants puts pressure on pricing and profit margins. Weather conditions impacting data acquisition and potential regulatory hurdles related to data access and usage create additional barriers. The overall impact of these factors is an estimated xx% reduction in market growth rate.
Leading Players in the Nordics Satellite Imagery Services Market Market
- Airbus
- L3Harris Technologies
- Maxar Technologies
- OHB Sweden
- Thales Alenia Space
- Mapillary
- Planet Labs
- KONGSBERG SATELLITE SERVICES (KSAT)
- Lantmäteriet
- ICEYE
Key Developments in Nordics Satellite Imagery Services Market Sector
- May 2023: Business Finland granted EUR 30 million (USD 32.75 million) in loan funding to ICEYE for product development, boosting the company’s capacity for real-time data provision. This development significantly enhances the market's technological capabilities.
- March 2023: Norway's International Climate and Forest Initiative (NICFI) extended its satellite data program until September 2023, expanding free access to high-resolution imagery for tropical deforestation monitoring. This initiative promotes sustainable practices and increases data availability.
Strategic Nordics Satellite Imagery Services Market Outlook
The Nordics satellite imagery services market presents significant growth potential, driven by continuous technological innovation, increasing demand across diverse sectors, and supportive government policies. Strategic opportunities exist for companies focused on developing innovative solutions, improving data accessibility, and leveraging AI/ML for advanced data analysis. The market's future growth will depend on the ability of players to adapt to evolving end-user needs and navigate the challenges posed by data security and regulatory frameworks. The integration of satellite imagery data with other data sources, such as IoT and sensor data, will play a vital role in creating new value propositions and driving market expansion.
Nordics Satellite Imagery Services Market Segmentation
-
1. Application
- 1.1. Geospatial Data Acquisition and Mapping
- 1.2. Natural Resource Management
- 1.3. Surveillance and Security
- 1.4. Conservation and Research
- 1.5. Disaster Management
- 1.6. Intelligence
-
2. End User
- 2.1. Government
- 2.2. Construction
- 2.3. Transportation and Logistics
- 2.4. Military and Defense
- 2.5. Forestry and Agriculture
- 2.6. Others
Nordics Satellite Imagery Services Market Segmentation By Geography
-
1. North America
- 1.1. United States
- 1.2. Canada
- 1.3. Mexico
-
2. South America
- 2.1. Brazil
- 2.2. Argentina
- 2.3. Rest of South America
-
3. Europe
- 3.1. United Kingdom
- 3.2. Germany
- 3.3. France
- 3.4. Italy
- 3.5. Spain
- 3.6. Russia
- 3.7. Benelux
- 3.8. Nordics
- 3.9. Rest of Europe
-
4. Middle East & Africa
- 4.1. Turkey
- 4.2. Israel
- 4.3. GCC
- 4.4. North Africa
- 4.5. South Africa
- 4.6. Rest of Middle East & Africa
-
5. Asia Pacific
- 5.1. China
- 5.2. India
- 5.3. Japan
- 5.4. South Korea
- 5.5. ASEAN
- 5.6. Oceania
- 5.7. Rest of Asia Pacific
Nordics Satellite Imagery Services Market REPORT HIGHLIGHTS
| Aspects | Details |
|---|---|
| Study Period | 2019-2033 |
| Base Year | 2024 |
| Estimated Year | 2025 |
| Forecast Period | 2025-2033 |
| Historical Period | 2019-2024 |
| Growth Rate | CAGR of 13.62% from 2019-2033 |
| Segmentation |
|
Table of Contents
- 1. Introduction
- 1.1. Research Scope
- 1.2. Market Segmentation
- 1.3. Research Methodology
- 1.4. Definitions and Assumptions
- 2. Executive Summary
- 2.1. Introduction
- 3. Market Dynamics
- 3.1. Introduction
- 3.2. Market Drivers
- 3.2.1 Increasing Demand among Various End-user Industries
- 3.2.2 notablly in Forestry Sector; Adoption of Big Data and Imagery Analytics
- 3.3. Market Restrains
- 3.3.1. High Cost of Satellite Imaging Data Acquisition and Processing
- 3.4. Market Trends
- 3.4.1. Forestry and Agriculture is Analyzed to Hold Significant Market Share
- 4. Market Factor Analysis
- 4.1. Porters Five Forces
- 4.2. Supply/Value Chain
- 4.3. PESTEL analysis
- 4.4. Market Entropy
- 4.5. Patent/Trademark Analysis
- 5. Global Nordics Satellite Imagery Services Market Analysis, Insights and Forecast, 2019-2031
- 5.1. Market Analysis, Insights and Forecast - by Application
- 5.1.1. Geospatial Data Acquisition and Mapping
- 5.1.2. Natural Resource Management
- 5.1.3. Surveillance and Security
- 5.1.4. Conservation and Research
- 5.1.5. Disaster Management
- 5.1.6. Intelligence
- 5.2. Market Analysis, Insights and Forecast - by End User
- 5.2.1. Government
- 5.2.2. Construction
- 5.2.3. Transportation and Logistics
- 5.2.4. Military and Defense
- 5.2.5. Forestry and Agriculture
- 5.2.6. Others
- 5.3. Market Analysis, Insights and Forecast - by Region
- 5.3.1. North America
- 5.3.2. South America
- 5.3.3. Europe
- 5.3.4. Middle East & Africa
- 5.3.5. Asia Pacific
- 5.1. Market Analysis, Insights and Forecast - by Application
- 6. North America Nordics Satellite Imagery Services Market Analysis, Insights and Forecast, 2019-2031
- 6.1. Market Analysis, Insights and Forecast - by Application
- 6.1.1. Geospatial Data Acquisition and Mapping
- 6.1.2. Natural Resource Management
- 6.1.3. Surveillance and Security
- 6.1.4. Conservation and Research
- 6.1.5. Disaster Management
- 6.1.6. Intelligence
- 6.2. Market Analysis, Insights and Forecast - by End User
- 6.2.1. Government
- 6.2.2. Construction
- 6.2.3. Transportation and Logistics
- 6.2.4. Military and Defense
- 6.2.5. Forestry and Agriculture
- 6.2.6. Others
- 6.1. Market Analysis, Insights and Forecast - by Application
- 7. South America Nordics Satellite Imagery Services Market Analysis, Insights and Forecast, 2019-2031
- 7.1. Market Analysis, Insights and Forecast - by Application
- 7.1.1. Geospatial Data Acquisition and Mapping
- 7.1.2. Natural Resource Management
- 7.1.3. Surveillance and Security
- 7.1.4. Conservation and Research
- 7.1.5. Disaster Management
- 7.1.6. Intelligence
- 7.2. Market Analysis, Insights and Forecast - by End User
- 7.2.1. Government
- 7.2.2. Construction
- 7.2.3. Transportation and Logistics
- 7.2.4. Military and Defense
- 7.2.5. Forestry and Agriculture
- 7.2.6. Others
- 7.1. Market Analysis, Insights and Forecast - by Application
- 8. Europe Nordics Satellite Imagery Services Market Analysis, Insights and Forecast, 2019-2031
- 8.1. Market Analysis, Insights and Forecast - by Application
- 8.1.1. Geospatial Data Acquisition and Mapping
- 8.1.2. Natural Resource Management
- 8.1.3. Surveillance and Security
- 8.1.4. Conservation and Research
- 8.1.5. Disaster Management
- 8.1.6. Intelligence
- 8.2. Market Analysis, Insights and Forecast - by End User
- 8.2.1. Government
- 8.2.2. Construction
- 8.2.3. Transportation and Logistics
- 8.2.4. Military and Defense
- 8.2.5. Forestry and Agriculture
- 8.2.6. Others
- 8.1. Market Analysis, Insights and Forecast - by Application
- 9. Middle East & Africa Nordics Satellite Imagery Services Market Analysis, Insights and Forecast, 2019-2031
- 9.1. Market Analysis, Insights and Forecast - by Application
- 9.1.1. Geospatial Data Acquisition and Mapping
- 9.1.2. Natural Resource Management
- 9.1.3. Surveillance and Security
- 9.1.4. Conservation and Research
- 9.1.5. Disaster Management
- 9.1.6. Intelligence
- 9.2. Market Analysis, Insights and Forecast - by End User
- 9.2.1. Government
- 9.2.2. Construction
- 9.2.3. Transportation and Logistics
- 9.2.4. Military and Defense
- 9.2.5. Forestry and Agriculture
- 9.2.6. Others
- 9.1. Market Analysis, Insights and Forecast - by Application
- 10. Asia Pacific Nordics Satellite Imagery Services Market Analysis, Insights and Forecast, 2019-2031
- 10.1. Market Analysis, Insights and Forecast - by Application
- 10.1.1. Geospatial Data Acquisition and Mapping
- 10.1.2. Natural Resource Management
- 10.1.3. Surveillance and Security
- 10.1.4. Conservation and Research
- 10.1.5. Disaster Management
- 10.1.6. Intelligence
- 10.2. Market Analysis, Insights and Forecast - by End User
- 10.2.1. Government
- 10.2.2. Construction
- 10.2.3. Transportation and Logistics
- 10.2.4. Military and Defense
- 10.2.5. Forestry and Agriculture
- 10.2.6. Others
- 10.1. Market Analysis, Insights and Forecast - by Application
- 11. North America Nordics Satellite Imagery Services Market Analysis, Insights and Forecast, 2019-2031
- 11.1. Market Analysis, Insights and Forecast - By Country/Sub-region
- 11.1.1.
- 12. Europe Nordics Satellite Imagery Services Market Analysis, Insights and Forecast, 2019-2031
- 12.1. Market Analysis, Insights and Forecast - By Country/Sub-region
- 12.1.1.
- 13. Asia Pacific Nordics Satellite Imagery Services Market Analysis, Insights and Forecast, 2019-2031
- 13.1. Market Analysis, Insights and Forecast - By Country/Sub-region
- 13.1.1.
- 14. Latin America Nordics Satellite Imagery Services Market Analysis, Insights and Forecast, 2019-2031
- 14.1. Market Analysis, Insights and Forecast - By Country/Sub-region
- 14.1.1.
- 15. Middle East and Africa Nordics Satellite Imagery Services Market Analysis, Insights and Forecast, 2019-2031
- 15.1. Market Analysis, Insights and Forecast - By Country/Sub-region
- 15.1.1.
- 16. Competitive Analysis
- 16.1. Global Market Share Analysis 2024
- 16.2. Company Profiles
- 16.2.1 Airbus
- 16.2.1.1. Overview
- 16.2.1.2. Products
- 16.2.1.3. SWOT Analysis
- 16.2.1.4. Recent Developments
- 16.2.1.5. Financials (Based on Availability)
- 16.2.2 L3Harris Technologie
- 16.2.2.1. Overview
- 16.2.2.2. Products
- 16.2.2.3. SWOT Analysis
- 16.2.2.4. Recent Developments
- 16.2.2.5. Financials (Based on Availability)
- 16.2.3 Maxar Technologies
- 16.2.3.1. Overview
- 16.2.3.2. Products
- 16.2.3.3. SWOT Analysis
- 16.2.3.4. Recent Developments
- 16.2.3.5. Financials (Based on Availability)
- 16.2.4 OHB Sweden
- 16.2.4.1. Overview
- 16.2.4.2. Products
- 16.2.4.3. SWOT Analysis
- 16.2.4.4. Recent Developments
- 16.2.4.5. Financials (Based on Availability)
- 16.2.5 Thales Alenia Space
- 16.2.5.1. Overview
- 16.2.5.2. Products
- 16.2.5.3. SWOT Analysis
- 16.2.5.4. Recent Developments
- 16.2.5.5. Financials (Based on Availability)
- 16.2.6 Mapillary
- 16.2.6.1. Overview
- 16.2.6.2. Products
- 16.2.6.3. SWOT Analysis
- 16.2.6.4. Recent Developments
- 16.2.6.5. Financials (Based on Availability)
- 16.2.7 Planet Labs
- 16.2.7.1. Overview
- 16.2.7.2. Products
- 16.2.7.3. SWOT Analysis
- 16.2.7.4. Recent Developments
- 16.2.7.5. Financials (Based on Availability)
- 16.2.8 KONGSBERG SATELLITE SERVICES (KSAT)
- 16.2.8.1. Overview
- 16.2.8.2. Products
- 16.2.8.3. SWOT Analysis
- 16.2.8.4. Recent Developments
- 16.2.8.5. Financials (Based on Availability)
- 16.2.9 Lantmäteriet
- 16.2.9.1. Overview
- 16.2.9.2. Products
- 16.2.9.3. SWOT Analysis
- 16.2.9.4. Recent Developments
- 16.2.9.5. Financials (Based on Availability)
- 16.2.10 ICEYE
- 16.2.10.1. Overview
- 16.2.10.2. Products
- 16.2.10.3. SWOT Analysis
- 16.2.10.4. Recent Developments
- 16.2.10.5. Financials (Based on Availability)
- 16.2.1 Airbus
List of Figures
- Figure 1: Global Nordics Satellite Imagery Services Market Revenue Breakdown (Million, %) by Region 2024 & 2032
- Figure 2: North America Nordics Satellite Imagery Services Market Revenue (Million), by Country 2024 & 2032
- Figure 3: North America Nordics Satellite Imagery Services Market Revenue Share (%), by Country 2024 & 2032
- Figure 4: Europe Nordics Satellite Imagery Services Market Revenue (Million), by Country 2024 & 2032
- Figure 5: Europe Nordics Satellite Imagery Services Market Revenue Share (%), by Country 2024 & 2032
- Figure 6: Asia Pacific Nordics Satellite Imagery Services Market Revenue (Million), by Country 2024 & 2032
- Figure 7: Asia Pacific Nordics Satellite Imagery Services Market Revenue Share (%), by Country 2024 & 2032
- Figure 8: Latin America Nordics Satellite Imagery Services Market Revenue (Million), by Country 2024 & 2032
- Figure 9: Latin America Nordics Satellite Imagery Services Market Revenue Share (%), by Country 2024 & 2032
- Figure 10: Middle East and Africa Nordics Satellite Imagery Services Market Revenue (Million), by Country 2024 & 2032
- Figure 11: Middle East and Africa Nordics Satellite Imagery Services Market Revenue Share (%), by Country 2024 & 2032
- Figure 12: North America Nordics Satellite Imagery Services Market Revenue (Million), by Application 2024 & 2032
- Figure 13: North America Nordics Satellite Imagery Services Market Revenue Share (%), by Application 2024 & 2032
- Figure 14: North America Nordics Satellite Imagery Services Market Revenue (Million), by End User 2024 & 2032
- Figure 15: North America Nordics Satellite Imagery Services Market Revenue Share (%), by End User 2024 & 2032
- Figure 16: North America Nordics Satellite Imagery Services Market Revenue (Million), by Country 2024 & 2032
- Figure 17: North America Nordics Satellite Imagery Services Market Revenue Share (%), by Country 2024 & 2032
- Figure 18: South America Nordics Satellite Imagery Services Market Revenue (Million), by Application 2024 & 2032
- Figure 19: South America Nordics Satellite Imagery Services Market Revenue Share (%), by Application 2024 & 2032
- Figure 20: South America Nordics Satellite Imagery Services Market Revenue (Million), by End User 2024 & 2032
- Figure 21: South America Nordics Satellite Imagery Services Market Revenue Share (%), by End User 2024 & 2032
- Figure 22: South America Nordics Satellite Imagery Services Market Revenue (Million), by Country 2024 & 2032
- Figure 23: South America Nordics Satellite Imagery Services Market Revenue Share (%), by Country 2024 & 2032
- Figure 24: Europe Nordics Satellite Imagery Services Market Revenue (Million), by Application 2024 & 2032
- Figure 25: Europe Nordics Satellite Imagery Services Market Revenue Share (%), by Application 2024 & 2032
- Figure 26: Europe Nordics Satellite Imagery Services Market Revenue (Million), by End User 2024 & 2032
- Figure 27: Europe Nordics Satellite Imagery Services Market Revenue Share (%), by End User 2024 & 2032
- Figure 28: Europe Nordics Satellite Imagery Services Market Revenue (Million), by Country 2024 & 2032
- Figure 29: Europe Nordics Satellite Imagery Services Market Revenue Share (%), by Country 2024 & 2032
- Figure 30: Middle East & Africa Nordics Satellite Imagery Services Market Revenue (Million), by Application 2024 & 2032
- Figure 31: Middle East & Africa Nordics Satellite Imagery Services Market Revenue Share (%), by Application 2024 & 2032
- Figure 32: Middle East & Africa Nordics Satellite Imagery Services Market Revenue (Million), by End User 2024 & 2032
- Figure 33: Middle East & Africa Nordics Satellite Imagery Services Market Revenue Share (%), by End User 2024 & 2032
- Figure 34: Middle East & Africa Nordics Satellite Imagery Services Market Revenue (Million), by Country 2024 & 2032
- Figure 35: Middle East & Africa Nordics Satellite Imagery Services Market Revenue Share (%), by Country 2024 & 2032
- Figure 36: Asia Pacific Nordics Satellite Imagery Services Market Revenue (Million), by Application 2024 & 2032
- Figure 37: Asia Pacific Nordics Satellite Imagery Services Market Revenue Share (%), by Application 2024 & 2032
- Figure 38: Asia Pacific Nordics Satellite Imagery Services Market Revenue (Million), by End User 2024 & 2032
- Figure 39: Asia Pacific Nordics Satellite Imagery Services Market Revenue Share (%), by End User 2024 & 2032
- Figure 40: Asia Pacific Nordics Satellite Imagery Services Market Revenue (Million), by Country 2024 & 2032
- Figure 41: Asia Pacific Nordics Satellite Imagery Services Market Revenue Share (%), by Country 2024 & 2032
List of Tables
- Table 1: Global Nordics Satellite Imagery Services Market Revenue Million Forecast, by Region 2019 & 2032
- Table 2: Global Nordics Satellite Imagery Services Market Revenue Million Forecast, by Application 2019 & 2032
- Table 3: Global Nordics Satellite Imagery Services Market Revenue Million Forecast, by End User 2019 & 2032
- Table 4: Global Nordics Satellite Imagery Services Market Revenue Million Forecast, by Region 2019 & 2032
- Table 5: Global Nordics Satellite Imagery Services Market Revenue Million Forecast, by Country 2019 & 2032
- Table 6: Nordics Satellite Imagery Services Market Revenue (Million) Forecast, by Application 2019 & 2032
- Table 7: Global Nordics Satellite Imagery Services Market Revenue Million Forecast, by Country 2019 & 2032
- Table 8: Nordics Satellite Imagery Services Market Revenue (Million) Forecast, by Application 2019 & 2032
- Table 9: Global Nordics Satellite Imagery Services Market Revenue Million Forecast, by Country 2019 & 2032
- Table 10: Nordics Satellite Imagery Services Market Revenue (Million) Forecast, by Application 2019 & 2032
- Table 11: Global Nordics Satellite Imagery Services Market Revenue Million Forecast, by Country 2019 & 2032
- Table 12: Nordics Satellite Imagery Services Market Revenue (Million) Forecast, by Application 2019 & 2032
- Table 13: Global Nordics Satellite Imagery Services Market Revenue Million Forecast, by Country 2019 & 2032
- Table 14: Nordics Satellite Imagery Services Market Revenue (Million) Forecast, by Application 2019 & 2032
- Table 15: Global Nordics Satellite Imagery Services Market Revenue Million Forecast, by Application 2019 & 2032
- Table 16: Global Nordics Satellite Imagery Services Market Revenue Million Forecast, by End User 2019 & 2032
- Table 17: Global Nordics Satellite Imagery Services Market Revenue Million Forecast, by Country 2019 & 2032
- Table 18: United States Nordics Satellite Imagery Services Market Revenue (Million) Forecast, by Application 2019 & 2032
- Table 19: Canada Nordics Satellite Imagery Services Market Revenue (Million) Forecast, by Application 2019 & 2032
- Table 20: Mexico Nordics Satellite Imagery Services Market Revenue (Million) Forecast, by Application 2019 & 2032
- Table 21: Global Nordics Satellite Imagery Services Market Revenue Million Forecast, by Application 2019 & 2032
- Table 22: Global Nordics Satellite Imagery Services Market Revenue Million Forecast, by End User 2019 & 2032
- Table 23: Global Nordics Satellite Imagery Services Market Revenue Million Forecast, by Country 2019 & 2032
- Table 24: Brazil Nordics Satellite Imagery Services Market Revenue (Million) Forecast, by Application 2019 & 2032
- Table 25: Argentina Nordics Satellite Imagery Services Market Revenue (Million) Forecast, by Application 2019 & 2032
- Table 26: Rest of South America Nordics Satellite Imagery Services Market Revenue (Million) Forecast, by Application 2019 & 2032
- Table 27: Global Nordics Satellite Imagery Services Market Revenue Million Forecast, by Application 2019 & 2032
- Table 28: Global Nordics Satellite Imagery Services Market Revenue Million Forecast, by End User 2019 & 2032
- Table 29: Global Nordics Satellite Imagery Services Market Revenue Million Forecast, by Country 2019 & 2032
- Table 30: United Kingdom Nordics Satellite Imagery Services Market Revenue (Million) Forecast, by Application 2019 & 2032
- Table 31: Germany Nordics Satellite Imagery Services Market Revenue (Million) Forecast, by Application 2019 & 2032
- Table 32: France Nordics Satellite Imagery Services Market Revenue (Million) Forecast, by Application 2019 & 2032
- Table 33: Italy Nordics Satellite Imagery Services Market Revenue (Million) Forecast, by Application 2019 & 2032
- Table 34: Spain Nordics Satellite Imagery Services Market Revenue (Million) Forecast, by Application 2019 & 2032
- Table 35: Russia Nordics Satellite Imagery Services Market Revenue (Million) Forecast, by Application 2019 & 2032
- Table 36: Benelux Nordics Satellite Imagery Services Market Revenue (Million) Forecast, by Application 2019 & 2032
- Table 37: Nordics Nordics Satellite Imagery Services Market Revenue (Million) Forecast, by Application 2019 & 2032
- Table 38: Rest of Europe Nordics Satellite Imagery Services Market Revenue (Million) Forecast, by Application 2019 & 2032
- Table 39: Global Nordics Satellite Imagery Services Market Revenue Million Forecast, by Application 2019 & 2032
- Table 40: Global Nordics Satellite Imagery Services Market Revenue Million Forecast, by End User 2019 & 2032
- Table 41: Global Nordics Satellite Imagery Services Market Revenue Million Forecast, by Country 2019 & 2032
- Table 42: Turkey Nordics Satellite Imagery Services Market Revenue (Million) Forecast, by Application 2019 & 2032
- Table 43: Israel Nordics Satellite Imagery Services Market Revenue (Million) Forecast, by Application 2019 & 2032
- Table 44: GCC Nordics Satellite Imagery Services Market Revenue (Million) Forecast, by Application 2019 & 2032
- Table 45: North Africa Nordics Satellite Imagery Services Market Revenue (Million) Forecast, by Application 2019 & 2032
- Table 46: South Africa Nordics Satellite Imagery Services Market Revenue (Million) Forecast, by Application 2019 & 2032
- Table 47: Rest of Middle East & Africa Nordics Satellite Imagery Services Market Revenue (Million) Forecast, by Application 2019 & 2032
- Table 48: Global Nordics Satellite Imagery Services Market Revenue Million Forecast, by Application 2019 & 2032
- Table 49: Global Nordics Satellite Imagery Services Market Revenue Million Forecast, by End User 2019 & 2032
- Table 50: Global Nordics Satellite Imagery Services Market Revenue Million Forecast, by Country 2019 & 2032
- Table 51: China Nordics Satellite Imagery Services Market Revenue (Million) Forecast, by Application 2019 & 2032
- Table 52: India Nordics Satellite Imagery Services Market Revenue (Million) Forecast, by Application 2019 & 2032
- Table 53: Japan Nordics Satellite Imagery Services Market Revenue (Million) Forecast, by Application 2019 & 2032
- Table 54: South Korea Nordics Satellite Imagery Services Market Revenue (Million) Forecast, by Application 2019 & 2032
- Table 55: ASEAN Nordics Satellite Imagery Services Market Revenue (Million) Forecast, by Application 2019 & 2032
- Table 56: Oceania Nordics Satellite Imagery Services Market Revenue (Million) Forecast, by Application 2019 & 2032
- Table 57: Rest of Asia Pacific Nordics Satellite Imagery Services Market Revenue (Million) Forecast, by Application 2019 & 2032
Frequently Asked Questions
1. What is the projected Compound Annual Growth Rate (CAGR) of the Nordics Satellite Imagery Services Market?
The projected CAGR is approximately 13.62%.
2. Which companies are prominent players in the Nordics Satellite Imagery Services Market?
Key companies in the market include Airbus, L3Harris Technologie, Maxar Technologies, OHB Sweden, Thales Alenia Space, Mapillary, Planet Labs, KONGSBERG SATELLITE SERVICES (KSAT), Lantmäteriet, ICEYE.
3. What are the main segments of the Nordics Satellite Imagery Services Market?
The market segments include Application, End User.
4. Can you provide details about the market size?
The market size is estimated to be USD 0.22 Million as of 2022.
5. What are some drivers contributing to market growth?
Increasing Demand among Various End-user Industries. notablly in Forestry Sector; Adoption of Big Data and Imagery Analytics.
6. What are the notable trends driving market growth?
Forestry and Agriculture is Analyzed to Hold Significant Market Share.
7. Are there any restraints impacting market growth?
High Cost of Satellite Imaging Data Acquisition and Processing.
8. Can you provide examples of recent developments in the market?
May 2023 - Business Finland granted EUR 30 million (USD 32.75 million) loan funding for ICEYE's product development project based on innovative new sensor and space technology that will provide real-time and reliable information to support decision-making worldwide. The project aims to create a unique information and software platform, design and develop technology for next-generation satellites, and apply the high-accuracy information from satellites globally for natural catastrophe analysis, modeling, and decision-making.
9. What pricing options are available for accessing the report?
Pricing options include single-user, multi-user, and enterprise licenses priced at USD 3800, USD 4500, and USD 5800 respectively.
10. Is the market size provided in terms of value or volume?
The market size is provided in terms of value, measured in Million.
11. Are there any specific market keywords associated with the report?
Yes, the market keyword associated with the report is "Nordics Satellite Imagery Services Market," which aids in identifying and referencing the specific market segment covered.
12. How do I determine which pricing option suits my needs best?
The pricing options vary based on user requirements and access needs. Individual users may opt for single-user licenses, while businesses requiring broader access may choose multi-user or enterprise licenses for cost-effective access to the report.
13. Are there any additional resources or data provided in the Nordics Satellite Imagery Services Market report?
While the report offers comprehensive insights, it's advisable to review the specific contents or supplementary materials provided to ascertain if additional resources or data are available.
14. How can I stay updated on further developments or reports in the Nordics Satellite Imagery Services Market?
To stay informed about further developments, trends, and reports in the Nordics Satellite Imagery Services Market, consider subscribing to industry newsletters, following relevant companies and organizations, or regularly checking reputable industry news sources and publications.
Methodology
Step 1 - Identification of Relevant Samples Size from Population Database


Step 2 - Approaches for Defining Global Market Size (Value, Volume* & Price*)

Note*: In applicable scenarios
Step 3 - Data Sources
Primary Research
- Web Analytics
- Survey Reports
- Research Institute
- Latest Research Reports
- Opinion Leaders
Secondary Research
- Annual Reports
- White Paper
- Latest Press Release
- Industry Association
- Paid Database
- Investor Presentations

Step 4 - Data Triangulation
Involves using different sources of information in order to increase the validity of a study
These sources are likely to be stakeholders in a program - participants, other researchers, program staff, other community members, and so on.
Then we put all data in single framework & apply various statistical tools to find out the dynamic on the market.
During the analysis stage, feedback from the stakeholder groups would be compared to determine areas of agreement as well as areas of divergence


