
Key Insights
The Non-Surgical Aesthetic Devices market is experiencing robust growth, projected to reach a substantial size driven by increasing demand for minimally invasive cosmetic procedures. The market's 7.10% CAGR from 2019-2024 suggests a continued upward trajectory, fueled by several key factors. Technological advancements in laser, radiofrequency, ultrasound, and intense pulsed light devices are leading to more effective and safer treatments, attracting a wider patient base. Rising disposable incomes, particularly in developing economies, are expanding market accessibility. The increasing prevalence of aging populations globally, coupled with a growing awareness of non-surgical cosmetic options, significantly contributes to market expansion. Segment-wise, skin resurfacing and tightening applications currently hold a dominant position, followed by body contouring and hair removal. However, the market is witnessing a surge in demand for tattoo removal treatments, indicating substantial growth potential in this segment. Key players, such as El En S p A, Sisram Medical, and Boston Scientific, are continuously investing in research and development to enhance device efficacy and safety, leading to a competitive yet innovative market landscape. Geographical distribution reveals strong growth in North America and Europe, but emerging markets in Asia Pacific and Latin America are showing significant promise, presenting lucrative investment opportunities.
The competitive landscape is characterized by established players focused on product differentiation through technological advancements and strategic partnerships. The market is likely to witness consolidation in the coming years, with larger companies acquiring smaller players to strengthen their market position and product portfolio. Regulatory approvals and safety concerns remain important challenges. However, robust regulatory frameworks and stringent safety standards are likely to positively influence market growth in the long term by promoting patient trust. The future of the Non-Surgical Aesthetic Devices market appears promising, with ongoing technological innovations, increased affordability, and growing consumer awareness set to drive further expansion throughout the forecast period (2025-2033). The market will continue to see a shift towards personalized treatments, tailored to individual patient needs and preferences.
Non-Surgical Aesthetic Devices Market: A Comprehensive Report (2019-2033)
This in-depth report provides a comprehensive analysis of the Non-Surgical Aesthetic Devices Market, covering market size, segmentation, growth drivers, challenges, competitive landscape, and future outlook. The study period spans from 2019 to 2033, with 2025 as the base and estimated year. The report offers actionable insights for stakeholders, including manufacturers, distributors, investors, and regulatory bodies. The market is segmented by application, end-user, and device type, providing granular insights into each segment's performance and potential.
Non-Surgical Aesthetic Devices Market Structure & Competitive Dynamics
The Non-Surgical Aesthetic Devices market exhibits a moderately consolidated structure, with key players holding significant market share. The market concentration is driven by factors including high entry barriers (requiring significant R&D investment and regulatory approvals), brand recognition, and established distribution networks. Innovation ecosystems are highly dynamic, fueled by continuous technological advancements in laser, radiofrequency, ultrasound, and intense pulsed light technologies. Regulatory frameworks vary across regions, impacting market entry and product approvals. The market faces competition from alternative aesthetic treatments, including surgical procedures and home-based devices, though the non-surgical segment continues to attract a large customer base due to its minimal downtime and improved safety profiles. Mergers and acquisitions (M&A) activity has been moderate in recent years, with deal values averaging approximately xx Million USD per transaction. Some notable M&A activities have involved consolidating distribution channels and expanding product portfolios.
- Market Share: Top 5 players hold approximately xx% of the global market.
- M&A Activity: An average of xx M&A deals occurred annually between 2019 and 2024, with total deal values exceeding xx Million USD.
- Regulatory Landscape: Variations in regulatory approvals across regions create both opportunities and challenges for market expansion.
- Key Competitive Strategies: Focus on technological innovation, product differentiation, strategic partnerships, and expanding distribution networks.
Non-Surgical Aesthetic Devices Market Industry Trends & Insights
The Non-Surgical Aesthetic Devices market is experiencing robust growth, driven by increasing consumer demand for non-invasive cosmetic procedures. The rising prevalence of aesthetic concerns, coupled with growing disposable incomes and a greater emphasis on personal appearance, particularly in developed regions, are key drivers. Technological advancements, such as the introduction of more precise and effective devices, are further accelerating market growth. The market has witnessed a significant shift towards minimally invasive procedures, with patients preferring shorter recovery times and reduced risks associated with surgery. The market is characterized by a high level of innovation, with new devices and treatment modalities continually emerging. The market penetration rate varies across different applications and regions, with skin resurfacing and hair removal segments witnessing the highest adoption rates. The compound annual growth rate (CAGR) for the forecast period (2025-2033) is estimated to be xx%. Competitive dynamics are intensifying, with companies focusing on product innovation, strategic partnerships, and enhanced marketing efforts.
Dominant Markets & Segments in Non-Surgical Aesthetic Devices Market
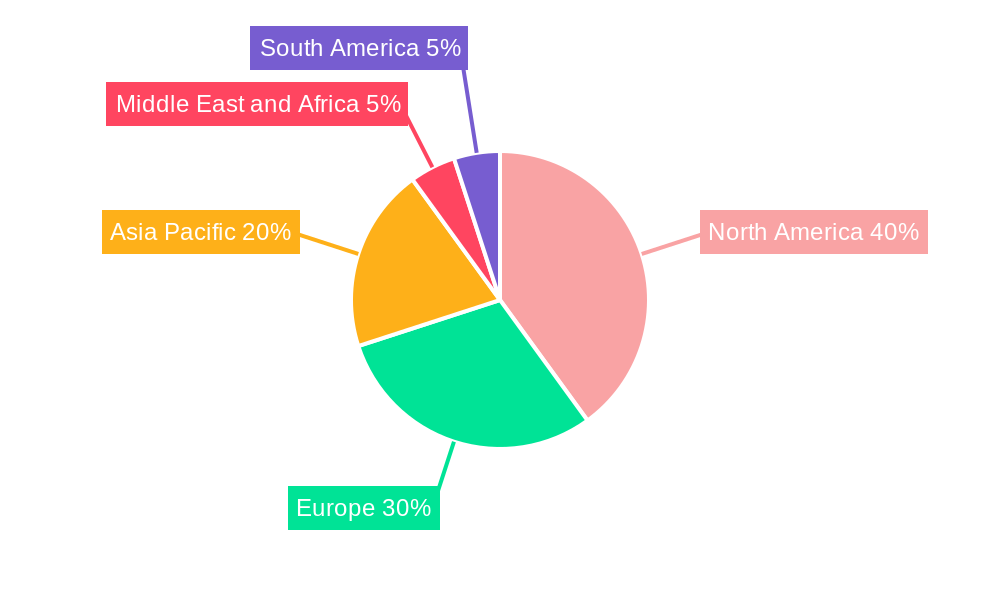
The North American region currently holds the largest market share in the Non-Surgical Aesthetic Devices market, driven by high consumer spending on aesthetic treatments, well-established healthcare infrastructure, and a high adoption rate of advanced technologies. Within the application segments, Skin Resurfacing and Tightening holds the largest market share, followed by Hair Removal and Body Contouring. The Beauty Clinics segment dominates the end-user landscape due to their accessibility and focus on aesthetic treatments. Laser-based aesthetic devices are the most prevalent device type, accounting for a significant proportion of the market.
- Key Drivers for North American Dominance: High disposable incomes, advanced healthcare infrastructure, strong regulatory support, and high awareness of aesthetic procedures.
- Skin Resurfacing & Tightening: Driven by increasing prevalence of age-related skin concerns and the desire for youthful appearance.
- Hair Removal: Fueled by rising demand for permanent hair reduction solutions.
- Laser-based Aesthetic Devices: Dominance due to their efficacy and diverse applications.
Non-Surgical Aesthetic Devices Market Product Innovations
Recent years have witnessed significant advancements in non-surgical aesthetic devices, with a focus on enhanced efficacy, improved safety profiles, and reduced treatment times. Innovations include the development of multi-platform devices offering various treatment modalities and personalized treatment options. The integration of advanced technologies like AI and machine learning for precise treatment delivery is gaining traction. These innovations cater to the evolving consumer preferences for convenient, effective, and safe treatments, driving market expansion.
Report Segmentation & Scope
This report provides a detailed segmentation of the Non-Surgical Aesthetic Devices market across various parameters:
Application: Skin Resurfacing and Tightening, Body Contouring and Cellulite Reduction, Hair Removal, Tattoo Removal, Other Applications. Each application segment shows significant growth potential, driven by specific consumer needs and technological advancements.
End-User: Hospital, Beauty Clinics, Other End-Users. Beauty Clinics are the dominant end-user segment due to their specialization in aesthetic treatments.
Type: Laser-based Aesthetic Device, Radiofrequency (RF) Based Aesthetic Device, Ultrasound Aesthetic Device, Intense Pulsed Light Device, Other Types. The Laser-based segment holds the largest market share, owing to its versatility and effectiveness.
Key Drivers of Non-Surgical Aesthetic Devices Market Growth
Several factors fuel the growth of the Non-Surgical Aesthetic Devices market:
- Technological Advancements: Continuous improvements in device technology, leading to more effective and safer treatments.
- Rising Disposable Incomes: Increased affordability of aesthetic procedures, particularly in emerging economies.
- Favorable Regulatory Landscape: Supportive regulatory frameworks in many regions promoting market expansion.
- Increasing Awareness: Greater public awareness of non-surgical aesthetic options through media and social influence.
Challenges in the Non-Surgical Aesthetic Devices Market Sector
The Non-Surgical Aesthetic Devices market faces several challenges:
- High Device Costs: The high initial investment in devices can limit market accessibility.
- Stringent Regulatory Approvals: Navigating complex regulatory pathways for product approvals can be time-consuming and costly.
- Competition from Surgical Procedures: Surgical options continue to compete with non-surgical methods.
- Potential Side Effects: Concerns regarding potential side effects can create barriers to adoption.
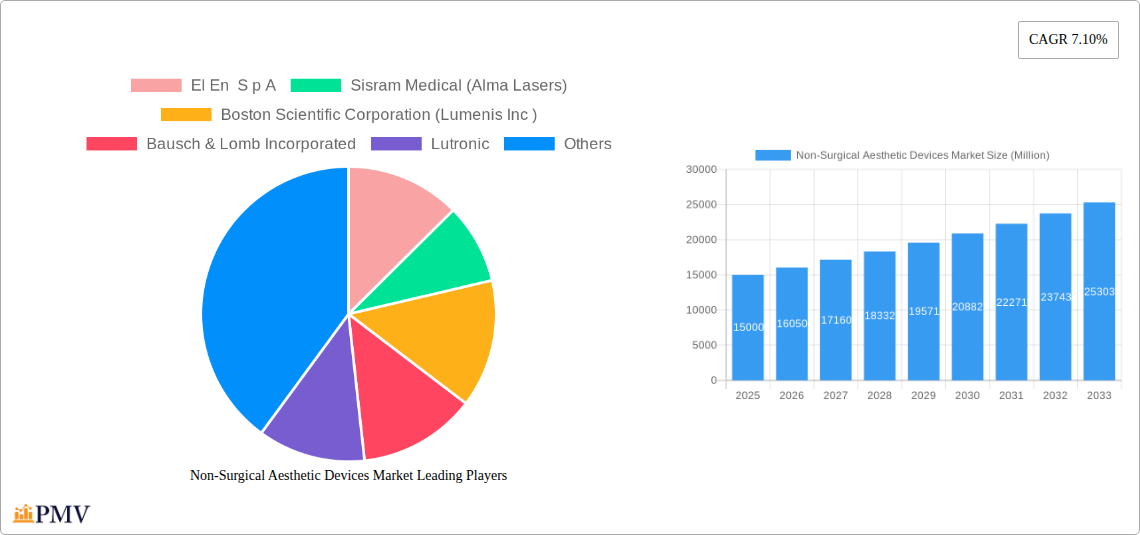
Leading Players in the Non-Surgical Aesthetic Devices Market Market
- El En S p A
- Sisram Medical (Alma Lasers)
- Boston Scientific Corporation (Lumenis Inc)
- Bausch & Lomb Incorporated
- Lutronic
- Fotona
- Cutera Inc
- STRATA Skin Sciences
- Lynton Lasers Ltd
- Sciton Inc
Key Developments in Non-Surgical Aesthetic Devices Market Sector
October 2022: Sensus Healthcare launched a portable hair removal laser system named Silk Laser Hair Removal System in the United States, expanding options for convenient hair removal treatments.
June 2022: Cynosure launched the FDA-approved PicoSure Pro device, a 755nm picosecond laser device, providing an advanced solution for pigmentation treatment and skin rejuvenation. This launch strengthened Cynosure's position in the market by offering a cutting-edge technology.
Strategic Non-Surgical Aesthetic Devices Market Outlook
The Non-Surgical Aesthetic Devices market is poised for continued expansion, driven by ongoing technological advancements, increasing consumer demand, and favorable regulatory environments. Strategic opportunities exist in developing innovative devices with enhanced efficacy and safety profiles, expanding into emerging markets, and fostering strategic partnerships to enhance market reach and distribution networks. Focus on personalized treatment options and integrating AI-powered solutions will be crucial for maintaining a competitive edge. The market is expected to witness significant growth in the coming years, driven by these factors and the increasing consumer preference for non-invasive cosmetic treatments.
Non-Surgical Aesthetic Devices Market Segmentation
-
1. Type
- 1.1. Laser-based Aesthetic Device
- 1.2. Radiofrequency (RF) Based Aesthetic Device
- 1.3. Ultrasound Aesthetic Device
- 1.4. Intense Pulsed Light Device
- 1.5. Other Types
-
2. Application
- 2.1. Skin Resurfacing and Tightening
- 2.2. Body Contouring and Cellulite Reduction
- 2.3. Hair Removal
- 2.4. Tattoo Removal
- 2.5. Other Applications
-
3. End-User
- 3.1. Hospital
- 3.2. Beauty Clinics
- 3.3. Other End-Users
Non-Surgical Aesthetic Devices Market Segmentation By Geography
-
1. North America
- 1.1. United States
- 1.2. Canada
- 1.3. Mexico
-
2. Europe
- 2.1. Germany
- 2.2. United Kingdom
- 2.3. France
- 2.4. Italy
- 2.5. Spain
- 2.6. Rest of Europe
-
3. Asia Pacific
- 3.1. China
- 3.2. Japan
- 3.3. India
- 3.4. Australia
- 3.5. South Korea
- 3.6. Rest of Asia Pacific
-
4. Middle East and Africa
- 4.1. GCC
- 4.2. South Africa
- 4.3. Rest of Middle East and Africa
-
5. South America
- 5.1. Brazil
- 5.2. Argentina
- 5.3. Rest of South America
Non-Surgical Aesthetic Devices Market REPORT HIGHLIGHTS
| Aspects | Details |
|---|---|
| Study Period | 2019-2033 |
| Base Year | 2024 |
| Estimated Year | 2025 |
| Forecast Period | 2025-2033 |
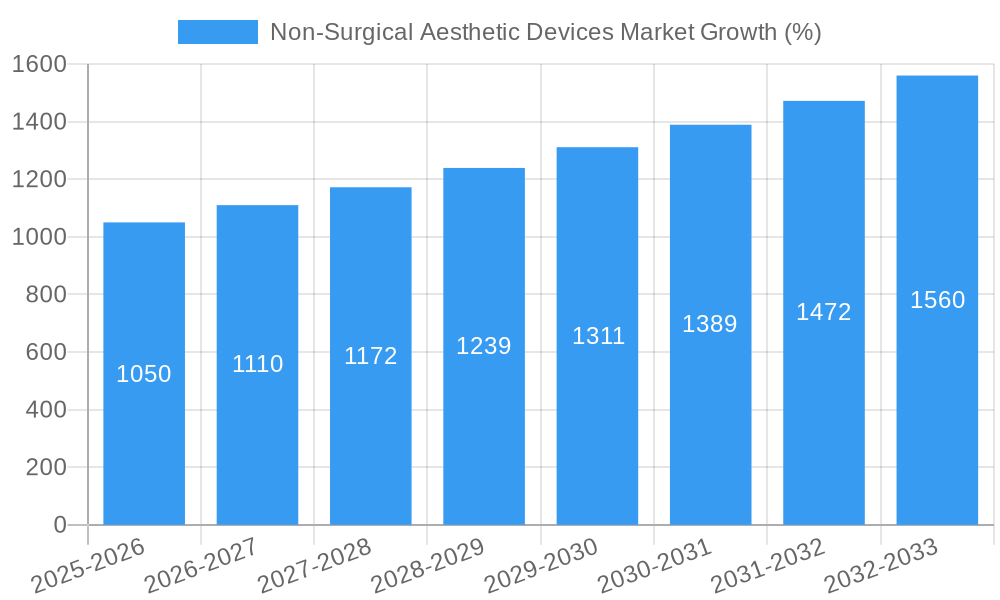
| Historical Period | 2019-2024 |
| Growth Rate | CAGR of 7.10% from 2019-2033 |
| Segmentation |
|
Table of Contents
- 1. Introduction
- 1.1. Research Scope
- 1.2. Market Segmentation
- 1.3. Research Methodology
- 1.4. Definitions and Assumptions
- 2. Executive Summary
- 2.1. Introduction
- 3. Market Dynamics
- 3.1. Introduction
- 3.2. Market Drivers
- 3.2.1. Increasing Demand for Non-surgical Aesthetics Procedures; Technological Advancements in Non-surgical Aesthetic Devices
- 3.3. Market Restrains
- 3.3.1. High Cost of the Devices
- 3.4. Market Trends
- 3.4.1. Skin Resurfacing and Tightening is Expected to Hold the Significant Market Share Over the Forecast period.
- 4. Market Factor Analysis
- 4.1. Porters Five Forces
- 4.2. Supply/Value Chain
- 4.3. PESTEL analysis
- 4.4. Market Entropy
- 4.5. Patent/Trademark Analysis
- 5. Global Non-Surgical Aesthetic Devices Market Analysis, Insights and Forecast, 2019-2031
- 5.1. Market Analysis, Insights and Forecast - by Type
- 5.1.1. Laser-based Aesthetic Device
- 5.1.2. Radiofrequency (RF) Based Aesthetic Device
- 5.1.3. Ultrasound Aesthetic Device
- 5.1.4. Intense Pulsed Light Device
- 5.1.5. Other Types
- 5.2. Market Analysis, Insights and Forecast - by Application
- 5.2.1. Skin Resurfacing and Tightening
- 5.2.2. Body Contouring and Cellulite Reduction
- 5.2.3. Hair Removal
- 5.2.4. Tattoo Removal
- 5.2.5. Other Applications
- 5.3. Market Analysis, Insights and Forecast - by End-User
- 5.3.1. Hospital
- 5.3.2. Beauty Clinics
- 5.3.3. Other End-Users
- 5.4. Market Analysis, Insights and Forecast - by Region
- 5.4.1. North America
- 5.4.2. Europe
- 5.4.3. Asia Pacific
- 5.4.4. Middle East and Africa
- 5.4.5. South America
- 5.1. Market Analysis, Insights and Forecast - by Type
- 6. North America Non-Surgical Aesthetic Devices Market Analysis, Insights and Forecast, 2019-2031
- 6.1. Market Analysis, Insights and Forecast - by Type
- 6.1.1. Laser-based Aesthetic Device
- 6.1.2. Radiofrequency (RF) Based Aesthetic Device
- 6.1.3. Ultrasound Aesthetic Device
- 6.1.4. Intense Pulsed Light Device
- 6.1.5. Other Types
- 6.2. Market Analysis, Insights and Forecast - by Application
- 6.2.1. Skin Resurfacing and Tightening
- 6.2.2. Body Contouring and Cellulite Reduction
- 6.2.3. Hair Removal
- 6.2.4. Tattoo Removal
- 6.2.5. Other Applications
- 6.3. Market Analysis, Insights and Forecast - by End-User
- 6.3.1. Hospital
- 6.3.2. Beauty Clinics
- 6.3.3. Other End-Users
- 6.1. Market Analysis, Insights and Forecast - by Type
- 7. Europe Non-Surgical Aesthetic Devices Market Analysis, Insights and Forecast, 2019-2031
- 7.1. Market Analysis, Insights and Forecast - by Type
- 7.1.1. Laser-based Aesthetic Device
- 7.1.2. Radiofrequency (RF) Based Aesthetic Device
- 7.1.3. Ultrasound Aesthetic Device
- 7.1.4. Intense Pulsed Light Device
- 7.1.5. Other Types
- 7.2. Market Analysis, Insights and Forecast - by Application
- 7.2.1. Skin Resurfacing and Tightening
- 7.2.2. Body Contouring and Cellulite Reduction
- 7.2.3. Hair Removal
- 7.2.4. Tattoo Removal
- 7.2.5. Other Applications
- 7.3. Market Analysis, Insights and Forecast - by End-User
- 7.3.1. Hospital
- 7.3.2. Beauty Clinics
- 7.3.3. Other End-Users
- 7.1. Market Analysis, Insights and Forecast - by Type
- 8. Asia Pacific Non-Surgical Aesthetic Devices Market Analysis, Insights and Forecast, 2019-2031
- 8.1. Market Analysis, Insights and Forecast - by Type
- 8.1.1. Laser-based Aesthetic Device
- 8.1.2. Radiofrequency (RF) Based Aesthetic Device
- 8.1.3. Ultrasound Aesthetic Device
- 8.1.4. Intense Pulsed Light Device
- 8.1.5. Other Types
- 8.2. Market Analysis, Insights and Forecast - by Application
- 8.2.1. Skin Resurfacing and Tightening
- 8.2.2. Body Contouring and Cellulite Reduction
- 8.2.3. Hair Removal
- 8.2.4. Tattoo Removal
- 8.2.5. Other Applications
- 8.3. Market Analysis, Insights and Forecast - by End-User
- 8.3.1. Hospital
- 8.3.2. Beauty Clinics
- 8.3.3. Other End-Users
- 8.1. Market Analysis, Insights and Forecast - by Type
- 9. Middle East and Africa Non-Surgical Aesthetic Devices Market Analysis, Insights and Forecast, 2019-2031
- 9.1. Market Analysis, Insights and Forecast - by Type
- 9.1.1. Laser-based Aesthetic Device
- 9.1.2. Radiofrequency (RF) Based Aesthetic Device
- 9.1.3. Ultrasound Aesthetic Device
- 9.1.4. Intense Pulsed Light Device
- 9.1.5. Other Types
- 9.2. Market Analysis, Insights and Forecast - by Application
- 9.2.1. Skin Resurfacing and Tightening
- 9.2.2. Body Contouring and Cellulite Reduction
- 9.2.3. Hair Removal
- 9.2.4. Tattoo Removal
- 9.2.5. Other Applications
- 9.3. Market Analysis, Insights and Forecast - by End-User
- 9.3.1. Hospital
- 9.3.2. Beauty Clinics
- 9.3.3. Other End-Users
- 9.1. Market Analysis, Insights and Forecast - by Type
- 10. South America Non-Surgical Aesthetic Devices Market Analysis, Insights and Forecast, 2019-2031
- 10.1. Market Analysis, Insights and Forecast - by Type
- 10.1.1. Laser-based Aesthetic Device
- 10.1.2. Radiofrequency (RF) Based Aesthetic Device
- 10.1.3. Ultrasound Aesthetic Device
- 10.1.4. Intense Pulsed Light Device
- 10.1.5. Other Types
- 10.2. Market Analysis, Insights and Forecast - by Application
- 10.2.1. Skin Resurfacing and Tightening
- 10.2.2. Body Contouring and Cellulite Reduction
- 10.2.3. Hair Removal
- 10.2.4. Tattoo Removal
- 10.2.5. Other Applications
- 10.3. Market Analysis, Insights and Forecast - by End-User
- 10.3.1. Hospital
- 10.3.2. Beauty Clinics
- 10.3.3. Other End-Users
- 10.1. Market Analysis, Insights and Forecast - by Type
- 11. North America Non-Surgical Aesthetic Devices Market Analysis, Insights and Forecast, 2019-2031
- 11.1. Market Analysis, Insights and Forecast - By Country/Sub-region
- 11.1.1 United States
- 11.1.2 Canada
- 11.1.3 Mexico
- 12. Europe Non-Surgical Aesthetic Devices Market Analysis, Insights and Forecast, 2019-2031
- 12.1. Market Analysis, Insights and Forecast - By Country/Sub-region
- 12.1.1 Germany
- 12.1.2 United Kingdom
- 12.1.3 France
- 12.1.4 Italy
- 12.1.5 Spain
- 12.1.6 Rest of Europe
- 13. Asia Pacific Non-Surgical Aesthetic Devices Market Analysis, Insights and Forecast, 2019-2031
- 13.1. Market Analysis, Insights and Forecast - By Country/Sub-region
- 13.1.1 China
- 13.1.2 Japan
- 13.1.3 India
- 13.1.4 Australia
- 13.1.5 South Korea
- 13.1.6 Rest of Asia Pacific
- 14. Middle East and Africa Non-Surgical Aesthetic Devices Market Analysis, Insights and Forecast, 2019-2031
- 14.1. Market Analysis, Insights and Forecast - By Country/Sub-region
- 14.1.1 GCC
- 14.1.2 South Africa
- 14.1.3 Rest of Middle East and Africa
- 15. South America Non-Surgical Aesthetic Devices Market Analysis, Insights and Forecast, 2019-2031
- 15.1. Market Analysis, Insights and Forecast - By Country/Sub-region
- 15.1.1 Brazil
- 15.1.2 Argentina
- 15.1.3 Rest of South America
- 16. Competitive Analysis
- 16.1. Global Market Share Analysis 2024
- 16.2. Company Profiles
- 16.2.1 El En S p A
- 16.2.1.1. Overview
- 16.2.1.2. Products
- 16.2.1.3. SWOT Analysis
- 16.2.1.4. Recent Developments
- 16.2.1.5. Financials (Based on Availability)
- 16.2.2 Sisram Medical (Alma Lasers)
- 16.2.2.1. Overview
- 16.2.2.2. Products
- 16.2.2.3. SWOT Analysis
- 16.2.2.4. Recent Developments
- 16.2.2.5. Financials (Based on Availability)
- 16.2.3 Boston Scientific Corporation (Lumenis Inc )
- 16.2.3.1. Overview
- 16.2.3.2. Products
- 16.2.3.3. SWOT Analysis
- 16.2.3.4. Recent Developments
- 16.2.3.5. Financials (Based on Availability)
- 16.2.4 Bausch & Lomb Incorporated
- 16.2.4.1. Overview
- 16.2.4.2. Products
- 16.2.4.3. SWOT Analysis
- 16.2.4.4. Recent Developments
- 16.2.4.5. Financials (Based on Availability)
- 16.2.5 Lutronic
- 16.2.5.1. Overview
- 16.2.5.2. Products
- 16.2.5.3. SWOT Analysis
- 16.2.5.4. Recent Developments
- 16.2.5.5. Financials (Based on Availability)
- 16.2.6 Fotona
- 16.2.6.1. Overview
- 16.2.6.2. Products
- 16.2.6.3. SWOT Analysis
- 16.2.6.4. Recent Developments
- 16.2.6.5. Financials (Based on Availability)
- 16.2.7 Cutera Inc
- 16.2.7.1. Overview
- 16.2.7.2. Products
- 16.2.7.3. SWOT Analysis
- 16.2.7.4. Recent Developments
- 16.2.7.5. Financials (Based on Availability)
- 16.2.8 STRATA Skin Sciences
- 16.2.8.1. Overview
- 16.2.8.2. Products
- 16.2.8.3. SWOT Analysis
- 16.2.8.4. Recent Developments
- 16.2.8.5. Financials (Based on Availability)
- 16.2.9 Lynton Lasers Ltd
- 16.2.9.1. Overview
- 16.2.9.2. Products
- 16.2.9.3. SWOT Analysis
- 16.2.9.4. Recent Developments
- 16.2.9.5. Financials (Based on Availability)
- 16.2.10 Sciton Inc
- 16.2.10.1. Overview
- 16.2.10.2. Products
- 16.2.10.3. SWOT Analysis
- 16.2.10.4. Recent Developments
- 16.2.10.5. Financials (Based on Availability)
- 16.2.1 El En S p A
List of Figures
- Figure 1: Global Non-Surgical Aesthetic Devices Market Revenue Breakdown (Million, %) by Region 2024 & 2032
- Figure 2: Global Non-Surgical Aesthetic Devices Market Volume Breakdown (K Unit, %) by Region 2024 & 2032
- Figure 3: North America Non-Surgical Aesthetic Devices Market Revenue (Million), by Country 2024 & 2032
- Figure 4: North America Non-Surgical Aesthetic Devices Market Volume (K Unit), by Country 2024 & 2032
- Figure 5: North America Non-Surgical Aesthetic Devices Market Revenue Share (%), by Country 2024 & 2032
- Figure 6: North America Non-Surgical Aesthetic Devices Market Volume Share (%), by Country 2024 & 2032
- Figure 7: Europe Non-Surgical Aesthetic Devices Market Revenue (Million), by Country 2024 & 2032
- Figure 8: Europe Non-Surgical Aesthetic Devices Market Volume (K Unit), by Country 2024 & 2032
- Figure 9: Europe Non-Surgical Aesthetic Devices Market Revenue Share (%), by Country 2024 & 2032
- Figure 10: Europe Non-Surgical Aesthetic Devices Market Volume Share (%), by Country 2024 & 2032
- Figure 11: Asia Pacific Non-Surgical Aesthetic Devices Market Revenue (Million), by Country 2024 & 2032
- Figure 12: Asia Pacific Non-Surgical Aesthetic Devices Market Volume (K Unit), by Country 2024 & 2032
- Figure 13: Asia Pacific Non-Surgical Aesthetic Devices Market Revenue Share (%), by Country 2024 & 2032
- Figure 14: Asia Pacific Non-Surgical Aesthetic Devices Market Volume Share (%), by Country 2024 & 2032
- Figure 15: Middle East and Africa Non-Surgical Aesthetic Devices Market Revenue (Million), by Country 2024 & 2032
- Figure 16: Middle East and Africa Non-Surgical Aesthetic Devices Market Volume (K Unit), by Country 2024 & 2032
- Figure 17: Middle East and Africa Non-Surgical Aesthetic Devices Market Revenue Share (%), by Country 2024 & 2032
- Figure 18: Middle East and Africa Non-Surgical Aesthetic Devices Market Volume Share (%), by Country 2024 & 2032
- Figure 19: South America Non-Surgical Aesthetic Devices Market Revenue (Million), by Country 2024 & 2032
- Figure 20: South America Non-Surgical Aesthetic Devices Market Volume (K Unit), by Country 2024 & 2032
- Figure 21: South America Non-Surgical Aesthetic Devices Market Revenue Share (%), by Country 2024 & 2032
- Figure 22: South America Non-Surgical Aesthetic Devices Market Volume Share (%), by Country 2024 & 2032
- Figure 23: North America Non-Surgical Aesthetic Devices Market Revenue (Million), by Type 2024 & 2032
- Figure 24: North America Non-Surgical Aesthetic Devices Market Volume (K Unit), by Type 2024 & 2032
- Figure 25: North America Non-Surgical Aesthetic Devices Market Revenue Share (%), by Type 2024 & 2032
- Figure 26: North America Non-Surgical Aesthetic Devices Market Volume Share (%), by Type 2024 & 2032
- Figure 27: North America Non-Surgical Aesthetic Devices Market Revenue (Million), by Application 2024 & 2032
- Figure 28: North America Non-Surgical Aesthetic Devices Market Volume (K Unit), by Application 2024 & 2032
- Figure 29: North America Non-Surgical Aesthetic Devices Market Revenue Share (%), by Application 2024 & 2032
- Figure 30: North America Non-Surgical Aesthetic Devices Market Volume Share (%), by Application 2024 & 2032
- Figure 31: North America Non-Surgical Aesthetic Devices Market Revenue (Million), by End-User 2024 & 2032
- Figure 32: North America Non-Surgical Aesthetic Devices Market Volume (K Unit), by End-User 2024 & 2032
- Figure 33: North America Non-Surgical Aesthetic Devices Market Revenue Share (%), by End-User 2024 & 2032
- Figure 34: North America Non-Surgical Aesthetic Devices Market Volume Share (%), by End-User 2024 & 2032
- Figure 35: North America Non-Surgical Aesthetic Devices Market Revenue (Million), by Country 2024 & 2032
- Figure 36: North America Non-Surgical Aesthetic Devices Market Volume (K Unit), by Country 2024 & 2032
- Figure 37: North America Non-Surgical Aesthetic Devices Market Revenue Share (%), by Country 2024 & 2032
- Figure 38: North America Non-Surgical Aesthetic Devices Market Volume Share (%), by Country 2024 & 2032
- Figure 39: Europe Non-Surgical Aesthetic Devices Market Revenue (Million), by Type 2024 & 2032
- Figure 40: Europe Non-Surgical Aesthetic Devices Market Volume (K Unit), by Type 2024 & 2032
- Figure 41: Europe Non-Surgical Aesthetic Devices Market Revenue Share (%), by Type 2024 & 2032
- Figure 42: Europe Non-Surgical Aesthetic Devices Market Volume Share (%), by Type 2024 & 2032
- Figure 43: Europe Non-Surgical Aesthetic Devices Market Revenue (Million), by Application 2024 & 2032
- Figure 44: Europe Non-Surgical Aesthetic Devices Market Volume (K Unit), by Application 2024 & 2032
- Figure 45: Europe Non-Surgical Aesthetic Devices Market Revenue Share (%), by Application 2024 & 2032
- Figure 46: Europe Non-Surgical Aesthetic Devices Market Volume Share (%), by Application 2024 & 2032
- Figure 47: Europe Non-Surgical Aesthetic Devices Market Revenue (Million), by End-User 2024 & 2032
- Figure 48: Europe Non-Surgical Aesthetic Devices Market Volume (K Unit), by End-User 2024 & 2032
- Figure 49: Europe Non-Surgical Aesthetic Devices Market Revenue Share (%), by End-User 2024 & 2032
- Figure 50: Europe Non-Surgical Aesthetic Devices Market Volume Share (%), by End-User 2024 & 2032
- Figure 51: Europe Non-Surgical Aesthetic Devices Market Revenue (Million), by Country 2024 & 2032
- Figure 52: Europe Non-Surgical Aesthetic Devices Market Volume (K Unit), by Country 2024 & 2032
- Figure 53: Europe Non-Surgical Aesthetic Devices Market Revenue Share (%), by Country 2024 & 2032
- Figure 54: Europe Non-Surgical Aesthetic Devices Market Volume Share (%), by Country 2024 & 2032
- Figure 55: Asia Pacific Non-Surgical Aesthetic Devices Market Revenue (Million), by Type 2024 & 2032
- Figure 56: Asia Pacific Non-Surgical Aesthetic Devices Market Volume (K Unit), by Type 2024 & 2032
- Figure 57: Asia Pacific Non-Surgical Aesthetic Devices Market Revenue Share (%), by Type 2024 & 2032
- Figure 58: Asia Pacific Non-Surgical Aesthetic Devices Market Volume Share (%), by Type 2024 & 2032
- Figure 59: Asia Pacific Non-Surgical Aesthetic Devices Market Revenue (Million), by Application 2024 & 2032
- Figure 60: Asia Pacific Non-Surgical Aesthetic Devices Market Volume (K Unit), by Application 2024 & 2032
- Figure 61: Asia Pacific Non-Surgical Aesthetic Devices Market Revenue Share (%), by Application 2024 & 2032
- Figure 62: Asia Pacific Non-Surgical Aesthetic Devices Market Volume Share (%), by Application 2024 & 2032
- Figure 63: Asia Pacific Non-Surgical Aesthetic Devices Market Revenue (Million), by End-User 2024 & 2032
- Figure 64: Asia Pacific Non-Surgical Aesthetic Devices Market Volume (K Unit), by End-User 2024 & 2032
- Figure 65: Asia Pacific Non-Surgical Aesthetic Devices Market Revenue Share (%), by End-User 2024 & 2032
- Figure 66: Asia Pacific Non-Surgical Aesthetic Devices Market Volume Share (%), by End-User 2024 & 2032
- Figure 67: Asia Pacific Non-Surgical Aesthetic Devices Market Revenue (Million), by Country 2024 & 2032
- Figure 68: Asia Pacific Non-Surgical Aesthetic Devices Market Volume (K Unit), by Country 2024 & 2032
- Figure 69: Asia Pacific Non-Surgical Aesthetic Devices Market Revenue Share (%), by Country 2024 & 2032
- Figure 70: Asia Pacific Non-Surgical Aesthetic Devices Market Volume Share (%), by Country 2024 & 2032
- Figure 71: Middle East and Africa Non-Surgical Aesthetic Devices Market Revenue (Million), by Type 2024 & 2032
- Figure 72: Middle East and Africa Non-Surgical Aesthetic Devices Market Volume (K Unit), by Type 2024 & 2032
- Figure 73: Middle East and Africa Non-Surgical Aesthetic Devices Market Revenue Share (%), by Type 2024 & 2032
- Figure 74: Middle East and Africa Non-Surgical Aesthetic Devices Market Volume Share (%), by Type 2024 & 2032
- Figure 75: Middle East and Africa Non-Surgical Aesthetic Devices Market Revenue (Million), by Application 2024 & 2032
- Figure 76: Middle East and Africa Non-Surgical Aesthetic Devices Market Volume (K Unit), by Application 2024 & 2032
- Figure 77: Middle East and Africa Non-Surgical Aesthetic Devices Market Revenue Share (%), by Application 2024 & 2032
- Figure 78: Middle East and Africa Non-Surgical Aesthetic Devices Market Volume Share (%), by Application 2024 & 2032
- Figure 79: Middle East and Africa Non-Surgical Aesthetic Devices Market Revenue (Million), by End-User 2024 & 2032
- Figure 80: Middle East and Africa Non-Surgical Aesthetic Devices Market Volume (K Unit), by End-User 2024 & 2032
- Figure 81: Middle East and Africa Non-Surgical Aesthetic Devices Market Revenue Share (%), by End-User 2024 & 2032
- Figure 82: Middle East and Africa Non-Surgical Aesthetic Devices Market Volume Share (%), by End-User 2024 & 2032
- Figure 83: Middle East and Africa Non-Surgical Aesthetic Devices Market Revenue (Million), by Country 2024 & 2032
- Figure 84: Middle East and Africa Non-Surgical Aesthetic Devices Market Volume (K Unit), by Country 2024 & 2032
- Figure 85: Middle East and Africa Non-Surgical Aesthetic Devices Market Revenue Share (%), by Country 2024 & 2032
- Figure 86: Middle East and Africa Non-Surgical Aesthetic Devices Market Volume Share (%), by Country 2024 & 2032
- Figure 87: South America Non-Surgical Aesthetic Devices Market Revenue (Million), by Type 2024 & 2032
- Figure 88: South America Non-Surgical Aesthetic Devices Market Volume (K Unit), by Type 2024 & 2032
- Figure 89: South America Non-Surgical Aesthetic Devices Market Revenue Share (%), by Type 2024 & 2032
- Figure 90: South America Non-Surgical Aesthetic Devices Market Volume Share (%), by Type 2024 & 2032
- Figure 91: South America Non-Surgical Aesthetic Devices Market Revenue (Million), by Application 2024 & 2032
- Figure 92: South America Non-Surgical Aesthetic Devices Market Volume (K Unit), by Application 2024 & 2032
- Figure 93: South America Non-Surgical Aesthetic Devices Market Revenue Share (%), by Application 2024 & 2032
- Figure 94: South America Non-Surgical Aesthetic Devices Market Volume Share (%), by Application 2024 & 2032
- Figure 95: South America Non-Surgical Aesthetic Devices Market Revenue (Million), by End-User 2024 & 2032
- Figure 96: South America Non-Surgical Aesthetic Devices Market Volume (K Unit), by End-User 2024 & 2032
- Figure 97: South America Non-Surgical Aesthetic Devices Market Revenue Share (%), by End-User 2024 & 2032
- Figure 98: South America Non-Surgical Aesthetic Devices Market Volume Share (%), by End-User 2024 & 2032
- Figure 99: South America Non-Surgical Aesthetic Devices Market Revenue (Million), by Country 2024 & 2032
- Figure 100: South America Non-Surgical Aesthetic Devices Market Volume (K Unit), by Country 2024 & 2032
- Figure 101: South America Non-Surgical Aesthetic Devices Market Revenue Share (%), by Country 2024 & 2032
- Figure 102: South America Non-Surgical Aesthetic Devices Market Volume Share (%), by Country 2024 & 2032
List of Tables
- Table 1: Global Non-Surgical Aesthetic Devices Market Revenue Million Forecast, by Region 2019 & 2032
- Table 2: Global Non-Surgical Aesthetic Devices Market Volume K Unit Forecast, by Region 2019 & 2032
- Table 3: Global Non-Surgical Aesthetic Devices Market Revenue Million Forecast, by Type 2019 & 2032
- Table 4: Global Non-Surgical Aesthetic Devices Market Volume K Unit Forecast, by Type 2019 & 2032
- Table 5: Global Non-Surgical Aesthetic Devices Market Revenue Million Forecast, by Application 2019 & 2032
- Table 6: Global Non-Surgical Aesthetic Devices Market Volume K Unit Forecast, by Application 2019 & 2032
- Table 7: Global Non-Surgical Aesthetic Devices Market Revenue Million Forecast, by End-User 2019 & 2032
- Table 8: Global Non-Surgical Aesthetic Devices Market Volume K Unit Forecast, by End-User 2019 & 2032
- Table 9: Global Non-Surgical Aesthetic Devices Market Revenue Million Forecast, by Region 2019 & 2032
- Table 10: Global Non-Surgical Aesthetic Devices Market Volume K Unit Forecast, by Region 2019 & 2032
- Table 11: Global Non-Surgical Aesthetic Devices Market Revenue Million Forecast, by Country 2019 & 2032
- Table 12: Global Non-Surgical Aesthetic Devices Market Volume K Unit Forecast, by Country 2019 & 2032
- Table 13: United States Non-Surgical Aesthetic Devices Market Revenue (Million) Forecast, by Application 2019 & 2032
- Table 14: United States Non-Surgical Aesthetic Devices Market Volume (K Unit) Forecast, by Application 2019 & 2032
- Table 15: Canada Non-Surgical Aesthetic Devices Market Revenue (Million) Forecast, by Application 2019 & 2032
- Table 16: Canada Non-Surgical Aesthetic Devices Market Volume (K Unit) Forecast, by Application 2019 & 2032
- Table 17: Mexico Non-Surgical Aesthetic Devices Market Revenue (Million) Forecast, by Application 2019 & 2032
- Table 18: Mexico Non-Surgical Aesthetic Devices Market Volume (K Unit) Forecast, by Application 2019 & 2032
- Table 19: Global Non-Surgical Aesthetic Devices Market Revenue Million Forecast, by Country 2019 & 2032
- Table 20: Global Non-Surgical Aesthetic Devices Market Volume K Unit Forecast, by Country 2019 & 2032
- Table 21: Germany Non-Surgical Aesthetic Devices Market Revenue (Million) Forecast, by Application 2019 & 2032
- Table 22: Germany Non-Surgical Aesthetic Devices Market Volume (K Unit) Forecast, by Application 2019 & 2032
- Table 23: United Kingdom Non-Surgical Aesthetic Devices Market Revenue (Million) Forecast, by Application 2019 & 2032
- Table 24: United Kingdom Non-Surgical Aesthetic Devices Market Volume (K Unit) Forecast, by Application 2019 & 2032
- Table 25: France Non-Surgical Aesthetic Devices Market Revenue (Million) Forecast, by Application 2019 & 2032
- Table 26: France Non-Surgical Aesthetic Devices Market Volume (K Unit) Forecast, by Application 2019 & 2032
- Table 27: Italy Non-Surgical Aesthetic Devices Market Revenue (Million) Forecast, by Application 2019 & 2032
- Table 28: Italy Non-Surgical Aesthetic Devices Market Volume (K Unit) Forecast, by Application 2019 & 2032
- Table 29: Spain Non-Surgical Aesthetic Devices Market Revenue (Million) Forecast, by Application 2019 & 2032
- Table 30: Spain Non-Surgical Aesthetic Devices Market Volume (K Unit) Forecast, by Application 2019 & 2032
- Table 31: Rest of Europe Non-Surgical Aesthetic Devices Market Revenue (Million) Forecast, by Application 2019 & 2032
- Table 32: Rest of Europe Non-Surgical Aesthetic Devices Market Volume (K Unit) Forecast, by Application 2019 & 2032
- Table 33: Global Non-Surgical Aesthetic Devices Market Revenue Million Forecast, by Country 2019 & 2032
- Table 34: Global Non-Surgical Aesthetic Devices Market Volume K Unit Forecast, by Country 2019 & 2032
- Table 35: China Non-Surgical Aesthetic Devices Market Revenue (Million) Forecast, by Application 2019 & 2032
- Table 36: China Non-Surgical Aesthetic Devices Market Volume (K Unit) Forecast, by Application 2019 & 2032
- Table 37: Japan Non-Surgical Aesthetic Devices Market Revenue (Million) Forecast, by Application 2019 & 2032
- Table 38: Japan Non-Surgical Aesthetic Devices Market Volume (K Unit) Forecast, by Application 2019 & 2032
- Table 39: India Non-Surgical Aesthetic Devices Market Revenue (Million) Forecast, by Application 2019 & 2032
- Table 40: India Non-Surgical Aesthetic Devices Market Volume (K Unit) Forecast, by Application 2019 & 2032
- Table 41: Australia Non-Surgical Aesthetic Devices Market Revenue (Million) Forecast, by Application 2019 & 2032
- Table 42: Australia Non-Surgical Aesthetic Devices Market Volume (K Unit) Forecast, by Application 2019 & 2032
- Table 43: South Korea Non-Surgical Aesthetic Devices Market Revenue (Million) Forecast, by Application 2019 & 2032
- Table 44: South Korea Non-Surgical Aesthetic Devices Market Volume (K Unit) Forecast, by Application 2019 & 2032
- Table 45: Rest of Asia Pacific Non-Surgical Aesthetic Devices Market Revenue (Million) Forecast, by Application 2019 & 2032
- Table 46: Rest of Asia Pacific Non-Surgical Aesthetic Devices Market Volume (K Unit) Forecast, by Application 2019 & 2032
- Table 47: Global Non-Surgical Aesthetic Devices Market Revenue Million Forecast, by Country 2019 & 2032
- Table 48: Global Non-Surgical Aesthetic Devices Market Volume K Unit Forecast, by Country 2019 & 2032
- Table 49: GCC Non-Surgical Aesthetic Devices Market Revenue (Million) Forecast, by Application 2019 & 2032
- Table 50: GCC Non-Surgical Aesthetic Devices Market Volume (K Unit) Forecast, by Application 2019 & 2032
- Table 51: South Africa Non-Surgical Aesthetic Devices Market Revenue (Million) Forecast, by Application 2019 & 2032
- Table 52: South Africa Non-Surgical Aesthetic Devices Market Volume (K Unit) Forecast, by Application 2019 & 2032
- Table 53: Rest of Middle East and Africa Non-Surgical Aesthetic Devices Market Revenue (Million) Forecast, by Application 2019 & 2032
- Table 54: Rest of Middle East and Africa Non-Surgical Aesthetic Devices Market Volume (K Unit) Forecast, by Application 2019 & 2032
- Table 55: Global Non-Surgical Aesthetic Devices Market Revenue Million Forecast, by Country 2019 & 2032
- Table 56: Global Non-Surgical Aesthetic Devices Market Volume K Unit Forecast, by Country 2019 & 2032
- Table 57: Brazil Non-Surgical Aesthetic Devices Market Revenue (Million) Forecast, by Application 2019 & 2032
- Table 58: Brazil Non-Surgical Aesthetic Devices Market Volume (K Unit) Forecast, by Application 2019 & 2032
- Table 59: Argentina Non-Surgical Aesthetic Devices Market Revenue (Million) Forecast, by Application 2019 & 2032
- Table 60: Argentina Non-Surgical Aesthetic Devices Market Volume (K Unit) Forecast, by Application 2019 & 2032
- Table 61: Rest of South America Non-Surgical Aesthetic Devices Market Revenue (Million) Forecast, by Application 2019 & 2032
- Table 62: Rest of South America Non-Surgical Aesthetic Devices Market Volume (K Unit) Forecast, by Application 2019 & 2032
- Table 63: Global Non-Surgical Aesthetic Devices Market Revenue Million Forecast, by Type 2019 & 2032
- Table 64: Global Non-Surgical Aesthetic Devices Market Volume K Unit Forecast, by Type 2019 & 2032
- Table 65: Global Non-Surgical Aesthetic Devices Market Revenue Million Forecast, by Application 2019 & 2032
- Table 66: Global Non-Surgical Aesthetic Devices Market Volume K Unit Forecast, by Application 2019 & 2032
- Table 67: Global Non-Surgical Aesthetic Devices Market Revenue Million Forecast, by End-User 2019 & 2032
- Table 68: Global Non-Surgical Aesthetic Devices Market Volume K Unit Forecast, by End-User 2019 & 2032
- Table 69: Global Non-Surgical Aesthetic Devices Market Revenue Million Forecast, by Country 2019 & 2032
- Table 70: Global Non-Surgical Aesthetic Devices Market Volume K Unit Forecast, by Country 2019 & 2032
- Table 71: United States Non-Surgical Aesthetic Devices Market Revenue (Million) Forecast, by Application 2019 & 2032
- Table 72: United States Non-Surgical Aesthetic Devices Market Volume (K Unit) Forecast, by Application 2019 & 2032
- Table 73: Canada Non-Surgical Aesthetic Devices Market Revenue (Million) Forecast, by Application 2019 & 2032
- Table 74: Canada Non-Surgical Aesthetic Devices Market Volume (K Unit) Forecast, by Application 2019 & 2032
- Table 75: Mexico Non-Surgical Aesthetic Devices Market Revenue (Million) Forecast, by Application 2019 & 2032
- Table 76: Mexico Non-Surgical Aesthetic Devices Market Volume (K Unit) Forecast, by Application 2019 & 2032
- Table 77: Global Non-Surgical Aesthetic Devices Market Revenue Million Forecast, by Type 2019 & 2032
- Table 78: Global Non-Surgical Aesthetic Devices Market Volume K Unit Forecast, by Type 2019 & 2032
- Table 79: Global Non-Surgical Aesthetic Devices Market Revenue Million Forecast, by Application 2019 & 2032
- Table 80: Global Non-Surgical Aesthetic Devices Market Volume K Unit Forecast, by Application 2019 & 2032
- Table 81: Global Non-Surgical Aesthetic Devices Market Revenue Million Forecast, by End-User 2019 & 2032
- Table 82: Global Non-Surgical Aesthetic Devices Market Volume K Unit Forecast, by End-User 2019 & 2032
- Table 83: Global Non-Surgical Aesthetic Devices Market Revenue Million Forecast, by Country 2019 & 2032
- Table 84: Global Non-Surgical Aesthetic Devices Market Volume K Unit Forecast, by Country 2019 & 2032
- Table 85: Germany Non-Surgical Aesthetic Devices Market Revenue (Million) Forecast, by Application 2019 & 2032
- Table 86: Germany Non-Surgical Aesthetic Devices Market Volume (K Unit) Forecast, by Application 2019 & 2032
- Table 87: United Kingdom Non-Surgical Aesthetic Devices Market Revenue (Million) Forecast, by Application 2019 & 2032
- Table 88: United Kingdom Non-Surgical Aesthetic Devices Market Volume (K Unit) Forecast, by Application 2019 & 2032
- Table 89: France Non-Surgical Aesthetic Devices Market Revenue (Million) Forecast, by Application 2019 & 2032
- Table 90: France Non-Surgical Aesthetic Devices Market Volume (K Unit) Forecast, by Application 2019 & 2032
- Table 91: Italy Non-Surgical Aesthetic Devices Market Revenue (Million) Forecast, by Application 2019 & 2032
- Table 92: Italy Non-Surgical Aesthetic Devices Market Volume (K Unit) Forecast, by Application 2019 & 2032
- Table 93: Spain Non-Surgical Aesthetic Devices Market Revenue (Million) Forecast, by Application 2019 & 2032
- Table 94: Spain Non-Surgical Aesthetic Devices Market Volume (K Unit) Forecast, by Application 2019 & 2032
- Table 95: Rest of Europe Non-Surgical Aesthetic Devices Market Revenue (Million) Forecast, by Application 2019 & 2032
- Table 96: Rest of Europe Non-Surgical Aesthetic Devices Market Volume (K Unit) Forecast, by Application 2019 & 2032
- Table 97: Global Non-Surgical Aesthetic Devices Market Revenue Million Forecast, by Type 2019 & 2032
- Table 98: Global Non-Surgical Aesthetic Devices Market Volume K Unit Forecast, by Type 2019 & 2032
- Table 99: Global Non-Surgical Aesthetic Devices Market Revenue Million Forecast, by Application 2019 & 2032
- Table 100: Global Non-Surgical Aesthetic Devices Market Volume K Unit Forecast, by Application 2019 & 2032
- Table 101: Global Non-Surgical Aesthetic Devices Market Revenue Million Forecast, by End-User 2019 & 2032
- Table 102: Global Non-Surgical Aesthetic Devices Market Volume K Unit Forecast, by End-User 2019 & 2032
- Table 103: Global Non-Surgical Aesthetic Devices Market Revenue Million Forecast, by Country 2019 & 2032
- Table 104: Global Non-Surgical Aesthetic Devices Market Volume K Unit Forecast, by Country 2019 & 2032
- Table 105: China Non-Surgical Aesthetic Devices Market Revenue (Million) Forecast, by Application 2019 & 2032
- Table 106: China Non-Surgical Aesthetic Devices Market Volume (K Unit) Forecast, by Application 2019 & 2032
- Table 107: Japan Non-Surgical Aesthetic Devices Market Revenue (Million) Forecast, by Application 2019 & 2032
- Table 108: Japan Non-Surgical Aesthetic Devices Market Volume (K Unit) Forecast, by Application 2019 & 2032
- Table 109: India Non-Surgical Aesthetic Devices Market Revenue (Million) Forecast, by Application 2019 & 2032
- Table 110: India Non-Surgical Aesthetic Devices Market Volume (K Unit) Forecast, by Application 2019 & 2032
- Table 111: Australia Non-Surgical Aesthetic Devices Market Revenue (Million) Forecast, by Application 2019 & 2032
- Table 112: Australia Non-Surgical Aesthetic Devices Market Volume (K Unit) Forecast, by Application 2019 & 2032
- Table 113: South Korea Non-Surgical Aesthetic Devices Market Revenue (Million) Forecast, by Application 2019 & 2032
- Table 114: South Korea Non-Surgical Aesthetic Devices Market Volume (K Unit) Forecast, by Application 2019 & 2032
- Table 115: Rest of Asia Pacific Non-Surgical Aesthetic Devices Market Revenue (Million) Forecast, by Application 2019 & 2032
- Table 116: Rest of Asia Pacific Non-Surgical Aesthetic Devices Market Volume (K Unit) Forecast, by Application 2019 & 2032
- Table 117: Global Non-Surgical Aesthetic Devices Market Revenue Million Forecast, by Type 2019 & 2032
- Table 118: Global Non-Surgical Aesthetic Devices Market Volume K Unit Forecast, by Type 2019 & 2032
- Table 119: Global Non-Surgical Aesthetic Devices Market Revenue Million Forecast, by Application 2019 & 2032
- Table 120: Global Non-Surgical Aesthetic Devices Market Volume K Unit Forecast, by Application 2019 & 2032
- Table 121: Global Non-Surgical Aesthetic Devices Market Revenue Million Forecast, by End-User 2019 & 2032
- Table 122: Global Non-Surgical Aesthetic Devices Market Volume K Unit Forecast, by End-User 2019 & 2032
- Table 123: Global Non-Surgical Aesthetic Devices Market Revenue Million Forecast, by Country 2019 & 2032
- Table 124: Global Non-Surgical Aesthetic Devices Market Volume K Unit Forecast, by Country 2019 & 2032
- Table 125: GCC Non-Surgical Aesthetic Devices Market Revenue (Million) Forecast, by Application 2019 & 2032
- Table 126: GCC Non-Surgical Aesthetic Devices Market Volume (K Unit) Forecast, by Application 2019 & 2032
- Table 127: South Africa Non-Surgical Aesthetic Devices Market Revenue (Million) Forecast, by Application 2019 & 2032
- Table 128: South Africa Non-Surgical Aesthetic Devices Market Volume (K Unit) Forecast, by Application 2019 & 2032
- Table 129: Rest of Middle East and Africa Non-Surgical Aesthetic Devices Market Revenue (Million) Forecast, by Application 2019 & 2032
- Table 130: Rest of Middle East and Africa Non-Surgical Aesthetic Devices Market Volume (K Unit) Forecast, by Application 2019 & 2032
- Table 131: Global Non-Surgical Aesthetic Devices Market Revenue Million Forecast, by Type 2019 & 2032
- Table 132: Global Non-Surgical Aesthetic Devices Market Volume K Unit Forecast, by Type 2019 & 2032
- Table 133: Global Non-Surgical Aesthetic Devices Market Revenue Million Forecast, by Application 2019 & 2032
- Table 134: Global Non-Surgical Aesthetic Devices Market Volume K Unit Forecast, by Application 2019 & 2032
- Table 135: Global Non-Surgical Aesthetic Devices Market Revenue Million Forecast, by End-User 2019 & 2032
- Table 136: Global Non-Surgical Aesthetic Devices Market Volume K Unit Forecast, by End-User 2019 & 2032
- Table 137: Global Non-Surgical Aesthetic Devices Market Revenue Million Forecast, by Country 2019 & 2032
- Table 138: Global Non-Surgical Aesthetic Devices Market Volume K Unit Forecast, by Country 2019 & 2032
- Table 139: Brazil Non-Surgical Aesthetic Devices Market Revenue (Million) Forecast, by Application 2019 & 2032
- Table 140: Brazil Non-Surgical Aesthetic Devices Market Volume (K Unit) Forecast, by Application 2019 & 2032
- Table 141: Argentina Non-Surgical Aesthetic Devices Market Revenue (Million) Forecast, by Application 2019 & 2032
- Table 142: Argentina Non-Surgical Aesthetic Devices Market Volume (K Unit) Forecast, by Application 2019 & 2032
- Table 143: Rest of South America Non-Surgical Aesthetic Devices Market Revenue (Million) Forecast, by Application 2019 & 2032
- Table 144: Rest of South America Non-Surgical Aesthetic Devices Market Volume (K Unit) Forecast, by Application 2019 & 2032
Frequently Asked Questions
1. What is the projected Compound Annual Growth Rate (CAGR) of the Non-Surgical Aesthetic Devices Market?
The projected CAGR is approximately 7.10%.
2. Which companies are prominent players in the Non-Surgical Aesthetic Devices Market?
Key companies in the market include El En S p A, Sisram Medical (Alma Lasers), Boston Scientific Corporation (Lumenis Inc ), Bausch & Lomb Incorporated, Lutronic, Fotona, Cutera Inc, STRATA Skin Sciences, Lynton Lasers Ltd, Sciton Inc.
3. What are the main segments of the Non-Surgical Aesthetic Devices Market?
The market segments include Type, Application, End-User.
4. Can you provide details about the market size?
The market size is estimated to be USD XX Million as of 2022.
5. What are some drivers contributing to market growth?
Increasing Demand for Non-surgical Aesthetics Procedures; Technological Advancements in Non-surgical Aesthetic Devices.
6. What are the notable trends driving market growth?
Skin Resurfacing and Tightening is Expected to Hold the Significant Market Share Over the Forecast period..
7. Are there any restraints impacting market growth?
High Cost of the Devices.
8. Can you provide examples of recent developments in the market?
October 2022: Sensus Healthcare launched a portable hair removal laser system named Silk Laser Hair Removal System in the United States.
9. What pricing options are available for accessing the report?
Pricing options include single-user, multi-user, and enterprise licenses priced at USD 4750, USD 5250, and USD 8750 respectively.
10. Is the market size provided in terms of value or volume?
The market size is provided in terms of value, measured in Million and volume, measured in K Unit.
11. Are there any specific market keywords associated with the report?
Yes, the market keyword associated with the report is "Non-Surgical Aesthetic Devices Market," which aids in identifying and referencing the specific market segment covered.
12. How do I determine which pricing option suits my needs best?
The pricing options vary based on user requirements and access needs. Individual users may opt for single-user licenses, while businesses requiring broader access may choose multi-user or enterprise licenses for cost-effective access to the report.
13. Are there any additional resources or data provided in the Non-Surgical Aesthetic Devices Market report?
While the report offers comprehensive insights, it's advisable to review the specific contents or supplementary materials provided to ascertain if additional resources or data are available.
14. How can I stay updated on further developments or reports in the Non-Surgical Aesthetic Devices Market?
To stay informed about further developments, trends, and reports in the Non-Surgical Aesthetic Devices Market, consider subscribing to industry newsletters, following relevant companies and organizations, or regularly checking reputable industry news sources and publications.
Methodology
Step 1 - Identification of Relevant Samples Size from Population Database


Step 2 - Approaches for Defining Global Market Size (Value, Volume* & Price*)

Note*: In applicable scenarios
Step 3 - Data Sources
Primary Research
- Web Analytics
- Survey Reports
- Research Institute
- Latest Research Reports
- Opinion Leaders
Secondary Research
- Annual Reports
- White Paper
- Latest Press Release
- Industry Association
- Paid Database
- Investor Presentations

Step 4 - Data Triangulation
Involves using different sources of information in order to increase the validity of a study
These sources are likely to be stakeholders in a program - participants, other researchers, program staff, other community members, and so on.
Then we put all data in single framework & apply various statistical tools to find out the dynamic on the market.
During the analysis stage, feedback from the stakeholder groups would be compared to determine areas of agreement as well as areas of divergence


