
Key Insights
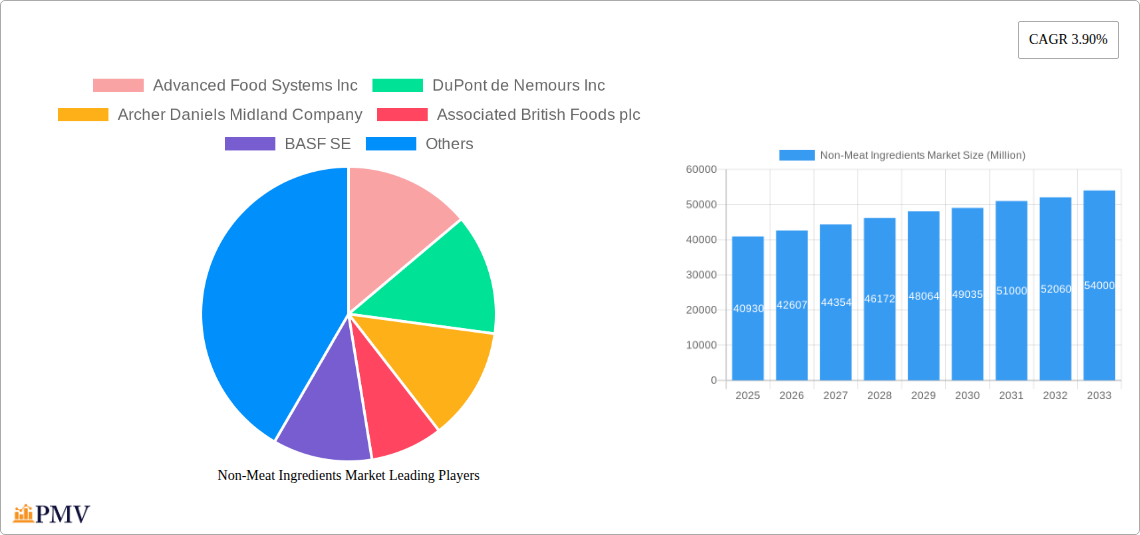
The global non-meat ingredients market, valued at $40.93 billion in 2025, is projected to experience robust growth, driven by several key factors. The increasing popularity of vegetarian, vegan, and flexitarian diets is a significant catalyst, fueling demand for innovative and high-quality ingredients that replicate the taste, texture, and nutritional profile of meat products. Technological advancements in food processing and formulation are also contributing to market expansion, enabling the development of more realistic and palatable meat alternatives. Furthermore, growing consumer awareness of health and sustainability concerns is driving the adoption of plant-based protein sources, further boosting the market's trajectory. Specific ingredient segments like binders (for texture), flavoring agents (for taste), and texturing agents (for mimicking meat-like structure) are expected to witness particularly strong growth. The processed and pre-cooked segments within the product type category are anticipated to dominate the market due to consumer preference for convenience and ease of preparation. Geographical regions like North America and Europe, with established vegan and vegetarian markets, are expected to maintain a significant market share, although rapid growth is projected in Asia Pacific, driven by rising disposable incomes and changing dietary habits in countries like India and China. Competition is intense, with established food giants and specialty ingredient suppliers vying for market dominance.
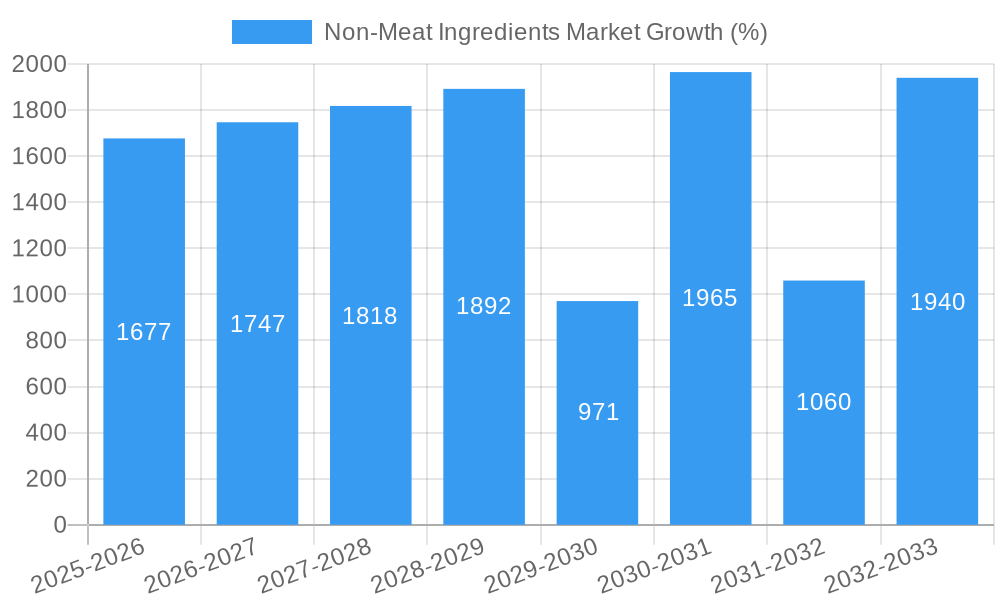
The market's 3.90% CAGR suggests a steady and predictable growth path through 2033. However, several challenges remain. Price fluctuations in raw materials and regulatory hurdles related to food safety and labeling could pose constraints. Consumer perception and acceptance of non-meat alternatives, though improving, also remain a factor. Continued innovation, focusing on improved taste, texture, and affordability, will be crucial for sustained growth. Strategic partnerships and collaborations among ingredient suppliers and food manufacturers are also likely to shape the market landscape, fostering further innovation and market penetration. The ongoing trend towards plant-based eating is expected to continue propelling the market forward, although overcoming these challenges will be critical to realizing the full market potential.
Non-Meat Ingredients Market: A Comprehensive Report (2019-2033)
This meticulously researched report provides an in-depth analysis of the Non-Meat Ingredients Market, offering invaluable insights for stakeholders seeking to navigate this dynamic sector. Spanning the period from 2019 to 2033, with a base year of 2025 and a forecast period of 2025-2033, this report offers a complete understanding of market size, growth trajectories, and key competitive dynamics. The market is valued at xx Million in 2025 and is projected to reach xx Million by 2033, exhibiting a CAGR of xx%.
Non-Meat Ingredients Market Market Structure & Competitive Dynamics
The Non-Meat Ingredients Market exhibits a moderately concentrated structure, with key players such as Advanced Food Systems Inc, DuPont de Nemours Inc, Archer Daniels Midland Company, Associated British Foods plc, BASF SE, Kerry Group PLC, Ingredion Incorporated, Koninklijke DSM N.V., Cargill Incorporated, and Roquette Frères holding significant market share. The market is characterized by a dynamic innovation ecosystem, driven by the increasing demand for plant-based alternatives and technological advancements in ingredient production. Regulatory frameworks concerning food safety and labeling significantly influence market operations. Competition is intense, with companies focusing on product differentiation through functional properties, cost optimization, and sustainability initiatives. The market witnesses frequent mergers and acquisitions (M&A), with deal values averaging xx Million in recent years, aimed at expanding product portfolios and market reach. Substitute ingredients, such as traditional meat proteins, exert competitive pressure, but the increasing consumer preference for plant-based diets is driving market expansion. End-user trends, including health consciousness and ethical concerns, are strongly influencing product development and market growth.
- Market Concentration: Moderate
- M&A Activity: High, with average deal values of xx Million.
- Key Competitive Strategies: Product differentiation, cost optimization, sustainability.
- Regulatory Influence: Significant impact on product labeling and safety standards.
Non-Meat Ingredients Market Industry Trends & Insights
The Non-Meat Ingredients Market is experiencing robust growth, driven by several key factors. The rising global population, coupled with increasing consumer awareness of health and environmental concerns associated with meat consumption, is fueling the demand for plant-based alternatives. Technological advancements in ingredient processing and formulation are enabling the creation of increasingly realistic and appealing meat substitutes. This includes the development of novel texturizing agents, flavoring systems, and binding technologies that mimic the sensory characteristics of meat. Consumer preferences are shifting towards plant-based diets, driven by ethical considerations, health benefits, and environmental sustainability. These trends are fostering significant market penetration, with a projected CAGR of xx% during the forecast period. Competitive dynamics are characterized by intense innovation, strategic partnerships, and M&A activities, creating a highly dynamic market landscape. The market penetration of non-meat ingredients in various food applications continues to increase. This is particularly evident in the growth of plant-based burgers, sausages, and other meat alternatives.
Dominant Markets & Segments in Non-Meat Ingredients Market
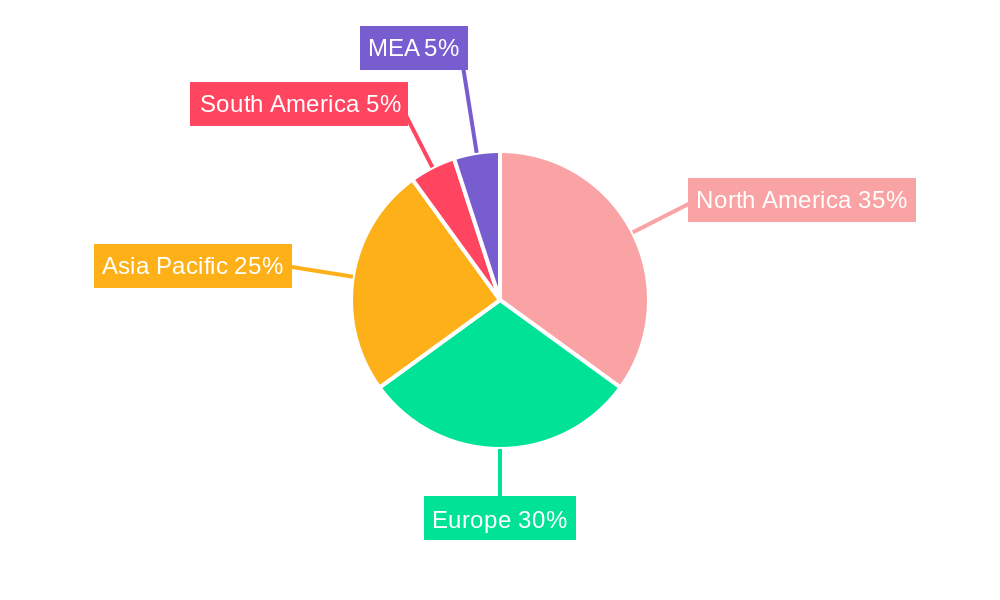
The North American region currently dominates the Non-Meat Ingredients Market, followed by Europe and Asia-Pacific. This dominance stems from factors including:
- North America: High consumer adoption of plant-based products, robust innovation ecosystem, and established supply chains.
- Europe: Strong focus on sustainability and ethical consumption, coupled with favorable regulatory frameworks.
- Asia-Pacific: Rapid economic growth, rising disposable incomes, and increasing awareness of health benefits are driving market expansion.
Within the segments:
By Ingredient: Flavoring agents and texturizing agents are the leading segments, driven by their critical role in mimicking the sensory attributes of meat.
By Product Type: Fresh processed non-meat products are experiencing the highest demand due to preference for fresh, convenient food options.
Key Drivers (North America): Strong consumer preference for plant-based foods, established distribution networks, and significant investment in R&D.
Key Drivers (Europe): Stringent environmental regulations, increasing health consciousness, and a mature market for plant-based products.
Key Drivers (Asia-Pacific): Rising middle class, changing dietary habits, and growing awareness of health and environmental issues.
Non-Meat Ingredients Market Product Innovations
Recent product developments in the non-meat ingredients market focus on enhancing the taste, texture, and nutritional profile of plant-based meat alternatives. This includes innovations in protein extraction, texturization technologies, and flavor delivery systems. Companies are leveraging advanced technologies such as 3D printing and precision fermentation to create more realistic and appealing meat substitutes. These innovations are driving increased market acceptance and expanding the range of applications for non-meat ingredients. The focus is on developing clean-label, sustainable, and cost-effective solutions that meet consumer expectations for both taste and health benefits.
Report Segmentation & Scope
This report segments the Non-Meat Ingredients Market based on ingredient type (Binders, Extenders, Fillers, Flavoring Agents, Coloring Agents, Preservatives, Salt, Texturing Agents) and product type (Fresh Processed, Raw Cooked, Pre Cooked, Raw Fermented Sausages, Others). Each segment is analyzed in detail, providing insights into market size, growth projections, and competitive dynamics. Growth projections vary significantly across segments, with flavoring agents and texturizing agents showing strong potential. The competitive landscape differs across segments, with certain players dominating specific ingredient categories.
Key Drivers of Non-Meat Ingredients Market Growth
The Non-Meat Ingredients Market is propelled by several key growth drivers. The increasing global demand for plant-based protein sources due to health and environmental concerns is a significant factor. Technological advancements, such as the development of novel protein sources and improved texturizing agents, are enhancing the quality and appeal of meat alternatives. Favorable government policies and regulations, promoting sustainable food options, are further accelerating market growth. The rising popularity of veganism and vegetarianism is also contributing to the expansion of this market.
Challenges in the Non-Meat Ingredients Market Sector
The Non-Meat Ingredients Market faces challenges including maintaining consistent product quality and sensory characteristics, cost-effectiveness compared to conventional meat products, and consumer perceptions and acceptance. Supply chain disruptions can significantly affect the availability and cost of raw materials. Strict regulations regarding labeling and food safety add complexity to market operations, impacting smaller players disproportionately. Intense competition among established and emerging players puts pressure on margins and innovation efforts.
Leading Players in the Non-Meat Ingredients Market Market
- Advanced Food Systems Inc
- DuPont de Nemours Inc
- Archer Daniels Midland Company
- Associated British Foods plc
- BASF SE
- Kerry Group PLC
- Ingredion Incorporated
- Koninklijke DSM N.V.
- Cargill Incorporated
- Roquette Frères
Key Developments in Non-Meat Ingredients Market Sector
- 2023: DuPont introduced a new line of plant-based protein ingredients.
- 2022: Cargill invested in expanding its production capacity for non-meat ingredients.
- 2021: A merger between two smaller players created a new significant player in the market. (Further details are available in the full report)
Strategic Non-Meat Ingredients Market Market Outlook
The Non-Meat Ingredients Market is poised for significant growth in the coming years, driven by sustained demand for plant-based alternatives and continuous technological innovations. Strategic opportunities exist for companies focused on developing sustainable, cost-effective, and high-quality ingredients. Partnerships and collaborations across the value chain, from ingredient suppliers to food manufacturers, will be crucial for optimizing product development and market penetration. Expansion into emerging markets with growing consumer demand for plant-based foods will offer significant growth potential.
Non-Meat Ingredients Market Segmentation
-
1. Ingredient
- 1.1. Binders
- 1.2. Extenders
- 1.3. Fillers
- 1.4. Flavoring Agents
- 1.5. Coloring Agents
- 1.6. Preservatives
- 1.7. Salt
- 1.8. Texturing Agents
-
2. Product Type
- 2.1. Fresh Processed
- 2.2. Raw Cooked
- 2.3. Pre Cooked
- 2.4. Raw Fermented Sausages
- 2.5. Others
Non-Meat Ingredients Market Segmentation By Geography
-
1. North America
- 1.1. United States
- 1.2. Canada
- 1.3. Mexico
- 1.4. Rest of North America
-
2. Europe
- 2.1. Spain
- 2.2. United Kingdom
- 2.3. Germany
- 2.4. France
- 2.5. Italy
- 2.6. Rest of Europe
-
3. Asia Pacific
- 3.1. China
- 3.2. Japan
- 3.3. India
- 3.4. Australia
- 3.5. Rest of Asia Pacific
-
4. Rest of the World
- 4.1. Brazil
- 4.2. Argentina
- 4.3. Others
- 5. Middle East
-
6. South Africa
- 6.1. Saudi Arabia
- 6.2. Rest of Middle East
Non-Meat Ingredients Market REPORT HIGHLIGHTS
| Aspects | Details |
|---|---|
| Study Period | 2019-2033 |
| Base Year | 2024 |
| Estimated Year | 2025 |
| Forecast Period | 2025-2033 |
| Historical Period | 2019-2024 |
| Growth Rate | CAGR of 3.90% from 2019-2033 |
| Segmentation |
|
Table of Contents
- 1. Introduction
- 1.1. Research Scope
- 1.2. Market Segmentation
- 1.3. Research Methodology
- 1.4. Definitions and Assumptions
- 2. Executive Summary
- 2.1. Introduction
- 3. Market Dynamics
- 3.1. Introduction
- 3.2. Market Drivers
- 3.2.1. Growing Health and Fitness Consciousness Among Japanese; Increasing Demand for Meat Analogues
- 3.3. Market Restrains
- 3.3.1. Higher Production Costs and Limited Capacities
- 3.4. Market Trends
- 3.4.1. Increasing Consumption of Meat Snacks
- 4. Market Factor Analysis
- 4.1. Porters Five Forces
- 4.2. Supply/Value Chain
- 4.3. PESTEL analysis
- 4.4. Market Entropy
- 4.5. Patent/Trademark Analysis
- 5. Global Non-Meat Ingredients Market Analysis, Insights and Forecast, 2019-2031
- 5.1. Market Analysis, Insights and Forecast - by Ingredient
- 5.1.1. Binders
- 5.1.2. Extenders
- 5.1.3. Fillers
- 5.1.4. Flavoring Agents
- 5.1.5. Coloring Agents
- 5.1.6. Preservatives
- 5.1.7. Salt
- 5.1.8. Texturing Agents
- 5.2. Market Analysis, Insights and Forecast - by Product Type
- 5.2.1. Fresh Processed
- 5.2.2. Raw Cooked
- 5.2.3. Pre Cooked
- 5.2.4. Raw Fermented Sausages
- 5.2.5. Others
- 5.3. Market Analysis, Insights and Forecast - by Region
- 5.3.1. North America
- 5.3.2. Europe
- 5.3.3. Asia Pacific
- 5.3.4. Rest of the World
- 5.3.5. Middle East
- 5.3.6. South Africa
- 5.1. Market Analysis, Insights and Forecast - by Ingredient
- 6. North America Non-Meat Ingredients Market Analysis, Insights and Forecast, 2019-2031
- 6.1. Market Analysis, Insights and Forecast - by Ingredient
- 6.1.1. Binders
- 6.1.2. Extenders
- 6.1.3. Fillers
- 6.1.4. Flavoring Agents
- 6.1.5. Coloring Agents
- 6.1.6. Preservatives
- 6.1.7. Salt
- 6.1.8. Texturing Agents
- 6.2. Market Analysis, Insights and Forecast - by Product Type
- 6.2.1. Fresh Processed
- 6.2.2. Raw Cooked
- 6.2.3. Pre Cooked
- 6.2.4. Raw Fermented Sausages
- 6.2.5. Others
- 6.1. Market Analysis, Insights and Forecast - by Ingredient
- 7. Europe Non-Meat Ingredients Market Analysis, Insights and Forecast, 2019-2031
- 7.1. Market Analysis, Insights and Forecast - by Ingredient
- 7.1.1. Binders
- 7.1.2. Extenders
- 7.1.3. Fillers
- 7.1.4. Flavoring Agents
- 7.1.5. Coloring Agents
- 7.1.6. Preservatives
- 7.1.7. Salt
- 7.1.8. Texturing Agents
- 7.2. Market Analysis, Insights and Forecast - by Product Type
- 7.2.1. Fresh Processed
- 7.2.2. Raw Cooked
- 7.2.3. Pre Cooked
- 7.2.4. Raw Fermented Sausages
- 7.2.5. Others
- 7.1. Market Analysis, Insights and Forecast - by Ingredient
- 8. Asia Pacific Non-Meat Ingredients Market Analysis, Insights and Forecast, 2019-2031
- 8.1. Market Analysis, Insights and Forecast - by Ingredient
- 8.1.1. Binders
- 8.1.2. Extenders
- 8.1.3. Fillers
- 8.1.4. Flavoring Agents
- 8.1.5. Coloring Agents
- 8.1.6. Preservatives
- 8.1.7. Salt
- 8.1.8. Texturing Agents
- 8.2. Market Analysis, Insights and Forecast - by Product Type
- 8.2.1. Fresh Processed
- 8.2.2. Raw Cooked
- 8.2.3. Pre Cooked
- 8.2.4. Raw Fermented Sausages
- 8.2.5. Others
- 8.1. Market Analysis, Insights and Forecast - by Ingredient
- 9. Rest of the World Non-Meat Ingredients Market Analysis, Insights and Forecast, 2019-2031
- 9.1. Market Analysis, Insights and Forecast - by Ingredient
- 9.1.1. Binders
- 9.1.2. Extenders
- 9.1.3. Fillers
- 9.1.4. Flavoring Agents
- 9.1.5. Coloring Agents
- 9.1.6. Preservatives
- 9.1.7. Salt
- 9.1.8. Texturing Agents
- 9.2. Market Analysis, Insights and Forecast - by Product Type
- 9.2.1. Fresh Processed
- 9.2.2. Raw Cooked
- 9.2.3. Pre Cooked
- 9.2.4. Raw Fermented Sausages
- 9.2.5. Others
- 9.1. Market Analysis, Insights and Forecast - by Ingredient
- 10. Middle East Non-Meat Ingredients Market Analysis, Insights and Forecast, 2019-2031
- 10.1. Market Analysis, Insights and Forecast - by Ingredient
- 10.1.1. Binders
- 10.1.2. Extenders
- 10.1.3. Fillers
- 10.1.4. Flavoring Agents
- 10.1.5. Coloring Agents
- 10.1.6. Preservatives
- 10.1.7. Salt
- 10.1.8. Texturing Agents
- 10.2. Market Analysis, Insights and Forecast - by Product Type
- 10.2.1. Fresh Processed
- 10.2.2. Raw Cooked
- 10.2.3. Pre Cooked
- 10.2.4. Raw Fermented Sausages
- 10.2.5. Others
- 10.1. Market Analysis, Insights and Forecast - by Ingredient
- 11. South Africa Non-Meat Ingredients Market Analysis, Insights and Forecast, 2019-2031
- 11.1. Market Analysis, Insights and Forecast - by Ingredient
- 11.1.1. Binders
- 11.1.2. Extenders
- 11.1.3. Fillers
- 11.1.4. Flavoring Agents
- 11.1.5. Coloring Agents
- 11.1.6. Preservatives
- 11.1.7. Salt
- 11.1.8. Texturing Agents
- 11.2. Market Analysis, Insights and Forecast - by Product Type
- 11.2.1. Fresh Processed
- 11.2.2. Raw Cooked
- 11.2.3. Pre Cooked
- 11.2.4. Raw Fermented Sausages
- 11.2.5. Others
- 11.1. Market Analysis, Insights and Forecast - by Ingredient
- 12. North America Non-Meat Ingredients Market Analysis, Insights and Forecast, 2019-2031
- 12.1. Market Analysis, Insights and Forecast - By Country/Sub-region
- 12.1.1 United States
- 12.1.2 Canada
- 12.1.3 Mexico
- 13. Europe Non-Meat Ingredients Market Analysis, Insights and Forecast, 2019-2031
- 13.1. Market Analysis, Insights and Forecast - By Country/Sub-region
- 13.1.1 Germany
- 13.1.2 United Kingdom
- 13.1.3 France
- 13.1.4 Spain
- 13.1.5 Italy
- 13.1.6 Spain
- 13.1.7 Belgium
- 13.1.8 Netherland
- 13.1.9 Nordics
- 13.1.10 Rest of Europe
- 14. Asia Pacific Non-Meat Ingredients Market Analysis, Insights and Forecast, 2019-2031
- 14.1. Market Analysis, Insights and Forecast - By Country/Sub-region
- 14.1.1 China
- 14.1.2 Japan
- 14.1.3 India
- 14.1.4 South Korea
- 14.1.5 Southeast Asia
- 14.1.6 Australia
- 14.1.7 Indonesia
- 14.1.8 Phillipes
- 14.1.9 Singapore
- 14.1.10 Thailandc
- 14.1.11 Rest of Asia Pacific
- 15. South America Non-Meat Ingredients Market Analysis, Insights and Forecast, 2019-2031
- 15.1. Market Analysis, Insights and Forecast - By Country/Sub-region
- 15.1.1 Brazil
- 15.1.2 Argentina
- 15.1.3 Peru
- 15.1.4 Chile
- 15.1.5 Colombia
- 15.1.6 Ecuador
- 15.1.7 Venezuela
- 15.1.8 Rest of South America
- 16. North America Non-Meat Ingredients Market Analysis, Insights and Forecast, 2019-2031
- 16.1. Market Analysis, Insights and Forecast - By Country/Sub-region
- 16.1.1 United States
- 16.1.2 Canada
- 16.1.3 Mexico
- 17. MEA Non-Meat Ingredients Market Analysis, Insights and Forecast, 2019-2031
- 17.1. Market Analysis, Insights and Forecast - By Country/Sub-region
- 17.1.1 United Arab Emirates
- 17.1.2 Saudi Arabia
- 17.1.3 South Africa
- 17.1.4 Rest of Middle East and Africa
- 18. Competitive Analysis
- 18.1. Global Market Share Analysis 2024
- 18.2. Company Profiles
- 18.2.1 Advanced Food Systems Inc
- 18.2.1.1. Overview
- 18.2.1.2. Products
- 18.2.1.3. SWOT Analysis
- 18.2.1.4. Recent Developments
- 18.2.1.5. Financials (Based on Availability)
- 18.2.2 DuPont de Nemours Inc
- 18.2.2.1. Overview
- 18.2.2.2. Products
- 18.2.2.3. SWOT Analysis
- 18.2.2.4. Recent Developments
- 18.2.2.5. Financials (Based on Availability)
- 18.2.3 Archer Daniels Midland Company
- 18.2.3.1. Overview
- 18.2.3.2. Products
- 18.2.3.3. SWOT Analysis
- 18.2.3.4. Recent Developments
- 18.2.3.5. Financials (Based on Availability)
- 18.2.4 Associated British Foods plc
- 18.2.4.1. Overview
- 18.2.4.2. Products
- 18.2.4.3. SWOT Analysis
- 18.2.4.4. Recent Developments
- 18.2.4.5. Financials (Based on Availability)
- 18.2.5 BASF SE
- 18.2.5.1. Overview
- 18.2.5.2. Products
- 18.2.5.3. SWOT Analysis
- 18.2.5.4. Recent Developments
- 18.2.5.5. Financials (Based on Availability)
- 18.2.6 Kerry Group PLC
- 18.2.6.1. Overview
- 18.2.6.2. Products
- 18.2.6.3. SWOT Analysis
- 18.2.6.4. Recent Developments
- 18.2.6.5. Financials (Based on Availability)
- 18.2.7 Ingredion Incorporated
- 18.2.7.1. Overview
- 18.2.7.2. Products
- 18.2.7.3. SWOT Analysis
- 18.2.7.4. Recent Developments
- 18.2.7.5. Financials (Based on Availability)
- 18.2.8 Koninklijke Dsm N V
- 18.2.8.1. Overview
- 18.2.8.2. Products
- 18.2.8.3. SWOT Analysis
- 18.2.8.4. Recent Developments
- 18.2.8.5. Financials (Based on Availability)
- 18.2.9 Cargill Incorporated
- 18.2.9.1. Overview
- 18.2.9.2. Products
- 18.2.9.3. SWOT Analysis
- 18.2.9.4. Recent Developments
- 18.2.9.5. Financials (Based on Availability)
- 18.2.10 Roquette Frères
- 18.2.10.1. Overview
- 18.2.10.2. Products
- 18.2.10.3. SWOT Analysis
- 18.2.10.4. Recent Developments
- 18.2.10.5. Financials (Based on Availability)
- 18.2.1 Advanced Food Systems Inc
List of Figures
- Figure 1: Global Non-Meat Ingredients Market Revenue Breakdown (Million, %) by Region 2024 & 2032
- Figure 2: Global Non-Meat Ingredients Market Volume Breakdown (K Tons, %) by Region 2024 & 2032
- Figure 3: North America Non-Meat Ingredients Market Revenue (Million), by Country 2024 & 2032
- Figure 4: North America Non-Meat Ingredients Market Volume (K Tons), by Country 2024 & 2032
- Figure 5: North America Non-Meat Ingredients Market Revenue Share (%), by Country 2024 & 2032
- Figure 6: North America Non-Meat Ingredients Market Volume Share (%), by Country 2024 & 2032
- Figure 7: Europe Non-Meat Ingredients Market Revenue (Million), by Country 2024 & 2032
- Figure 8: Europe Non-Meat Ingredients Market Volume (K Tons), by Country 2024 & 2032
- Figure 9: Europe Non-Meat Ingredients Market Revenue Share (%), by Country 2024 & 2032
- Figure 10: Europe Non-Meat Ingredients Market Volume Share (%), by Country 2024 & 2032
- Figure 11: Asia Pacific Non-Meat Ingredients Market Revenue (Million), by Country 2024 & 2032
- Figure 12: Asia Pacific Non-Meat Ingredients Market Volume (K Tons), by Country 2024 & 2032
- Figure 13: Asia Pacific Non-Meat Ingredients Market Revenue Share (%), by Country 2024 & 2032
- Figure 14: Asia Pacific Non-Meat Ingredients Market Volume Share (%), by Country 2024 & 2032
- Figure 15: South America Non-Meat Ingredients Market Revenue (Million), by Country 2024 & 2032
- Figure 16: South America Non-Meat Ingredients Market Volume (K Tons), by Country 2024 & 2032
- Figure 17: South America Non-Meat Ingredients Market Revenue Share (%), by Country 2024 & 2032
- Figure 18: South America Non-Meat Ingredients Market Volume Share (%), by Country 2024 & 2032
- Figure 19: North America Non-Meat Ingredients Market Revenue (Million), by Country 2024 & 2032
- Figure 20: North America Non-Meat Ingredients Market Volume (K Tons), by Country 2024 & 2032
- Figure 21: North America Non-Meat Ingredients Market Revenue Share (%), by Country 2024 & 2032
- Figure 22: North America Non-Meat Ingredients Market Volume Share (%), by Country 2024 & 2032
- Figure 23: MEA Non-Meat Ingredients Market Revenue (Million), by Country 2024 & 2032
- Figure 24: MEA Non-Meat Ingredients Market Volume (K Tons), by Country 2024 & 2032
- Figure 25: MEA Non-Meat Ingredients Market Revenue Share (%), by Country 2024 & 2032
- Figure 26: MEA Non-Meat Ingredients Market Volume Share (%), by Country 2024 & 2032
- Figure 27: North America Non-Meat Ingredients Market Revenue (Million), by Ingredient 2024 & 2032
- Figure 28: North America Non-Meat Ingredients Market Volume (K Tons), by Ingredient 2024 & 2032
- Figure 29: North America Non-Meat Ingredients Market Revenue Share (%), by Ingredient 2024 & 2032
- Figure 30: North America Non-Meat Ingredients Market Volume Share (%), by Ingredient 2024 & 2032
- Figure 31: North America Non-Meat Ingredients Market Revenue (Million), by Product Type 2024 & 2032
- Figure 32: North America Non-Meat Ingredients Market Volume (K Tons), by Product Type 2024 & 2032
- Figure 33: North America Non-Meat Ingredients Market Revenue Share (%), by Product Type 2024 & 2032
- Figure 34: North America Non-Meat Ingredients Market Volume Share (%), by Product Type 2024 & 2032
- Figure 35: North America Non-Meat Ingredients Market Revenue (Million), by Country 2024 & 2032
- Figure 36: North America Non-Meat Ingredients Market Volume (K Tons), by Country 2024 & 2032
- Figure 37: North America Non-Meat Ingredients Market Revenue Share (%), by Country 2024 & 2032
- Figure 38: North America Non-Meat Ingredients Market Volume Share (%), by Country 2024 & 2032
- Figure 39: Europe Non-Meat Ingredients Market Revenue (Million), by Ingredient 2024 & 2032
- Figure 40: Europe Non-Meat Ingredients Market Volume (K Tons), by Ingredient 2024 & 2032
- Figure 41: Europe Non-Meat Ingredients Market Revenue Share (%), by Ingredient 2024 & 2032
- Figure 42: Europe Non-Meat Ingredients Market Volume Share (%), by Ingredient 2024 & 2032
- Figure 43: Europe Non-Meat Ingredients Market Revenue (Million), by Product Type 2024 & 2032
- Figure 44: Europe Non-Meat Ingredients Market Volume (K Tons), by Product Type 2024 & 2032
- Figure 45: Europe Non-Meat Ingredients Market Revenue Share (%), by Product Type 2024 & 2032
- Figure 46: Europe Non-Meat Ingredients Market Volume Share (%), by Product Type 2024 & 2032
- Figure 47: Europe Non-Meat Ingredients Market Revenue (Million), by Country 2024 & 2032
- Figure 48: Europe Non-Meat Ingredients Market Volume (K Tons), by Country 2024 & 2032
- Figure 49: Europe Non-Meat Ingredients Market Revenue Share (%), by Country 2024 & 2032
- Figure 50: Europe Non-Meat Ingredients Market Volume Share (%), by Country 2024 & 2032
- Figure 51: Asia Pacific Non-Meat Ingredients Market Revenue (Million), by Ingredient 2024 & 2032
- Figure 52: Asia Pacific Non-Meat Ingredients Market Volume (K Tons), by Ingredient 2024 & 2032
- Figure 53: Asia Pacific Non-Meat Ingredients Market Revenue Share (%), by Ingredient 2024 & 2032
- Figure 54: Asia Pacific Non-Meat Ingredients Market Volume Share (%), by Ingredient 2024 & 2032
- Figure 55: Asia Pacific Non-Meat Ingredients Market Revenue (Million), by Product Type 2024 & 2032
- Figure 56: Asia Pacific Non-Meat Ingredients Market Volume (K Tons), by Product Type 2024 & 2032
- Figure 57: Asia Pacific Non-Meat Ingredients Market Revenue Share (%), by Product Type 2024 & 2032
- Figure 58: Asia Pacific Non-Meat Ingredients Market Volume Share (%), by Product Type 2024 & 2032
- Figure 59: Asia Pacific Non-Meat Ingredients Market Revenue (Million), by Country 2024 & 2032
- Figure 60: Asia Pacific Non-Meat Ingredients Market Volume (K Tons), by Country 2024 & 2032
- Figure 61: Asia Pacific Non-Meat Ingredients Market Revenue Share (%), by Country 2024 & 2032
- Figure 62: Asia Pacific Non-Meat Ingredients Market Volume Share (%), by Country 2024 & 2032
- Figure 63: Rest of the World Non-Meat Ingredients Market Revenue (Million), by Ingredient 2024 & 2032
- Figure 64: Rest of the World Non-Meat Ingredients Market Volume (K Tons), by Ingredient 2024 & 2032
- Figure 65: Rest of the World Non-Meat Ingredients Market Revenue Share (%), by Ingredient 2024 & 2032
- Figure 66: Rest of the World Non-Meat Ingredients Market Volume Share (%), by Ingredient 2024 & 2032
- Figure 67: Rest of the World Non-Meat Ingredients Market Revenue (Million), by Product Type 2024 & 2032
- Figure 68: Rest of the World Non-Meat Ingredients Market Volume (K Tons), by Product Type 2024 & 2032
- Figure 69: Rest of the World Non-Meat Ingredients Market Revenue Share (%), by Product Type 2024 & 2032
- Figure 70: Rest of the World Non-Meat Ingredients Market Volume Share (%), by Product Type 2024 & 2032
- Figure 71: Rest of the World Non-Meat Ingredients Market Revenue (Million), by Country 2024 & 2032
- Figure 72: Rest of the World Non-Meat Ingredients Market Volume (K Tons), by Country 2024 & 2032
- Figure 73: Rest of the World Non-Meat Ingredients Market Revenue Share (%), by Country 2024 & 2032
- Figure 74: Rest of the World Non-Meat Ingredients Market Volume Share (%), by Country 2024 & 2032
- Figure 75: Middle East Non-Meat Ingredients Market Revenue (Million), by Ingredient 2024 & 2032
- Figure 76: Middle East Non-Meat Ingredients Market Volume (K Tons), by Ingredient 2024 & 2032
- Figure 77: Middle East Non-Meat Ingredients Market Revenue Share (%), by Ingredient 2024 & 2032
- Figure 78: Middle East Non-Meat Ingredients Market Volume Share (%), by Ingredient 2024 & 2032
- Figure 79: Middle East Non-Meat Ingredients Market Revenue (Million), by Product Type 2024 & 2032
- Figure 80: Middle East Non-Meat Ingredients Market Volume (K Tons), by Product Type 2024 & 2032
- Figure 81: Middle East Non-Meat Ingredients Market Revenue Share (%), by Product Type 2024 & 2032
- Figure 82: Middle East Non-Meat Ingredients Market Volume Share (%), by Product Type 2024 & 2032
- Figure 83: Middle East Non-Meat Ingredients Market Revenue (Million), by Country 2024 & 2032
- Figure 84: Middle East Non-Meat Ingredients Market Volume (K Tons), by Country 2024 & 2032
- Figure 85: Middle East Non-Meat Ingredients Market Revenue Share (%), by Country 2024 & 2032
- Figure 86: Middle East Non-Meat Ingredients Market Volume Share (%), by Country 2024 & 2032
- Figure 87: South Africa Non-Meat Ingredients Market Revenue (Million), by Ingredient 2024 & 2032
- Figure 88: South Africa Non-Meat Ingredients Market Volume (K Tons), by Ingredient 2024 & 2032
- Figure 89: South Africa Non-Meat Ingredients Market Revenue Share (%), by Ingredient 2024 & 2032
- Figure 90: South Africa Non-Meat Ingredients Market Volume Share (%), by Ingredient 2024 & 2032
- Figure 91: South Africa Non-Meat Ingredients Market Revenue (Million), by Product Type 2024 & 2032
- Figure 92: South Africa Non-Meat Ingredients Market Volume (K Tons), by Product Type 2024 & 2032
- Figure 93: South Africa Non-Meat Ingredients Market Revenue Share (%), by Product Type 2024 & 2032
- Figure 94: South Africa Non-Meat Ingredients Market Volume Share (%), by Product Type 2024 & 2032
- Figure 95: South Africa Non-Meat Ingredients Market Revenue (Million), by Country 2024 & 2032
- Figure 96: South Africa Non-Meat Ingredients Market Volume (K Tons), by Country 2024 & 2032
- Figure 97: South Africa Non-Meat Ingredients Market Revenue Share (%), by Country 2024 & 2032
- Figure 98: South Africa Non-Meat Ingredients Market Volume Share (%), by Country 2024 & 2032
List of Tables
- Table 1: Global Non-Meat Ingredients Market Revenue Million Forecast, by Region 2019 & 2032
- Table 2: Global Non-Meat Ingredients Market Volume K Tons Forecast, by Region 2019 & 2032
- Table 3: Global Non-Meat Ingredients Market Revenue Million Forecast, by Ingredient 2019 & 2032
- Table 4: Global Non-Meat Ingredients Market Volume K Tons Forecast, by Ingredient 2019 & 2032
- Table 5: Global Non-Meat Ingredients Market Revenue Million Forecast, by Product Type 2019 & 2032
- Table 6: Global Non-Meat Ingredients Market Volume K Tons Forecast, by Product Type 2019 & 2032
- Table 7: Global Non-Meat Ingredients Market Revenue Million Forecast, by Region 2019 & 2032
- Table 8: Global Non-Meat Ingredients Market Volume K Tons Forecast, by Region 2019 & 2032
- Table 9: Global Non-Meat Ingredients Market Revenue Million Forecast, by Country 2019 & 2032
- Table 10: Global Non-Meat Ingredients Market Volume K Tons Forecast, by Country 2019 & 2032
- Table 11: United States Non-Meat Ingredients Market Revenue (Million) Forecast, by Application 2019 & 2032
- Table 12: United States Non-Meat Ingredients Market Volume (K Tons) Forecast, by Application 2019 & 2032
- Table 13: Canada Non-Meat Ingredients Market Revenue (Million) Forecast, by Application 2019 & 2032
- Table 14: Canada Non-Meat Ingredients Market Volume (K Tons) Forecast, by Application 2019 & 2032
- Table 15: Mexico Non-Meat Ingredients Market Revenue (Million) Forecast, by Application 2019 & 2032
- Table 16: Mexico Non-Meat Ingredients Market Volume (K Tons) Forecast, by Application 2019 & 2032
- Table 17: Global Non-Meat Ingredients Market Revenue Million Forecast, by Country 2019 & 2032
- Table 18: Global Non-Meat Ingredients Market Volume K Tons Forecast, by Country 2019 & 2032
- Table 19: Germany Non-Meat Ingredients Market Revenue (Million) Forecast, by Application 2019 & 2032
- Table 20: Germany Non-Meat Ingredients Market Volume (K Tons) Forecast, by Application 2019 & 2032
- Table 21: United Kingdom Non-Meat Ingredients Market Revenue (Million) Forecast, by Application 2019 & 2032
- Table 22: United Kingdom Non-Meat Ingredients Market Volume (K Tons) Forecast, by Application 2019 & 2032
- Table 23: France Non-Meat Ingredients Market Revenue (Million) Forecast, by Application 2019 & 2032
- Table 24: France Non-Meat Ingredients Market Volume (K Tons) Forecast, by Application 2019 & 2032
- Table 25: Spain Non-Meat Ingredients Market Revenue (Million) Forecast, by Application 2019 & 2032
- Table 26: Spain Non-Meat Ingredients Market Volume (K Tons) Forecast, by Application 2019 & 2032
- Table 27: Italy Non-Meat Ingredients Market Revenue (Million) Forecast, by Application 2019 & 2032
- Table 28: Italy Non-Meat Ingredients Market Volume (K Tons) Forecast, by Application 2019 & 2032
- Table 29: Spain Non-Meat Ingredients Market Revenue (Million) Forecast, by Application 2019 & 2032
- Table 30: Spain Non-Meat Ingredients Market Volume (K Tons) Forecast, by Application 2019 & 2032
- Table 31: Belgium Non-Meat Ingredients Market Revenue (Million) Forecast, by Application 2019 & 2032
- Table 32: Belgium Non-Meat Ingredients Market Volume (K Tons) Forecast, by Application 2019 & 2032
- Table 33: Netherland Non-Meat Ingredients Market Revenue (Million) Forecast, by Application 2019 & 2032
- Table 34: Netherland Non-Meat Ingredients Market Volume (K Tons) Forecast, by Application 2019 & 2032
- Table 35: Nordics Non-Meat Ingredients Market Revenue (Million) Forecast, by Application 2019 & 2032
- Table 36: Nordics Non-Meat Ingredients Market Volume (K Tons) Forecast, by Application 2019 & 2032
- Table 37: Rest of Europe Non-Meat Ingredients Market Revenue (Million) Forecast, by Application 2019 & 2032
- Table 38: Rest of Europe Non-Meat Ingredients Market Volume (K Tons) Forecast, by Application 2019 & 2032
- Table 39: Global Non-Meat Ingredients Market Revenue Million Forecast, by Country 2019 & 2032
- Table 40: Global Non-Meat Ingredients Market Volume K Tons Forecast, by Country 2019 & 2032
- Table 41: China Non-Meat Ingredients Market Revenue (Million) Forecast, by Application 2019 & 2032
- Table 42: China Non-Meat Ingredients Market Volume (K Tons) Forecast, by Application 2019 & 2032
- Table 43: Japan Non-Meat Ingredients Market Revenue (Million) Forecast, by Application 2019 & 2032
- Table 44: Japan Non-Meat Ingredients Market Volume (K Tons) Forecast, by Application 2019 & 2032
- Table 45: India Non-Meat Ingredients Market Revenue (Million) Forecast, by Application 2019 & 2032
- Table 46: India Non-Meat Ingredients Market Volume (K Tons) Forecast, by Application 2019 & 2032
- Table 47: South Korea Non-Meat Ingredients Market Revenue (Million) Forecast, by Application 2019 & 2032
- Table 48: South Korea Non-Meat Ingredients Market Volume (K Tons) Forecast, by Application 2019 & 2032
- Table 49: Southeast Asia Non-Meat Ingredients Market Revenue (Million) Forecast, by Application 2019 & 2032
- Table 50: Southeast Asia Non-Meat Ingredients Market Volume (K Tons) Forecast, by Application 2019 & 2032
- Table 51: Australia Non-Meat Ingredients Market Revenue (Million) Forecast, by Application 2019 & 2032
- Table 52: Australia Non-Meat Ingredients Market Volume (K Tons) Forecast, by Application 2019 & 2032
- Table 53: Indonesia Non-Meat Ingredients Market Revenue (Million) Forecast, by Application 2019 & 2032
- Table 54: Indonesia Non-Meat Ingredients Market Volume (K Tons) Forecast, by Application 2019 & 2032
- Table 55: Phillipes Non-Meat Ingredients Market Revenue (Million) Forecast, by Application 2019 & 2032
- Table 56: Phillipes Non-Meat Ingredients Market Volume (K Tons) Forecast, by Application 2019 & 2032
- Table 57: Singapore Non-Meat Ingredients Market Revenue (Million) Forecast, by Application 2019 & 2032
- Table 58: Singapore Non-Meat Ingredients Market Volume (K Tons) Forecast, by Application 2019 & 2032
- Table 59: Thailandc Non-Meat Ingredients Market Revenue (Million) Forecast, by Application 2019 & 2032
- Table 60: Thailandc Non-Meat Ingredients Market Volume (K Tons) Forecast, by Application 2019 & 2032
- Table 61: Rest of Asia Pacific Non-Meat Ingredients Market Revenue (Million) Forecast, by Application 2019 & 2032
- Table 62: Rest of Asia Pacific Non-Meat Ingredients Market Volume (K Tons) Forecast, by Application 2019 & 2032
- Table 63: Global Non-Meat Ingredients Market Revenue Million Forecast, by Country 2019 & 2032
- Table 64: Global Non-Meat Ingredients Market Volume K Tons Forecast, by Country 2019 & 2032
- Table 65: Brazil Non-Meat Ingredients Market Revenue (Million) Forecast, by Application 2019 & 2032
- Table 66: Brazil Non-Meat Ingredients Market Volume (K Tons) Forecast, by Application 2019 & 2032
- Table 67: Argentina Non-Meat Ingredients Market Revenue (Million) Forecast, by Application 2019 & 2032
- Table 68: Argentina Non-Meat Ingredients Market Volume (K Tons) Forecast, by Application 2019 & 2032
- Table 69: Peru Non-Meat Ingredients Market Revenue (Million) Forecast, by Application 2019 & 2032
- Table 70: Peru Non-Meat Ingredients Market Volume (K Tons) Forecast, by Application 2019 & 2032
- Table 71: Chile Non-Meat Ingredients Market Revenue (Million) Forecast, by Application 2019 & 2032
- Table 72: Chile Non-Meat Ingredients Market Volume (K Tons) Forecast, by Application 2019 & 2032
- Table 73: Colombia Non-Meat Ingredients Market Revenue (Million) Forecast, by Application 2019 & 2032
- Table 74: Colombia Non-Meat Ingredients Market Volume (K Tons) Forecast, by Application 2019 & 2032
- Table 75: Ecuador Non-Meat Ingredients Market Revenue (Million) Forecast, by Application 2019 & 2032
- Table 76: Ecuador Non-Meat Ingredients Market Volume (K Tons) Forecast, by Application 2019 & 2032
- Table 77: Venezuela Non-Meat Ingredients Market Revenue (Million) Forecast, by Application 2019 & 2032
- Table 78: Venezuela Non-Meat Ingredients Market Volume (K Tons) Forecast, by Application 2019 & 2032
- Table 79: Rest of South America Non-Meat Ingredients Market Revenue (Million) Forecast, by Application 2019 & 2032
- Table 80: Rest of South America Non-Meat Ingredients Market Volume (K Tons) Forecast, by Application 2019 & 2032
- Table 81: Global Non-Meat Ingredients Market Revenue Million Forecast, by Country 2019 & 2032
- Table 82: Global Non-Meat Ingredients Market Volume K Tons Forecast, by Country 2019 & 2032
- Table 83: United States Non-Meat Ingredients Market Revenue (Million) Forecast, by Application 2019 & 2032
- Table 84: United States Non-Meat Ingredients Market Volume (K Tons) Forecast, by Application 2019 & 2032
- Table 85: Canada Non-Meat Ingredients Market Revenue (Million) Forecast, by Application 2019 & 2032
- Table 86: Canada Non-Meat Ingredients Market Volume (K Tons) Forecast, by Application 2019 & 2032
- Table 87: Mexico Non-Meat Ingredients Market Revenue (Million) Forecast, by Application 2019 & 2032
- Table 88: Mexico Non-Meat Ingredients Market Volume (K Tons) Forecast, by Application 2019 & 2032
- Table 89: Global Non-Meat Ingredients Market Revenue Million Forecast, by Country 2019 & 2032
- Table 90: Global Non-Meat Ingredients Market Volume K Tons Forecast, by Country 2019 & 2032
- Table 91: United Arab Emirates Non-Meat Ingredients Market Revenue (Million) Forecast, by Application 2019 & 2032
- Table 92: United Arab Emirates Non-Meat Ingredients Market Volume (K Tons) Forecast, by Application 2019 & 2032
- Table 93: Saudi Arabia Non-Meat Ingredients Market Revenue (Million) Forecast, by Application 2019 & 2032
- Table 94: Saudi Arabia Non-Meat Ingredients Market Volume (K Tons) Forecast, by Application 2019 & 2032
- Table 95: South Africa Non-Meat Ingredients Market Revenue (Million) Forecast, by Application 2019 & 2032
- Table 96: South Africa Non-Meat Ingredients Market Volume (K Tons) Forecast, by Application 2019 & 2032
- Table 97: Rest of Middle East and Africa Non-Meat Ingredients Market Revenue (Million) Forecast, by Application 2019 & 2032
- Table 98: Rest of Middle East and Africa Non-Meat Ingredients Market Volume (K Tons) Forecast, by Application 2019 & 2032
- Table 99: Global Non-Meat Ingredients Market Revenue Million Forecast, by Ingredient 2019 & 2032
- Table 100: Global Non-Meat Ingredients Market Volume K Tons Forecast, by Ingredient 2019 & 2032
- Table 101: Global Non-Meat Ingredients Market Revenue Million Forecast, by Product Type 2019 & 2032
- Table 102: Global Non-Meat Ingredients Market Volume K Tons Forecast, by Product Type 2019 & 2032
- Table 103: Global Non-Meat Ingredients Market Revenue Million Forecast, by Country 2019 & 2032
- Table 104: Global Non-Meat Ingredients Market Volume K Tons Forecast, by Country 2019 & 2032
- Table 105: United States Non-Meat Ingredients Market Revenue (Million) Forecast, by Application 2019 & 2032
- Table 106: United States Non-Meat Ingredients Market Volume (K Tons) Forecast, by Application 2019 & 2032
- Table 107: Canada Non-Meat Ingredients Market Revenue (Million) Forecast, by Application 2019 & 2032
- Table 108: Canada Non-Meat Ingredients Market Volume (K Tons) Forecast, by Application 2019 & 2032
- Table 109: Mexico Non-Meat Ingredients Market Revenue (Million) Forecast, by Application 2019 & 2032
- Table 110: Mexico Non-Meat Ingredients Market Volume (K Tons) Forecast, by Application 2019 & 2032
- Table 111: Rest of North America Non-Meat Ingredients Market Revenue (Million) Forecast, by Application 2019 & 2032
- Table 112: Rest of North America Non-Meat Ingredients Market Volume (K Tons) Forecast, by Application 2019 & 2032
- Table 113: Global Non-Meat Ingredients Market Revenue Million Forecast, by Ingredient 2019 & 2032
- Table 114: Global Non-Meat Ingredients Market Volume K Tons Forecast, by Ingredient 2019 & 2032
- Table 115: Global Non-Meat Ingredients Market Revenue Million Forecast, by Product Type 2019 & 2032
- Table 116: Global Non-Meat Ingredients Market Volume K Tons Forecast, by Product Type 2019 & 2032
- Table 117: Global Non-Meat Ingredients Market Revenue Million Forecast, by Country 2019 & 2032
- Table 118: Global Non-Meat Ingredients Market Volume K Tons Forecast, by Country 2019 & 2032
- Table 119: Spain Non-Meat Ingredients Market Revenue (Million) Forecast, by Application 2019 & 2032
- Table 120: Spain Non-Meat Ingredients Market Volume (K Tons) Forecast, by Application 2019 & 2032
- Table 121: United Kingdom Non-Meat Ingredients Market Revenue (Million) Forecast, by Application 2019 & 2032
- Table 122: United Kingdom Non-Meat Ingredients Market Volume (K Tons) Forecast, by Application 2019 & 2032
- Table 123: Germany Non-Meat Ingredients Market Revenue (Million) Forecast, by Application 2019 & 2032
- Table 124: Germany Non-Meat Ingredients Market Volume (K Tons) Forecast, by Application 2019 & 2032
- Table 125: France Non-Meat Ingredients Market Revenue (Million) Forecast, by Application 2019 & 2032
- Table 126: France Non-Meat Ingredients Market Volume (K Tons) Forecast, by Application 2019 & 2032
- Table 127: Italy Non-Meat Ingredients Market Revenue (Million) Forecast, by Application 2019 & 2032
- Table 128: Italy Non-Meat Ingredients Market Volume (K Tons) Forecast, by Application 2019 & 2032
- Table 129: Rest of Europe Non-Meat Ingredients Market Revenue (Million) Forecast, by Application 2019 & 2032
- Table 130: Rest of Europe Non-Meat Ingredients Market Volume (K Tons) Forecast, by Application 2019 & 2032
- Table 131: Global Non-Meat Ingredients Market Revenue Million Forecast, by Ingredient 2019 & 2032
- Table 132: Global Non-Meat Ingredients Market Volume K Tons Forecast, by Ingredient 2019 & 2032
- Table 133: Global Non-Meat Ingredients Market Revenue Million Forecast, by Product Type 2019 & 2032
- Table 134: Global Non-Meat Ingredients Market Volume K Tons Forecast, by Product Type 2019 & 2032
- Table 135: Global Non-Meat Ingredients Market Revenue Million Forecast, by Country 2019 & 2032
- Table 136: Global Non-Meat Ingredients Market Volume K Tons Forecast, by Country 2019 & 2032
- Table 137: China Non-Meat Ingredients Market Revenue (Million) Forecast, by Application 2019 & 2032
- Table 138: China Non-Meat Ingredients Market Volume (K Tons) Forecast, by Application 2019 & 2032
- Table 139: Japan Non-Meat Ingredients Market Revenue (Million) Forecast, by Application 2019 & 2032
- Table 140: Japan Non-Meat Ingredients Market Volume (K Tons) Forecast, by Application 2019 & 2032
- Table 141: India Non-Meat Ingredients Market Revenue (Million) Forecast, by Application 2019 & 2032
- Table 142: India Non-Meat Ingredients Market Volume (K Tons) Forecast, by Application 2019 & 2032
- Table 143: Australia Non-Meat Ingredients Market Revenue (Million) Forecast, by Application 2019 & 2032
- Table 144: Australia Non-Meat Ingredients Market Volume (K Tons) Forecast, by Application 2019 & 2032
- Table 145: Rest of Asia Pacific Non-Meat Ingredients Market Revenue (Million) Forecast, by Application 2019 & 2032
- Table 146: Rest of Asia Pacific Non-Meat Ingredients Market Volume (K Tons) Forecast, by Application 2019 & 2032
- Table 147: Global Non-Meat Ingredients Market Revenue Million Forecast, by Ingredient 2019 & 2032
- Table 148: Global Non-Meat Ingredients Market Volume K Tons Forecast, by Ingredient 2019 & 2032
- Table 149: Global Non-Meat Ingredients Market Revenue Million Forecast, by Product Type 2019 & 2032
- Table 150: Global Non-Meat Ingredients Market Volume K Tons Forecast, by Product Type 2019 & 2032
- Table 151: Global Non-Meat Ingredients Market Revenue Million Forecast, by Country 2019 & 2032
- Table 152: Global Non-Meat Ingredients Market Volume K Tons Forecast, by Country 2019 & 2032
- Table 153: Brazil Non-Meat Ingredients Market Revenue (Million) Forecast, by Application 2019 & 2032
- Table 154: Brazil Non-Meat Ingredients Market Volume (K Tons) Forecast, by Application 2019 & 2032
- Table 155: Argentina Non-Meat Ingredients Market Revenue (Million) Forecast, by Application 2019 & 2032
- Table 156: Argentina Non-Meat Ingredients Market Volume (K Tons) Forecast, by Application 2019 & 2032
- Table 157: Others Non-Meat Ingredients Market Revenue (Million) Forecast, by Application 2019 & 2032
- Table 158: Others Non-Meat Ingredients Market Volume (K Tons) Forecast, by Application 2019 & 2032
- Table 159: Global Non-Meat Ingredients Market Revenue Million Forecast, by Ingredient 2019 & 2032
- Table 160: Global Non-Meat Ingredients Market Volume K Tons Forecast, by Ingredient 2019 & 2032
- Table 161: Global Non-Meat Ingredients Market Revenue Million Forecast, by Product Type 2019 & 2032
- Table 162: Global Non-Meat Ingredients Market Volume K Tons Forecast, by Product Type 2019 & 2032
- Table 163: Global Non-Meat Ingredients Market Revenue Million Forecast, by Country 2019 & 2032
- Table 164: Global Non-Meat Ingredients Market Volume K Tons Forecast, by Country 2019 & 2032
- Table 165: Global Non-Meat Ingredients Market Revenue Million Forecast, by Ingredient 2019 & 2032
- Table 166: Global Non-Meat Ingredients Market Volume K Tons Forecast, by Ingredient 2019 & 2032
- Table 167: Global Non-Meat Ingredients Market Revenue Million Forecast, by Product Type 2019 & 2032
- Table 168: Global Non-Meat Ingredients Market Volume K Tons Forecast, by Product Type 2019 & 2032
- Table 169: Global Non-Meat Ingredients Market Revenue Million Forecast, by Country 2019 & 2032
- Table 170: Global Non-Meat Ingredients Market Volume K Tons Forecast, by Country 2019 & 2032
- Table 171: Saudi Arabia Non-Meat Ingredients Market Revenue (Million) Forecast, by Application 2019 & 2032
- Table 172: Saudi Arabia Non-Meat Ingredients Market Volume (K Tons) Forecast, by Application 2019 & 2032
- Table 173: Rest of Middle East Non-Meat Ingredients Market Revenue (Million) Forecast, by Application 2019 & 2032
- Table 174: Rest of Middle East Non-Meat Ingredients Market Volume (K Tons) Forecast, by Application 2019 & 2032
Frequently Asked Questions
1. What is the projected Compound Annual Growth Rate (CAGR) of the Non-Meat Ingredients Market?
The projected CAGR is approximately 3.90%.
2. Which companies are prominent players in the Non-Meat Ingredients Market?
Key companies in the market include Advanced Food Systems Inc, DuPont de Nemours Inc, Archer Daniels Midland Company, Associated British Foods plc, BASF SE, Kerry Group PLC, Ingredion Incorporated, Koninklijke Dsm N V, Cargill Incorporated , Roquette Frères.
3. What are the main segments of the Non-Meat Ingredients Market?
The market segments include Ingredient, Product Type.
4. Can you provide details about the market size?
The market size is estimated to be USD 40930 Million as of 2022.
5. What are some drivers contributing to market growth?
Growing Health and Fitness Consciousness Among Japanese; Increasing Demand for Meat Analogues.
6. What are the notable trends driving market growth?
Increasing Consumption of Meat Snacks.
7. Are there any restraints impacting market growth?
Higher Production Costs and Limited Capacities.
8. Can you provide examples of recent developments in the market?
N/A
9. What pricing options are available for accessing the report?
Pricing options include single-user, multi-user, and enterprise licenses priced at USD 4750, USD 5250, and USD 8750 respectively.
10. Is the market size provided in terms of value or volume?
The market size is provided in terms of value, measured in Million and volume, measured in K Tons.
11. Are there any specific market keywords associated with the report?
Yes, the market keyword associated with the report is "Non-Meat Ingredients Market," which aids in identifying and referencing the specific market segment covered.
12. How do I determine which pricing option suits my needs best?
The pricing options vary based on user requirements and access needs. Individual users may opt for single-user licenses, while businesses requiring broader access may choose multi-user or enterprise licenses for cost-effective access to the report.
13. Are there any additional resources or data provided in the Non-Meat Ingredients Market report?
While the report offers comprehensive insights, it's advisable to review the specific contents or supplementary materials provided to ascertain if additional resources or data are available.
14. How can I stay updated on further developments or reports in the Non-Meat Ingredients Market?
To stay informed about further developments, trends, and reports in the Non-Meat Ingredients Market, consider subscribing to industry newsletters, following relevant companies and organizations, or regularly checking reputable industry news sources and publications.
Methodology
Step 1 - Identification of Relevant Samples Size from Population Database


Step 2 - Approaches for Defining Global Market Size (Value, Volume* & Price*)

Note*: In applicable scenarios
Step 3 - Data Sources
Primary Research
- Web Analytics
- Survey Reports
- Research Institute
- Latest Research Reports
- Opinion Leaders
Secondary Research
- Annual Reports
- White Paper
- Latest Press Release
- Industry Association
- Paid Database
- Investor Presentations

Step 4 - Data Triangulation
Involves using different sources of information in order to increase the validity of a study
These sources are likely to be stakeholders in a program - participants, other researchers, program staff, other community members, and so on.
Then we put all data in single framework & apply various statistical tools to find out the dynamic on the market.
During the analysis stage, feedback from the stakeholder groups would be compared to determine areas of agreement as well as areas of divergence


