
Key Insights
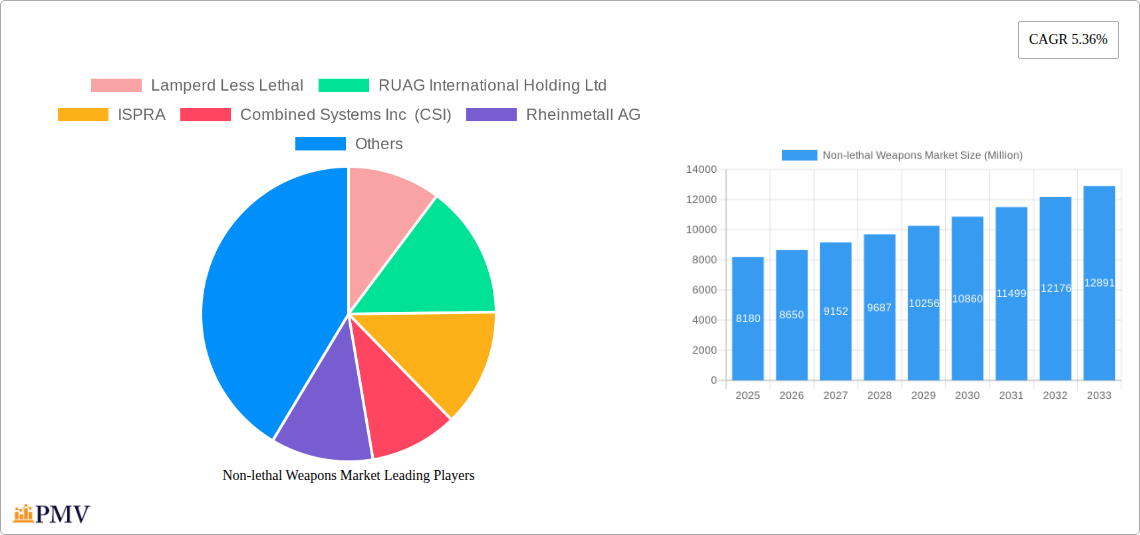
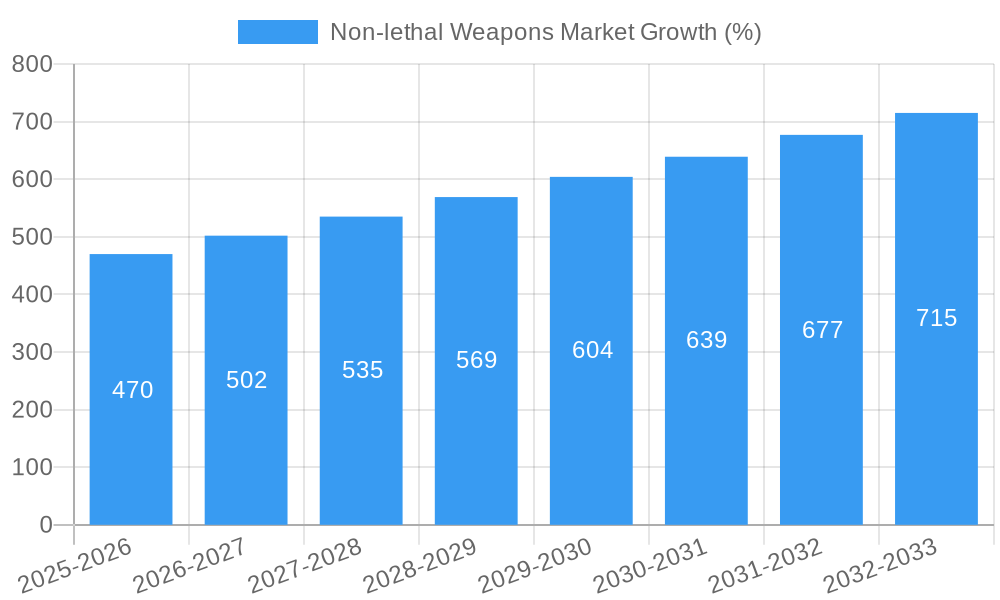
The non-lethal weapons market, valued at $8.18 billion in 2025, is projected to experience robust growth, driven by increasing demand for crowd control solutions and a global shift towards less-lethal alternatives in law enforcement and military operations. The market's Compound Annual Growth Rate (CAGR) of 5.36% from 2025 to 2033 indicates a steady expansion, fueled by technological advancements in less-lethal technologies, such as improved accuracy and effectiveness of directed energy weapons and electroshock devices. The rising adoption of advanced training programs for personnel handling these weapons further contributes to market growth. Significant growth is expected from the law enforcement segment, driven by escalating urban crime rates and the need for effective non-lethal crowd control solutions that minimize collateral damage. The Anti-personnel segment, encompassing ammunition, sponge grenades, and sting grenades, is a major contributor to the overall market value, owing to widespread usage by both military and law enforcement agencies. Furthermore, increasing geopolitical instability in several regions will lead to a surge in demand for less-lethal weapons in order to de-escalate conflicts and minimize casualties.
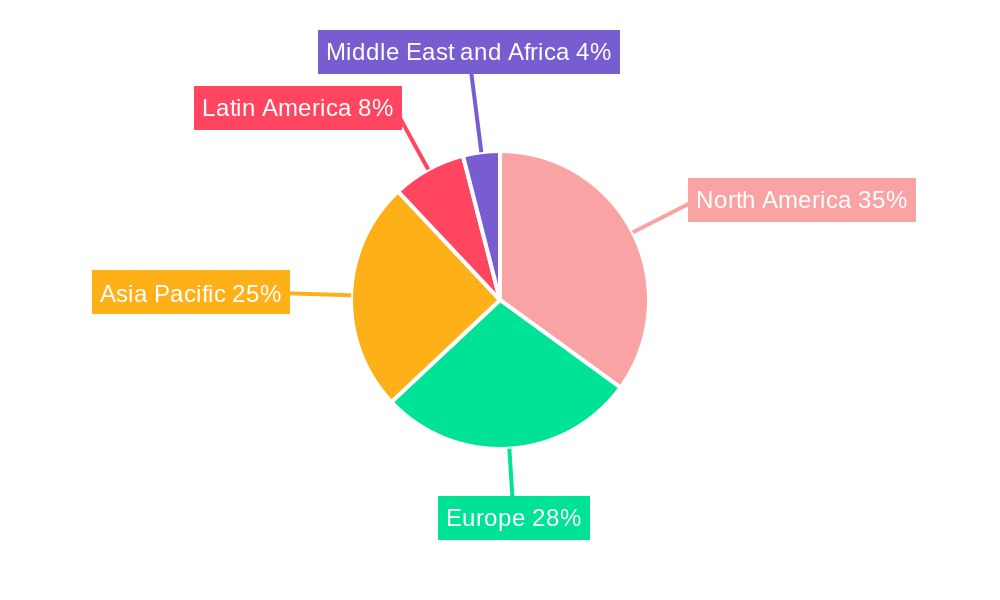
Despite the positive outlook, the market faces certain challenges. Stringent regulations surrounding the production, distribution, and usage of non-lethal weapons vary across regions, acting as a potential restraint on market expansion. Concerns over the potential for misuse and ethical implications also pose challenges. However, technological innovation is expected to mitigate some of these concerns, leading to safer and more precise weapons. The market segmentation reveals significant opportunities in various regions, especially North America, and Europe, and growing demand from Asia-Pacific countries due to rising urbanization and crime rates. Companies such as Axon Enterprise, Rheinmetall AG, and others are actively engaged in research and development, introducing advanced less-lethal weapons with enhanced capabilities, which will continue to propel market growth in the coming years.
Non-lethal Weapons Market: A Comprehensive Report (2019-2033)
This comprehensive report provides an in-depth analysis of the Non-lethal Weapons Market, offering valuable insights into market dynamics, competitive landscape, and future growth prospects. Covering the period from 2019 to 2033, with a focus on 2025, this report is an essential resource for industry professionals, investors, and researchers seeking a thorough understanding of this evolving sector. The market is projected to reach xx Million by 2033, exhibiting a CAGR of xx% during the forecast period (2025-2033).
Non-lethal Weapons Market Market Structure & Competitive Dynamics
The Non-lethal Weapons Market is characterized by a moderately concentrated structure, with several key players holding significant market share. The market is witnessing increased innovation driven by advancements in directed energy weapons and less-lethal ammunition. Regulatory frameworks vary across regions, influencing product adoption and market penetration. Product substitution is limited, with most non-lethal weapon types serving distinct needs. End-user trends indicate a growing preference for less-lethal alternatives, particularly within law enforcement and military applications. Mergers and acquisitions (M&A) activity has been moderate, with deal values averaging xx Million in recent years. Key M&A activities include (examples only, specific details require further research): Company A acquiring Company B for xx Million.
- Market Concentration: Moderately Concentrated (Herfindahl-Hirschman Index (HHI): xx)
- Innovation Ecosystem: Active, with focus on directed energy weapons and improved ammunition.
- Regulatory Frameworks: Vary by region, impacting market access.
- Product Substitutes: Limited, with niche overlaps.
- End-User Trends: Growing preference for less-lethal options.
- M&A Activity: Moderate, with average deal values of xx Million.
Non-lethal Weapons Market Industry Trends & Insights
The Non-lethal Weapons Market is experiencing robust growth driven by several factors. Increasing demand from law enforcement agencies for less-lethal crowd control measures is a primary driver. The rising adoption of non-lethal weapons by military forces for peacekeeping operations and urban warfare also fuels market expansion. Technological advancements in directed energy weapons (DEWs), such as lasers and acoustic devices, are creating new market opportunities. The increasing preference for less-lethal alternatives over traditional firearms due to concerns regarding collateral damage and human rights is another significant trend. Consumer preferences are shifting towards more precise, effective, and safer non-lethal options. Competitive dynamics are intensifying, with companies focusing on product differentiation and innovation to gain a competitive edge. The market penetration of non-lethal weapons continues to rise, particularly in developed regions.
Dominant Markets & Segments in Non-lethal Weapons Market
The North American region currently holds the largest market share, driven by strong demand from law enforcement and military sectors. Within the product segments, anti-personnel ammunition, pepper spray, and electroshock weapons demonstrate strong growth. Law enforcement remains the dominant application segment, followed by the military sector.
- Leading Region: North America
- Key Drivers for North American Dominance:
- Strong law enforcement and military budgets.
- Advanced technological infrastructure.
- Favorable regulatory environment (relatively speaking).
- Leading Product Segment: Anti-personnel Ammunition, high demand from various sectors.
- Leading Application Segment: Law Enforcement, due to increasing need for crowd control and de-escalation tools.
Non-lethal Weapons Market Product Innovations
Recent advancements have centered around improved accuracy, range, and effectiveness of less-lethal munitions. The integration of smart technologies, such as GPS tracking and data analytics, is enhancing the capabilities of non-lethal weapons systems. Companies are focusing on developing more humane and ethically sound non-lethal technologies that minimize the risk of injury. This includes the development of less-lethal alternatives to traditional firearm projectiles, such as rubber bullets and sponge grenades.
Report Segmentation & Scope
This report segments the non-lethal weapons market by type (Area Denial, Anti-personnel Ammunition, Sponge Grenades, Sting Grenades, Pepper Spray, Directed Energy Weapons, Electroshock Weapons) and application (Law Enforcement, Military). Each segment's growth projections, market size, and competitive landscape are analyzed in detail. For instance, the Anti-personnel Ammunition segment is expected to show significant growth driven by increasing demand from military and law enforcement agencies. The Law Enforcement application segment is projected to grow at a higher CAGR due to the widespread adoption of non-lethal weapons for riot control and crowd management.
Key Drivers of Non-lethal Weapons Market Growth
Several factors drive market growth, including the rising demand for safer alternatives to lethal force, increasing budgets for law enforcement and military agencies, and technological advancements leading to improved weapon efficacy and safety. Government regulations mandating the use of non-lethal weapons in specific situations further contribute to market expansion.
Challenges in the Non-lethal Weapons Market Sector
The Non-lethal Weapons Market faces challenges including stringent regulatory approvals for new technologies, potential supply chain disruptions affecting the availability of raw materials, and increasing competition from both established and emerging players. Furthermore, concerns regarding the ethical use of non-lethal weapons and potential for misuse can create market limitations. These factors combined impact the overall market growth and expansion.
Leading Players in the Non-lethal Weapons Market Market
- Lamperd Less Lethal
- RUAG International Holding Ltd
- ISPRIA
- Combined Systems Inc (CSI)
- Rheinmetall AG
- Byrna Technologies Inc
- CONDOR TECNOLOGIAS Não LETALIS
- AMTEC Less-Lethal Systems Inc
- NonLethal Technologies Inc
- RTX Corporation
- Fiocchi Munizioni S p A
- Zarc International Inc
- Axon Enterprise Inc
- UTS United Tactical Systems LLC (Pepperball)
- Herstal Group
- Safariland LLC
Key Developments in Non-lethal Weapons Market Sector
- May 2023: The Republic of Singapore Navy's (RSN's) Sentinel-class vessels are equipped with Sitep Italia's MASS system, signifying increased adoption of advanced non-lethal technologies in maritime security.
- January 2022: KWESST Micro Systems Inc. launches the Para Ops Low Energy Cartridge System, marking a significant advancement in personal defense and law enforcement technology.
Strategic Non-lethal Weapons Market Market Outlook
The future of the Non-lethal Weapons Market looks promising, driven by continued technological innovation, rising demand from various sectors, and increasing government support. Strategic opportunities lie in developing advanced DEW systems, expanding into new geographical markets, and fostering collaborations to improve product effectiveness and safety. The market's growth trajectory is expected to remain strong, offering attractive opportunities for established players and new entrants alike.
Non-lethal Weapons Market Segmentation
-
1. Type
-
1.1. Area Denial
- 1.1.1. Anti-vehicle
- 1.1.2. Anti-personnel
-
1.2. Ammunition
- 1.2.1. Rubber Bullets
- 1.2.2. Wax Bullets
- 1.2.3. Plastic Bullets
- 1.2.4. Bean Bag Rounds
- 1.2.5. Sponge Grenade
-
1.3. Explosives
- 1.3.1. Flash Bang Grenades
- 1.3.2. Sting Grenades
-
1.4. Gases and Sprays
- 1.4.1. Water Cannons
- 1.4.2. Scent-based Weapons
- 1.4.3. Teargas
- 1.4.4. Pepper Spray
- 1.5. Directed Energy Weapons
- 1.6. Electroshock Weapons
-
1.1. Area Denial
-
2. Application
- 2.1. Law Enforcement
- 2.2. Military
Non-lethal Weapons Market Segmentation By Geography
-
1. North America
- 1.1. United States
- 1.2. Canada
-
2. Europe
- 2.1. United Kingdom
- 2.2. Germany
- 2.3. France
- 2.4. Rest of Europe
-
3. Asia Pacific
- 3.1. China
- 3.2. India
- 3.3. Japan
- 3.4. South Korea
- 3.5. Rest of Asia Pacific
-
4. Latin America
- 4.1. Brazil
- 4.2. Mexico
- 4.3. Rest of Latin America
-
5. Middle East and Africa
- 5.1. United Arab Emirates
- 5.2. Saudi Arabia
- 5.3. Egypt
- 5.4. Qatar
- 5.5. Rest of Middle East and Africa
Non-lethal Weapons Market REPORT HIGHLIGHTS
| Aspects | Details |
|---|---|
| Study Period | 2019-2033 |
| Base Year | 2024 |
| Estimated Year | 2025 |
| Forecast Period | 2025-2033 |
| Historical Period | 2019-2024 |
| Growth Rate | CAGR of 5.36% from 2019-2033 |
| Segmentation |
|
Table of Contents
- 1. Introduction
- 1.1. Research Scope
- 1.2. Market Segmentation
- 1.3. Research Methodology
- 1.4. Definitions and Assumptions
- 2. Executive Summary
- 2.1. Introduction
- 3. Market Dynamics
- 3.1. Introduction
- 3.2. Market Drivers
- 3.3. Market Restrains
- 3.4. Market Trends
- 3.4.1. Military Segment is Anticipated to Grow with the Highest CAGR During the Forecast Period
- 4. Market Factor Analysis
- 4.1. Porters Five Forces
- 4.2. Supply/Value Chain
- 4.3. PESTEL analysis
- 4.4. Market Entropy
- 4.5. Patent/Trademark Analysis
- 5. Global Non-lethal Weapons Market Analysis, Insights and Forecast, 2019-2031
- 5.1. Market Analysis, Insights and Forecast - by Type
- 5.1.1. Area Denial
- 5.1.1.1. Anti-vehicle
- 5.1.1.2. Anti-personnel
- 5.1.2. Ammunition
- 5.1.2.1. Rubber Bullets
- 5.1.2.2. Wax Bullets
- 5.1.2.3. Plastic Bullets
- 5.1.2.4. Bean Bag Rounds
- 5.1.2.5. Sponge Grenade
- 5.1.3. Explosives
- 5.1.3.1. Flash Bang Grenades
- 5.1.3.2. Sting Grenades
- 5.1.4. Gases and Sprays
- 5.1.4.1. Water Cannons
- 5.1.4.2. Scent-based Weapons
- 5.1.4.3. Teargas
- 5.1.4.4. Pepper Spray
- 5.1.5. Directed Energy Weapons
- 5.1.6. Electroshock Weapons
- 5.1.1. Area Denial
- 5.2. Market Analysis, Insights and Forecast - by Application
- 5.2.1. Law Enforcement
- 5.2.2. Military
- 5.3. Market Analysis, Insights and Forecast - by Region
- 5.3.1. North America
- 5.3.2. Europe
- 5.3.3. Asia Pacific
- 5.3.4. Latin America
- 5.3.5. Middle East and Africa
- 5.1. Market Analysis, Insights and Forecast - by Type
- 6. North America Non-lethal Weapons Market Analysis, Insights and Forecast, 2019-2031
- 6.1. Market Analysis, Insights and Forecast - by Type
- 6.1.1. Area Denial
- 6.1.1.1. Anti-vehicle
- 6.1.1.2. Anti-personnel
- 6.1.2. Ammunition
- 6.1.2.1. Rubber Bullets
- 6.1.2.2. Wax Bullets
- 6.1.2.3. Plastic Bullets
- 6.1.2.4. Bean Bag Rounds
- 6.1.2.5. Sponge Grenade
- 6.1.3. Explosives
- 6.1.3.1. Flash Bang Grenades
- 6.1.3.2. Sting Grenades
- 6.1.4. Gases and Sprays
- 6.1.4.1. Water Cannons
- 6.1.4.2. Scent-based Weapons
- 6.1.4.3. Teargas
- 6.1.4.4. Pepper Spray
- 6.1.5. Directed Energy Weapons
- 6.1.6. Electroshock Weapons
- 6.1.1. Area Denial
- 6.2. Market Analysis, Insights and Forecast - by Application
- 6.2.1. Law Enforcement
- 6.2.2. Military
- 6.1. Market Analysis, Insights and Forecast - by Type
- 7. Europe Non-lethal Weapons Market Analysis, Insights and Forecast, 2019-2031
- 7.1. Market Analysis, Insights and Forecast - by Type
- 7.1.1. Area Denial
- 7.1.1.1. Anti-vehicle
- 7.1.1.2. Anti-personnel
- 7.1.2. Ammunition
- 7.1.2.1. Rubber Bullets
- 7.1.2.2. Wax Bullets
- 7.1.2.3. Plastic Bullets
- 7.1.2.4. Bean Bag Rounds
- 7.1.2.5. Sponge Grenade
- 7.1.3. Explosives
- 7.1.3.1. Flash Bang Grenades
- 7.1.3.2. Sting Grenades
- 7.1.4. Gases and Sprays
- 7.1.4.1. Water Cannons
- 7.1.4.2. Scent-based Weapons
- 7.1.4.3. Teargas
- 7.1.4.4. Pepper Spray
- 7.1.5. Directed Energy Weapons
- 7.1.6. Electroshock Weapons
- 7.1.1. Area Denial
- 7.2. Market Analysis, Insights and Forecast - by Application
- 7.2.1. Law Enforcement
- 7.2.2. Military
- 7.1. Market Analysis, Insights and Forecast - by Type
- 8. Asia Pacific Non-lethal Weapons Market Analysis, Insights and Forecast, 2019-2031
- 8.1. Market Analysis, Insights and Forecast - by Type
- 8.1.1. Area Denial
- 8.1.1.1. Anti-vehicle
- 8.1.1.2. Anti-personnel
- 8.1.2. Ammunition
- 8.1.2.1. Rubber Bullets
- 8.1.2.2. Wax Bullets
- 8.1.2.3. Plastic Bullets
- 8.1.2.4. Bean Bag Rounds
- 8.1.2.5. Sponge Grenade
- 8.1.3. Explosives
- 8.1.3.1. Flash Bang Grenades
- 8.1.3.2. Sting Grenades
- 8.1.4. Gases and Sprays
- 8.1.4.1. Water Cannons
- 8.1.4.2. Scent-based Weapons
- 8.1.4.3. Teargas
- 8.1.4.4. Pepper Spray
- 8.1.5. Directed Energy Weapons
- 8.1.6. Electroshock Weapons
- 8.1.1. Area Denial
- 8.2. Market Analysis, Insights and Forecast - by Application
- 8.2.1. Law Enforcement
- 8.2.2. Military
- 8.1. Market Analysis, Insights and Forecast - by Type
- 9. Latin America Non-lethal Weapons Market Analysis, Insights and Forecast, 2019-2031
- 9.1. Market Analysis, Insights and Forecast - by Type
- 9.1.1. Area Denial
- 9.1.1.1. Anti-vehicle
- 9.1.1.2. Anti-personnel
- 9.1.2. Ammunition
- 9.1.2.1. Rubber Bullets
- 9.1.2.2. Wax Bullets
- 9.1.2.3. Plastic Bullets
- 9.1.2.4. Bean Bag Rounds
- 9.1.2.5. Sponge Grenade
- 9.1.3. Explosives
- 9.1.3.1. Flash Bang Grenades
- 9.1.3.2. Sting Grenades
- 9.1.4. Gases and Sprays
- 9.1.4.1. Water Cannons
- 9.1.4.2. Scent-based Weapons
- 9.1.4.3. Teargas
- 9.1.4.4. Pepper Spray
- 9.1.5. Directed Energy Weapons
- 9.1.6. Electroshock Weapons
- 9.1.1. Area Denial
- 9.2. Market Analysis, Insights and Forecast - by Application
- 9.2.1. Law Enforcement
- 9.2.2. Military
- 9.1. Market Analysis, Insights and Forecast - by Type
- 10. Middle East and Africa Non-lethal Weapons Market Analysis, Insights and Forecast, 2019-2031
- 10.1. Market Analysis, Insights and Forecast - by Type
- 10.1.1. Area Denial
- 10.1.1.1. Anti-vehicle
- 10.1.1.2. Anti-personnel
- 10.1.2. Ammunition
- 10.1.2.1. Rubber Bullets
- 10.1.2.2. Wax Bullets
- 10.1.2.3. Plastic Bullets
- 10.1.2.4. Bean Bag Rounds
- 10.1.2.5. Sponge Grenade
- 10.1.3. Explosives
- 10.1.3.1. Flash Bang Grenades
- 10.1.3.2. Sting Grenades
- 10.1.4. Gases and Sprays
- 10.1.4.1. Water Cannons
- 10.1.4.2. Scent-based Weapons
- 10.1.4.3. Teargas
- 10.1.4.4. Pepper Spray
- 10.1.5. Directed Energy Weapons
- 10.1.6. Electroshock Weapons
- 10.1.1. Area Denial
- 10.2. Market Analysis, Insights and Forecast - by Application
- 10.2.1. Law Enforcement
- 10.2.2. Military
- 10.1. Market Analysis, Insights and Forecast - by Type
- 11. North America Non-lethal Weapons Market Analysis, Insights and Forecast, 2019-2031
- 11.1. Market Analysis, Insights and Forecast - By Country/Sub-region
- 11.1.1 United States
- 11.1.2 Canada
- 12. Europe Non-lethal Weapons Market Analysis, Insights and Forecast, 2019-2031
- 12.1. Market Analysis, Insights and Forecast - By Country/Sub-region
- 12.1.1 United Kingdom
- 12.1.2 Germany
- 12.1.3 France
- 12.1.4 Rest of Europe
- 13. Asia Pacific Non-lethal Weapons Market Analysis, Insights and Forecast, 2019-2031
- 13.1. Market Analysis, Insights and Forecast - By Country/Sub-region
- 13.1.1 China
- 13.1.2 India
- 13.1.3 Japan
- 13.1.4 South Korea
- 13.1.5 Rest of Asia Pacific
- 14. Latin America Non-lethal Weapons Market Analysis, Insights and Forecast, 2019-2031
- 14.1. Market Analysis, Insights and Forecast - By Country/Sub-region
- 14.1.1 Brazil
- 14.1.2 Mexico
- 14.1.3 Rest of Latin America
- 15. Middle East and Africa Non-lethal Weapons Market Analysis, Insights and Forecast, 2019-2031
- 15.1. Market Analysis, Insights and Forecast - By Country/Sub-region
- 15.1.1 United Arab Emirates
- 15.1.2 Saudi Arabia
- 15.1.3 Egypt
- 15.1.4 Qatar
- 15.1.5 Rest of Middle East and Africa
- 16. Competitive Analysis
- 16.1. Global Market Share Analysis 2024
- 16.2. Company Profiles
- 16.2.1 Lamperd Less Lethal
- 16.2.1.1. Overview
- 16.2.1.2. Products
- 16.2.1.3. SWOT Analysis
- 16.2.1.4. Recent Developments
- 16.2.1.5. Financials (Based on Availability)
- 16.2.2 RUAG International Holding Ltd
- 16.2.2.1. Overview
- 16.2.2.2. Products
- 16.2.2.3. SWOT Analysis
- 16.2.2.4. Recent Developments
- 16.2.2.5. Financials (Based on Availability)
- 16.2.3 ISPRA
- 16.2.3.1. Overview
- 16.2.3.2. Products
- 16.2.3.3. SWOT Analysis
- 16.2.3.4. Recent Developments
- 16.2.3.5. Financials (Based on Availability)
- 16.2.4 Combined Systems Inc (CSI)
- 16.2.4.1. Overview
- 16.2.4.2. Products
- 16.2.4.3. SWOT Analysis
- 16.2.4.4. Recent Developments
- 16.2.4.5. Financials (Based on Availability)
- 16.2.5 Rheinmetall AG
- 16.2.5.1. Overview
- 16.2.5.2. Products
- 16.2.5.3. SWOT Analysis
- 16.2.5.4. Recent Developments
- 16.2.5.5. Financials (Based on Availability)
- 16.2.6 Byrna Technologies Inc
- 16.2.6.1. Overview
- 16.2.6.2. Products
- 16.2.6.3. SWOT Analysis
- 16.2.6.4. Recent Developments
- 16.2.6.5. Financials (Based on Availability)
- 16.2.7 CONDOR TECNOLOGIAS Não LETALIS
- 16.2.7.1. Overview
- 16.2.7.2. Products
- 16.2.7.3. SWOT Analysis
- 16.2.7.4. Recent Developments
- 16.2.7.5. Financials (Based on Availability)
- 16.2.8 AMTEC Less-Lethal Systems Inc
- 16.2.8.1. Overview
- 16.2.8.2. Products
- 16.2.8.3. SWOT Analysis
- 16.2.8.4. Recent Developments
- 16.2.8.5. Financials (Based on Availability)
- 16.2.9 NonLethal Technologies Inc
- 16.2.9.1. Overview
- 16.2.9.2. Products
- 16.2.9.3. SWOT Analysis
- 16.2.9.4. Recent Developments
- 16.2.9.5. Financials (Based on Availability)
- 16.2.10 RTX Corporation
- 16.2.10.1. Overview
- 16.2.10.2. Products
- 16.2.10.3. SWOT Analysis
- 16.2.10.4. Recent Developments
- 16.2.10.5. Financials (Based on Availability)
- 16.2.11 Fiocchi Munizioni S p A
- 16.2.11.1. Overview
- 16.2.11.2. Products
- 16.2.11.3. SWOT Analysis
- 16.2.11.4. Recent Developments
- 16.2.11.5. Financials (Based on Availability)
- 16.2.12 Zarc International Inc
- 16.2.12.1. Overview
- 16.2.12.2. Products
- 16.2.12.3. SWOT Analysis
- 16.2.12.4. Recent Developments
- 16.2.12.5. Financials (Based on Availability)
- 16.2.13 Axon Enterprise Inc
- 16.2.13.1. Overview
- 16.2.13.2. Products
- 16.2.13.3. SWOT Analysis
- 16.2.13.4. Recent Developments
- 16.2.13.5. Financials (Based on Availability)
- 16.2.14 UTS United Tactical Systems LLC (Pepperball)
- 16.2.14.1. Overview
- 16.2.14.2. Products
- 16.2.14.3. SWOT Analysis
- 16.2.14.4. Recent Developments
- 16.2.14.5. Financials (Based on Availability)
- 16.2.15 Herstal Group
- 16.2.15.1. Overview
- 16.2.15.2. Products
- 16.2.15.3. SWOT Analysis
- 16.2.15.4. Recent Developments
- 16.2.15.5. Financials (Based on Availability)
- 16.2.16 Safariland LLC
- 16.2.16.1. Overview
- 16.2.16.2. Products
- 16.2.16.3. SWOT Analysis
- 16.2.16.4. Recent Developments
- 16.2.16.5. Financials (Based on Availability)
- 16.2.1 Lamperd Less Lethal
List of Figures
- Figure 1: Global Non-lethal Weapons Market Revenue Breakdown (Million, %) by Region 2024 & 2032
- Figure 2: North America Non-lethal Weapons Market Revenue (Million), by Country 2024 & 2032
- Figure 3: North America Non-lethal Weapons Market Revenue Share (%), by Country 2024 & 2032
- Figure 4: Europe Non-lethal Weapons Market Revenue (Million), by Country 2024 & 2032
- Figure 5: Europe Non-lethal Weapons Market Revenue Share (%), by Country 2024 & 2032
- Figure 6: Asia Pacific Non-lethal Weapons Market Revenue (Million), by Country 2024 & 2032
- Figure 7: Asia Pacific Non-lethal Weapons Market Revenue Share (%), by Country 2024 & 2032
- Figure 8: Latin America Non-lethal Weapons Market Revenue (Million), by Country 2024 & 2032
- Figure 9: Latin America Non-lethal Weapons Market Revenue Share (%), by Country 2024 & 2032
- Figure 10: Middle East and Africa Non-lethal Weapons Market Revenue (Million), by Country 2024 & 2032
- Figure 11: Middle East and Africa Non-lethal Weapons Market Revenue Share (%), by Country 2024 & 2032
- Figure 12: North America Non-lethal Weapons Market Revenue (Million), by Type 2024 & 2032
- Figure 13: North America Non-lethal Weapons Market Revenue Share (%), by Type 2024 & 2032
- Figure 14: North America Non-lethal Weapons Market Revenue (Million), by Application 2024 & 2032
- Figure 15: North America Non-lethal Weapons Market Revenue Share (%), by Application 2024 & 2032
- Figure 16: North America Non-lethal Weapons Market Revenue (Million), by Country 2024 & 2032
- Figure 17: North America Non-lethal Weapons Market Revenue Share (%), by Country 2024 & 2032
- Figure 18: Europe Non-lethal Weapons Market Revenue (Million), by Type 2024 & 2032
- Figure 19: Europe Non-lethal Weapons Market Revenue Share (%), by Type 2024 & 2032
- Figure 20: Europe Non-lethal Weapons Market Revenue (Million), by Application 2024 & 2032
- Figure 21: Europe Non-lethal Weapons Market Revenue Share (%), by Application 2024 & 2032
- Figure 22: Europe Non-lethal Weapons Market Revenue (Million), by Country 2024 & 2032
- Figure 23: Europe Non-lethal Weapons Market Revenue Share (%), by Country 2024 & 2032
- Figure 24: Asia Pacific Non-lethal Weapons Market Revenue (Million), by Type 2024 & 2032
- Figure 25: Asia Pacific Non-lethal Weapons Market Revenue Share (%), by Type 2024 & 2032
- Figure 26: Asia Pacific Non-lethal Weapons Market Revenue (Million), by Application 2024 & 2032
- Figure 27: Asia Pacific Non-lethal Weapons Market Revenue Share (%), by Application 2024 & 2032
- Figure 28: Asia Pacific Non-lethal Weapons Market Revenue (Million), by Country 2024 & 2032
- Figure 29: Asia Pacific Non-lethal Weapons Market Revenue Share (%), by Country 2024 & 2032
- Figure 30: Latin America Non-lethal Weapons Market Revenue (Million), by Type 2024 & 2032
- Figure 31: Latin America Non-lethal Weapons Market Revenue Share (%), by Type 2024 & 2032
- Figure 32: Latin America Non-lethal Weapons Market Revenue (Million), by Application 2024 & 2032
- Figure 33: Latin America Non-lethal Weapons Market Revenue Share (%), by Application 2024 & 2032
- Figure 34: Latin America Non-lethal Weapons Market Revenue (Million), by Country 2024 & 2032
- Figure 35: Latin America Non-lethal Weapons Market Revenue Share (%), by Country 2024 & 2032
- Figure 36: Middle East and Africa Non-lethal Weapons Market Revenue (Million), by Type 2024 & 2032
- Figure 37: Middle East and Africa Non-lethal Weapons Market Revenue Share (%), by Type 2024 & 2032
- Figure 38: Middle East and Africa Non-lethal Weapons Market Revenue (Million), by Application 2024 & 2032
- Figure 39: Middle East and Africa Non-lethal Weapons Market Revenue Share (%), by Application 2024 & 2032
- Figure 40: Middle East and Africa Non-lethal Weapons Market Revenue (Million), by Country 2024 & 2032
- Figure 41: Middle East and Africa Non-lethal Weapons Market Revenue Share (%), by Country 2024 & 2032
List of Tables
- Table 1: Global Non-lethal Weapons Market Revenue Million Forecast, by Region 2019 & 2032
- Table 2: Global Non-lethal Weapons Market Revenue Million Forecast, by Type 2019 & 2032
- Table 3: Global Non-lethal Weapons Market Revenue Million Forecast, by Application 2019 & 2032
- Table 4: Global Non-lethal Weapons Market Revenue Million Forecast, by Region 2019 & 2032
- Table 5: Global Non-lethal Weapons Market Revenue Million Forecast, by Country 2019 & 2032
- Table 6: United States Non-lethal Weapons Market Revenue (Million) Forecast, by Application 2019 & 2032
- Table 7: Canada Non-lethal Weapons Market Revenue (Million) Forecast, by Application 2019 & 2032
- Table 8: Global Non-lethal Weapons Market Revenue Million Forecast, by Country 2019 & 2032
- Table 9: United Kingdom Non-lethal Weapons Market Revenue (Million) Forecast, by Application 2019 & 2032
- Table 10: Germany Non-lethal Weapons Market Revenue (Million) Forecast, by Application 2019 & 2032
- Table 11: France Non-lethal Weapons Market Revenue (Million) Forecast, by Application 2019 & 2032
- Table 12: Rest of Europe Non-lethal Weapons Market Revenue (Million) Forecast, by Application 2019 & 2032
- Table 13: Global Non-lethal Weapons Market Revenue Million Forecast, by Country 2019 & 2032
- Table 14: China Non-lethal Weapons Market Revenue (Million) Forecast, by Application 2019 & 2032
- Table 15: India Non-lethal Weapons Market Revenue (Million) Forecast, by Application 2019 & 2032
- Table 16: Japan Non-lethal Weapons Market Revenue (Million) Forecast, by Application 2019 & 2032
- Table 17: South Korea Non-lethal Weapons Market Revenue (Million) Forecast, by Application 2019 & 2032
- Table 18: Rest of Asia Pacific Non-lethal Weapons Market Revenue (Million) Forecast, by Application 2019 & 2032
- Table 19: Global Non-lethal Weapons Market Revenue Million Forecast, by Country 2019 & 2032
- Table 20: Brazil Non-lethal Weapons Market Revenue (Million) Forecast, by Application 2019 & 2032
- Table 21: Mexico Non-lethal Weapons Market Revenue (Million) Forecast, by Application 2019 & 2032
- Table 22: Rest of Latin America Non-lethal Weapons Market Revenue (Million) Forecast, by Application 2019 & 2032
- Table 23: Global Non-lethal Weapons Market Revenue Million Forecast, by Country 2019 & 2032
- Table 24: United Arab Emirates Non-lethal Weapons Market Revenue (Million) Forecast, by Application 2019 & 2032
- Table 25: Saudi Arabia Non-lethal Weapons Market Revenue (Million) Forecast, by Application 2019 & 2032
- Table 26: Egypt Non-lethal Weapons Market Revenue (Million) Forecast, by Application 2019 & 2032
- Table 27: Qatar Non-lethal Weapons Market Revenue (Million) Forecast, by Application 2019 & 2032
- Table 28: Rest of Middle East and Africa Non-lethal Weapons Market Revenue (Million) Forecast, by Application 2019 & 2032
- Table 29: Global Non-lethal Weapons Market Revenue Million Forecast, by Type 2019 & 2032
- Table 30: Global Non-lethal Weapons Market Revenue Million Forecast, by Application 2019 & 2032
- Table 31: Global Non-lethal Weapons Market Revenue Million Forecast, by Country 2019 & 2032
- Table 32: United States Non-lethal Weapons Market Revenue (Million) Forecast, by Application 2019 & 2032
- Table 33: Canada Non-lethal Weapons Market Revenue (Million) Forecast, by Application 2019 & 2032
- Table 34: Global Non-lethal Weapons Market Revenue Million Forecast, by Type 2019 & 2032
- Table 35: Global Non-lethal Weapons Market Revenue Million Forecast, by Application 2019 & 2032
- Table 36: Global Non-lethal Weapons Market Revenue Million Forecast, by Country 2019 & 2032
- Table 37: United Kingdom Non-lethal Weapons Market Revenue (Million) Forecast, by Application 2019 & 2032
- Table 38: Germany Non-lethal Weapons Market Revenue (Million) Forecast, by Application 2019 & 2032
- Table 39: France Non-lethal Weapons Market Revenue (Million) Forecast, by Application 2019 & 2032
- Table 40: Rest of Europe Non-lethal Weapons Market Revenue (Million) Forecast, by Application 2019 & 2032
- Table 41: Global Non-lethal Weapons Market Revenue Million Forecast, by Type 2019 & 2032
- Table 42: Global Non-lethal Weapons Market Revenue Million Forecast, by Application 2019 & 2032
- Table 43: Global Non-lethal Weapons Market Revenue Million Forecast, by Country 2019 & 2032
- Table 44: China Non-lethal Weapons Market Revenue (Million) Forecast, by Application 2019 & 2032
- Table 45: India Non-lethal Weapons Market Revenue (Million) Forecast, by Application 2019 & 2032
- Table 46: Japan Non-lethal Weapons Market Revenue (Million) Forecast, by Application 2019 & 2032
- Table 47: South Korea Non-lethal Weapons Market Revenue (Million) Forecast, by Application 2019 & 2032
- Table 48: Rest of Asia Pacific Non-lethal Weapons Market Revenue (Million) Forecast, by Application 2019 & 2032
- Table 49: Global Non-lethal Weapons Market Revenue Million Forecast, by Type 2019 & 2032
- Table 50: Global Non-lethal Weapons Market Revenue Million Forecast, by Application 2019 & 2032
- Table 51: Global Non-lethal Weapons Market Revenue Million Forecast, by Country 2019 & 2032
- Table 52: Brazil Non-lethal Weapons Market Revenue (Million) Forecast, by Application 2019 & 2032
- Table 53: Mexico Non-lethal Weapons Market Revenue (Million) Forecast, by Application 2019 & 2032
- Table 54: Rest of Latin America Non-lethal Weapons Market Revenue (Million) Forecast, by Application 2019 & 2032
- Table 55: Global Non-lethal Weapons Market Revenue Million Forecast, by Type 2019 & 2032
- Table 56: Global Non-lethal Weapons Market Revenue Million Forecast, by Application 2019 & 2032
- Table 57: Global Non-lethal Weapons Market Revenue Million Forecast, by Country 2019 & 2032
- Table 58: United Arab Emirates Non-lethal Weapons Market Revenue (Million) Forecast, by Application 2019 & 2032
- Table 59: Saudi Arabia Non-lethal Weapons Market Revenue (Million) Forecast, by Application 2019 & 2032
- Table 60: Egypt Non-lethal Weapons Market Revenue (Million) Forecast, by Application 2019 & 2032
- Table 61: Qatar Non-lethal Weapons Market Revenue (Million) Forecast, by Application 2019 & 2032
- Table 62: Rest of Middle East and Africa Non-lethal Weapons Market Revenue (Million) Forecast, by Application 2019 & 2032
Frequently Asked Questions
1. What is the projected Compound Annual Growth Rate (CAGR) of the Non-lethal Weapons Market?
The projected CAGR is approximately 5.36%.
2. Which companies are prominent players in the Non-lethal Weapons Market?
Key companies in the market include Lamperd Less Lethal, RUAG International Holding Ltd, ISPRA, Combined Systems Inc (CSI), Rheinmetall AG, Byrna Technologies Inc, CONDOR TECNOLOGIAS Não LETALIS, AMTEC Less-Lethal Systems Inc, NonLethal Technologies Inc, RTX Corporation, Fiocchi Munizioni S p A, Zarc International Inc, Axon Enterprise Inc, UTS United Tactical Systems LLC (Pepperball), Herstal Group, Safariland LLC.
3. What are the main segments of the Non-lethal Weapons Market?
The market segments include Type, Application.
4. Can you provide details about the market size?
The market size is estimated to be USD 8.18 Million as of 2022.
5. What are some drivers contributing to market growth?
N/A
6. What are the notable trends driving market growth?
Military Segment is Anticipated to Grow with the Highest CAGR During the Forecast Period.
7. Are there any restraints impacting market growth?
N/A
8. Can you provide examples of recent developments in the market?
May 2023: The Republic of Singapore Navy's (RSN's) Sentinel-class maritime security and response vessels (MSRVs) announced that they are being equipped with Sitep Italia's multirole acoustic stabilized system (MASS). Moreover, the system will be installed across all four vessels in the Sentinel class.
9. What pricing options are available for accessing the report?
Pricing options include single-user, multi-user, and enterprise licenses priced at USD 4750, USD 5250, and USD 8750 respectively.
10. Is the market size provided in terms of value or volume?
The market size is provided in terms of value, measured in Million.
11. Are there any specific market keywords associated with the report?
Yes, the market keyword associated with the report is "Non-lethal Weapons Market," which aids in identifying and referencing the specific market segment covered.
12. How do I determine which pricing option suits my needs best?
The pricing options vary based on user requirements and access needs. Individual users may opt for single-user licenses, while businesses requiring broader access may choose multi-user or enterprise licenses for cost-effective access to the report.
13. Are there any additional resources or data provided in the Non-lethal Weapons Market report?
While the report offers comprehensive insights, it's advisable to review the specific contents or supplementary materials provided to ascertain if additional resources or data are available.
14. How can I stay updated on further developments or reports in the Non-lethal Weapons Market?
To stay informed about further developments, trends, and reports in the Non-lethal Weapons Market, consider subscribing to industry newsletters, following relevant companies and organizations, or regularly checking reputable industry news sources and publications.
Methodology
Step 1 - Identification of Relevant Samples Size from Population Database


Step 2 - Approaches for Defining Global Market Size (Value, Volume* & Price*)

Note*: In applicable scenarios
Step 3 - Data Sources
Primary Research
- Web Analytics
- Survey Reports
- Research Institute
- Latest Research Reports
- Opinion Leaders
Secondary Research
- Annual Reports
- White Paper
- Latest Press Release
- Industry Association
- Paid Database
- Investor Presentations

Step 4 - Data Triangulation
Involves using different sources of information in order to increase the validity of a study
These sources are likely to be stakeholders in a program - participants, other researchers, program staff, other community members, and so on.
Then we put all data in single framework & apply various statistical tools to find out the dynamic on the market.
During the analysis stage, feedback from the stakeholder groups would be compared to determine areas of agreement as well as areas of divergence


