
Key Insights
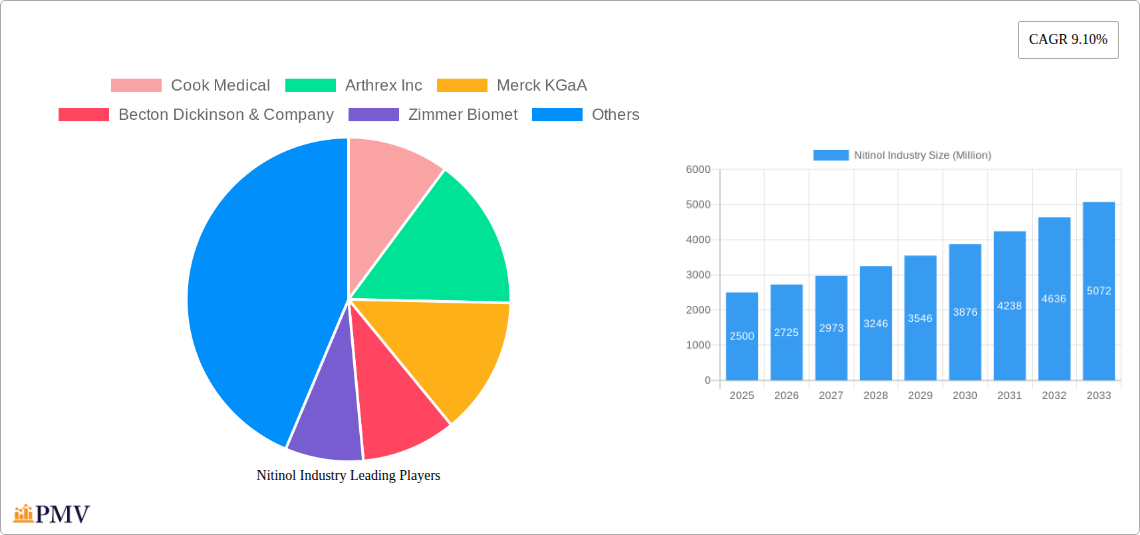
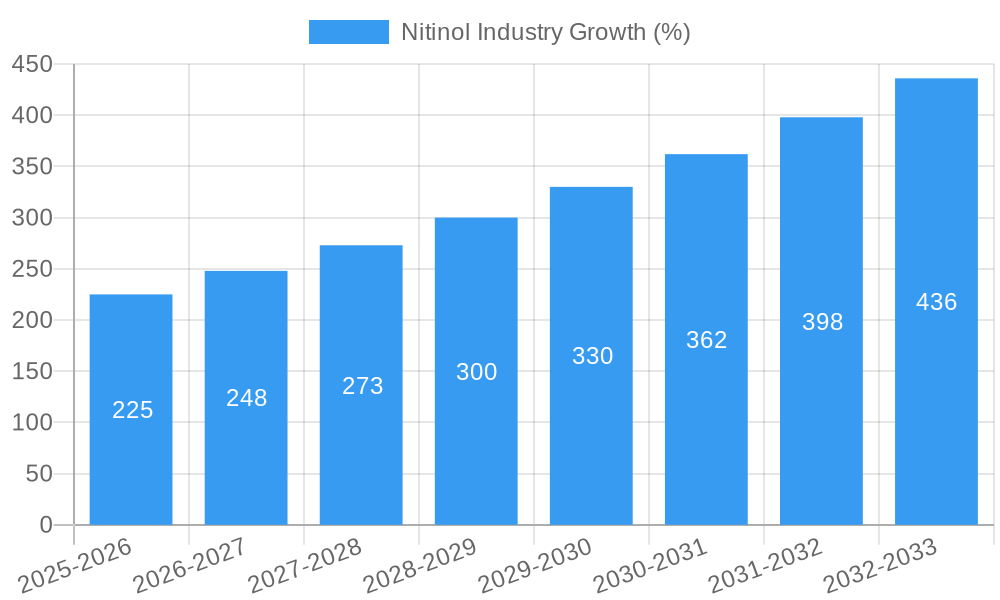
The Nitinol medical device market, encompassing stents, baskets, guidewires, and other products across cardiovascular, urology, dentistry, and other applications, is experiencing robust growth. Driven by an aging global population, increasing prevalence of cardiovascular diseases, and advancements in minimally invasive surgical techniques, the market is projected to maintain a Compound Annual Growth Rate (CAGR) of 9.10% from 2025 to 2033. Key players like Cook Medical, Arthrex Inc., and Boston Scientific Corporation are leveraging technological innovations to develop superior Nitinol-based devices, contributing to this expansion. The cardiovascular application segment currently dominates the market due to the widespread use of Nitinol stents in coronary interventions and peripheral vascular procedures. However, growing demand for minimally invasive urological and dental procedures is fostering growth in these segments. Geographic expansion, particularly in rapidly developing economies of Asia-Pacific, further fuels market expansion. While challenges exist, such as high initial investment costs associated with advanced Nitinol manufacturing and potential regulatory hurdles, the overall market outlook remains positive, driven by the significant clinical benefits of Nitinol's biocompatibility and shape memory properties.
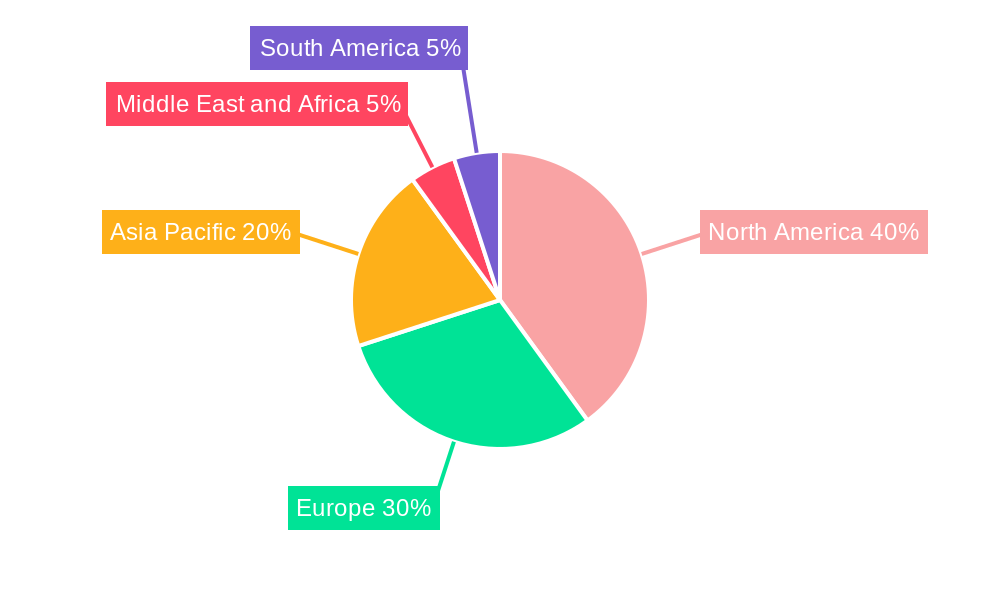
The North American region currently holds the largest market share, owing to advanced healthcare infrastructure and high adoption rates of minimally invasive procedures. However, Europe and Asia-Pacific are expected to witness significant growth in the coming years due to increasing healthcare expenditure and rising awareness about minimally invasive treatments. Competition among established players is intense, with companies focusing on product differentiation, strategic partnerships, and mergers & acquisitions to enhance market position. Future growth will likely be influenced by ongoing research and development efforts focusing on improved device design, enhanced biocompatibility, and the exploration of new applications for Nitinol in the medical field. The development of smart stents with drug-eluting capabilities is also expected to drive significant growth in the coming years.
Nitinol Industry Market Report: 2019-2033
This comprehensive report provides a detailed analysis of the global Nitinol industry, offering valuable insights into market dynamics, competitive landscapes, and future growth prospects. The study period spans from 2019 to 2033, with a base year of 2025 and a forecast period from 2025 to 2033. The report covers a market valued at over $XX Million and analyzes key segments and players driving this significant industry.
Nitinol Industry Market Structure & Competitive Dynamics
The Nitinol industry is characterized by a moderately concentrated market structure, with several major players holding significant market share. Cook Medical, Arthrex Inc, Merck KGaA, Becton Dickinson & Company, Zimmer Biomet, Terumo Corporation, EndoSmart GmbH, W L Gore & Associate Inc, Boston Scientific Corporation, and B Braun SE are among the key competitors. The market share of these companies varies considerably, with some holding over 10% and others holding smaller percentages. The overall industry is driven by innovation, with significant investment in R&D leading to the development of new products and applications. Regulatory frameworks, particularly within the medical device sector, heavily influence market access and product development. The industry also faces competition from substitute materials, requiring constant innovation to maintain a competitive edge.
Mergers and acquisitions (M&A) play a significant role in shaping the competitive landscape. Recent transactions, like Alleima's acquisition of Endosmart in November 2022 (valued at $XX Million), highlight the strategic importance of expanding product portfolios and technological capabilities. These acquisitions often lead to significant shifts in market share and competitive dynamics. The average M&A deal value in the Nitinol industry within the studied period was approximately $XX Million.
Nitinol Industry Industry Trends & Insights
The Nitinol industry is experiencing robust growth, driven by increasing demand across various applications. The Compound Annual Growth Rate (CAGR) during the forecast period (2025-2033) is projected to be XX%. This growth is fueled by several factors, including advancements in minimally invasive surgical techniques, rising prevalence of chronic diseases requiring medical intervention, and the unique properties of Nitinol that make it ideal for medical devices. Technological disruptions, such as the development of biocompatible Nitinol alloys and improved manufacturing processes, are further boosting market expansion. Consumer preferences are shifting towards less invasive procedures and better patient outcomes, driving demand for sophisticated Nitinol-based medical devices. Market penetration in key application areas, particularly cardiovascular and urology, continues to rise, further contributing to overall market growth. Intense competition among leading players also contributes to innovation and market expansion.
Dominant Markets & Segments in Nitinol Industry
The global Nitinol market is dominated by the Cardiovascular segment in terms of both value and volume, representing approximately XX% of the total market. This is driven by the increasing prevalence of cardiovascular diseases, the suitability of Nitinol for stents and other cardiovascular devices, and the high cost of these procedures. Within the product types, Stents hold the largest market share, driven by high demand and a steady stream of innovation.
- Key Drivers for Cardiovascular dominance:
- High prevalence of cardiovascular diseases.
- Increasing adoption of minimally invasive procedures.
- Technological advancements in stent design and materials.
- Favorable reimbursement policies in developed economies.
- Key Drivers for Stents dominance:
- High demand for cardiovascular treatments.
- Technological innovations leading to improved efficacy and safety.
- Growing preference for less invasive procedures.
- High profitability compared to other product types.
The North American region holds a significant market share due to the high adoption rate of advanced medical technologies and the strong presence of key players.
Nitinol Industry Product Innovations
Recent years have witnessed significant innovation in Nitinol-based products, focusing on improved biocompatibility, enhanced shape memory properties, and miniaturization of devices. This includes the development of new alloys with enhanced corrosion resistance, surface modifications for improved tissue integration, and advanced manufacturing techniques allowing for complex shapes and intricate designs. These innovations are directly translating into improved clinical outcomes, increased patient comfort, and better market fit, particularly in areas like minimally invasive surgery and targeted drug delivery.
Report Segmentation & Scope
This report segments the Nitinol market based on product type (Stents, Baskets, Guidewires, Other Products) and application (Cardiovascular, Urology, Dentistry, Other Applications). Each segment presents unique growth projections, market sizes, and competitive dynamics. The Cardiovascular segment is currently the largest, expected to maintain its leadership throughout the forecast period, while Urology and Dentistry segments show substantial growth potential due to increased applications of Nitinol in these areas. "Other Products" and "Other Applications" represent emerging markets with considerable future growth potential driven by innovation and expanded applications.
Key Drivers of Nitinol Industry Growth
The Nitinol industry's growth is driven by several key factors: Technological advancements resulting in improved product performance and efficacy, increased prevalence of chronic diseases leading to higher demand for minimally invasive procedures, favorable regulatory environment encouraging innovation and adoption, and growing investments in research and development focusing on improved material properties and new applications. Increased healthcare spending, particularly in developing economies, also contributes significantly to market growth.
Challenges in the Nitinol Industry Sector
The Nitinol industry faces challenges such as stringent regulatory requirements for medical devices, potential supply chain disruptions affecting raw material availability, and intense competition from existing and emerging players. These factors can impact production costs, product availability, and profitability. Furthermore, the price sensitivity of certain markets might constrain overall market growth.
Leading Players in the Nitinol Industry Market
- Cook Medical
- Arthrex Inc
- Merck KGaA
- Becton Dickinson & Company
- Zimmer Biomet
- Terumo Corporation
- EndoSmart GmbH
- W L Gore & Associate Inc
- Boston Scientific Corporation
- B Braun SE
Key Developments in Nitinol Industry Sector
- November 2022: Alleima acquired Endosmart Gesellschaft für Medizintechnik GmbH (Endosmart), expanding its portfolio of Nitinol-based medical devices. This acquisition significantly impacted the competitive landscape and strengthened Alleima's position in the market.
- May 2022: Stryker Corporation launched its EasyFuse Dynamic Compression System, leveraging the unique properties of Nitinol to reduce surgical complexity and improve patient outcomes. This product launch spurred innovation and competition within the market.
Strategic Nitinol Industry Market Outlook
The future of the Nitinol industry appears promising, with continued growth driven by technological advancements, rising healthcare spending, and the increasing adoption of minimally invasive procedures. Strategic opportunities exist in developing new applications for Nitinol in areas such as robotics, sensors, and other emerging technologies. Companies focusing on innovation, strategic partnerships, and expansion into new markets are well-positioned to capitalize on the significant growth potential of this dynamic industry.
Nitinol Industry Segmentation
-
1. Product Type
- 1.1. Stents
- 1.2. Baskets
- 1.3. Guidewires
- 1.4. Other Products
-
2. Application
- 2.1. Cardiovascular
- 2.2. Urology
- 2.3. Dentistry
- 2.4. Other Products
Nitinol Industry Segmentation By Geography
-
1. North America
- 1.1. United States
- 1.2. Canada
- 1.3. Mexico
-
2. Europe
- 2.1. Germany
- 2.2. United Kingdom
- 2.3. France
- 2.4. Italy
- 2.5. Spain
- 2.6. Rest of Europe
-
3. Asia Pacific
- 3.1. China
- 3.2. Japan
- 3.3. India
- 3.4. Australia
- 3.5. South Korea
- 3.6. Rest of Asia Pacific
-
4. Middle East and Africa
- 4.1. GCC
- 4.2. South Africa
- 4.3. Rest of Middle East and Africa
-
5. South America
- 5.1. Brazil
- 5.2. Argentina
- 5.3. Rest of South America
Nitinol Industry REPORT HIGHLIGHTS
| Aspects | Details |
|---|---|
| Study Period | 2019-2033 |
| Base Year | 2024 |
| Estimated Year | 2025 |
| Forecast Period | 2025-2033 |
| Historical Period | 2019-2024 |
| Growth Rate | CAGR of 9.10% from 2019-2033 |
| Segmentation |
|
Table of Contents
- 1. Introduction
- 1.1. Research Scope
- 1.2. Market Segmentation
- 1.3. Research Methodology
- 1.4. Definitions and Assumptions
- 2. Executive Summary
- 2.1. Introduction
- 3. Market Dynamics
- 3.1. Introduction
- 3.2. Market Drivers
- 3.2.1. Growing Burden of Chronic Diseases; Rising Preference for Minimally Invasive Surgeries
- 3.3. Market Restrains
- 3.3.1. High-cost of Devices; Presence of Alternative Devices
- 3.4. Market Trends
- 3.4.1. Stents Segment to Witness Significant Growth over the Forecast Period.
- 4. Market Factor Analysis
- 4.1. Porters Five Forces
- 4.2. Supply/Value Chain
- 4.3. PESTEL analysis
- 4.4. Market Entropy
- 4.5. Patent/Trademark Analysis
- 5. Global Nitinol Industry Analysis, Insights and Forecast, 2019-2031
- 5.1. Market Analysis, Insights and Forecast - by Product Type
- 5.1.1. Stents
- 5.1.2. Baskets
- 5.1.3. Guidewires
- 5.1.4. Other Products
- 5.2. Market Analysis, Insights and Forecast - by Application
- 5.2.1. Cardiovascular
- 5.2.2. Urology
- 5.2.3. Dentistry
- 5.2.4. Other Products
- 5.3. Market Analysis, Insights and Forecast - by Region
- 5.3.1. North America
- 5.3.2. Europe
- 5.3.3. Asia Pacific
- 5.3.4. Middle East and Africa
- 5.3.5. South America
- 5.1. Market Analysis, Insights and Forecast - by Product Type
- 6. North America Nitinol Industry Analysis, Insights and Forecast, 2019-2031
- 6.1. Market Analysis, Insights and Forecast - by Product Type
- 6.1.1. Stents
- 6.1.2. Baskets
- 6.1.3. Guidewires
- 6.1.4. Other Products
- 6.2. Market Analysis, Insights and Forecast - by Application
- 6.2.1. Cardiovascular
- 6.2.2. Urology
- 6.2.3. Dentistry
- 6.2.4. Other Products
- 6.1. Market Analysis, Insights and Forecast - by Product Type
- 7. Europe Nitinol Industry Analysis, Insights and Forecast, 2019-2031
- 7.1. Market Analysis, Insights and Forecast - by Product Type
- 7.1.1. Stents
- 7.1.2. Baskets
- 7.1.3. Guidewires
- 7.1.4. Other Products
- 7.2. Market Analysis, Insights and Forecast - by Application
- 7.2.1. Cardiovascular
- 7.2.2. Urology
- 7.2.3. Dentistry
- 7.2.4. Other Products
- 7.1. Market Analysis, Insights and Forecast - by Product Type
- 8. Asia Pacific Nitinol Industry Analysis, Insights and Forecast, 2019-2031
- 8.1. Market Analysis, Insights and Forecast - by Product Type
- 8.1.1. Stents
- 8.1.2. Baskets
- 8.1.3. Guidewires
- 8.1.4. Other Products
- 8.2. Market Analysis, Insights and Forecast - by Application
- 8.2.1. Cardiovascular
- 8.2.2. Urology
- 8.2.3. Dentistry
- 8.2.4. Other Products
- 8.1. Market Analysis, Insights and Forecast - by Product Type
- 9. Middle East and Africa Nitinol Industry Analysis, Insights and Forecast, 2019-2031
- 9.1. Market Analysis, Insights and Forecast - by Product Type
- 9.1.1. Stents
- 9.1.2. Baskets
- 9.1.3. Guidewires
- 9.1.4. Other Products
- 9.2. Market Analysis, Insights and Forecast - by Application
- 9.2.1. Cardiovascular
- 9.2.2. Urology
- 9.2.3. Dentistry
- 9.2.4. Other Products
- 9.1. Market Analysis, Insights and Forecast - by Product Type
- 10. South America Nitinol Industry Analysis, Insights and Forecast, 2019-2031
- 10.1. Market Analysis, Insights and Forecast - by Product Type
- 10.1.1. Stents
- 10.1.2. Baskets
- 10.1.3. Guidewires
- 10.1.4. Other Products
- 10.2. Market Analysis, Insights and Forecast - by Application
- 10.2.1. Cardiovascular
- 10.2.2. Urology
- 10.2.3. Dentistry
- 10.2.4. Other Products
- 10.1. Market Analysis, Insights and Forecast - by Product Type
- 11. North America Nitinol Industry Analysis, Insights and Forecast, 2019-2031
- 11.1. Market Analysis, Insights and Forecast - By Country/Sub-region
- 11.1.1. undefined
- 12. Europe Nitinol Industry Analysis, Insights and Forecast, 2019-2031
- 12.1. Market Analysis, Insights and Forecast - By Country/Sub-region
- 12.1.1. undefined
- 13. Asia Pacific Nitinol Industry Analysis, Insights and Forecast, 2019-2031
- 13.1. Market Analysis, Insights and Forecast - By Country/Sub-region
- 13.1.1. undefined
- 14. Middle East and Africa Nitinol Industry Analysis, Insights and Forecast, 2019-2031
- 14.1. Market Analysis, Insights and Forecast - By Country/Sub-region
- 14.1.1. undefined
- 15. South America Nitinol Industry Analysis, Insights and Forecast, 2019-2031
- 15.1. Market Analysis, Insights and Forecast - By Country/Sub-region
- 15.1.1. undefined
- 16. Competitive Analysis
- 16.1. Global Market Share Analysis 2024
- 16.2. Company Profiles
- 16.2.1 Cook Medical
- 16.2.1.1. Overview
- 16.2.1.2. Products
- 16.2.1.3. SWOT Analysis
- 16.2.1.4. Recent Developments
- 16.2.1.5. Financials (Based on Availability)
- 16.2.2 Arthrex Inc
- 16.2.2.1. Overview
- 16.2.2.2. Products
- 16.2.2.3. SWOT Analysis
- 16.2.2.4. Recent Developments
- 16.2.2.5. Financials (Based on Availability)
- 16.2.3 Merck KGaA
- 16.2.3.1. Overview
- 16.2.3.2. Products
- 16.2.3.3. SWOT Analysis
- 16.2.3.4. Recent Developments
- 16.2.3.5. Financials (Based on Availability)
- 16.2.4 Becton Dickinson & Company
- 16.2.4.1. Overview
- 16.2.4.2. Products
- 16.2.4.3. SWOT Analysis
- 16.2.4.4. Recent Developments
- 16.2.4.5. Financials (Based on Availability)
- 16.2.5 Zimmer Biomet
- 16.2.5.1. Overview
- 16.2.5.2. Products
- 16.2.5.3. SWOT Analysis
- 16.2.5.4. Recent Developments
- 16.2.5.5. Financials (Based on Availability)
- 16.2.6 Terumo Corporation
- 16.2.6.1. Overview
- 16.2.6.2. Products
- 16.2.6.3. SWOT Analysis
- 16.2.6.4. Recent Developments
- 16.2.6.5. Financials (Based on Availability)
- 16.2.7 EndoSmart GmbH
- 16.2.7.1. Overview
- 16.2.7.2. Products
- 16.2.7.3. SWOT Analysis
- 16.2.7.4. Recent Developments
- 16.2.7.5. Financials (Based on Availability)
- 16.2.8 W L Gore & Associate Inc
- 16.2.8.1. Overview
- 16.2.8.2. Products
- 16.2.8.3. SWOT Analysis
- 16.2.8.4. Recent Developments
- 16.2.8.5. Financials (Based on Availability)
- 16.2.9 Boston Scientific Corporation
- 16.2.9.1. Overview
- 16.2.9.2. Products
- 16.2.9.3. SWOT Analysis
- 16.2.9.4. Recent Developments
- 16.2.9.5. Financials (Based on Availability)
- 16.2.10 B Braun SE
- 16.2.10.1. Overview
- 16.2.10.2. Products
- 16.2.10.3. SWOT Analysis
- 16.2.10.4. Recent Developments
- 16.2.10.5. Financials (Based on Availability)
- 16.2.1 Cook Medical
List of Figures
- Figure 1: Global Nitinol Industry Revenue Breakdown (Million, %) by Region 2024 & 2032
- Figure 2: Global Nitinol Industry Volume Breakdown (K Unit, %) by Region 2024 & 2032
- Figure 3: North America Nitinol Industry Revenue (Million), by Country 2024 & 2032
- Figure 4: North America Nitinol Industry Volume (K Unit), by Country 2024 & 2032
- Figure 5: North America Nitinol Industry Revenue Share (%), by Country 2024 & 2032
- Figure 6: North America Nitinol Industry Volume Share (%), by Country 2024 & 2032
- Figure 7: Europe Nitinol Industry Revenue (Million), by Country 2024 & 2032
- Figure 8: Europe Nitinol Industry Volume (K Unit), by Country 2024 & 2032
- Figure 9: Europe Nitinol Industry Revenue Share (%), by Country 2024 & 2032
- Figure 10: Europe Nitinol Industry Volume Share (%), by Country 2024 & 2032
- Figure 11: Asia Pacific Nitinol Industry Revenue (Million), by Country 2024 & 2032
- Figure 12: Asia Pacific Nitinol Industry Volume (K Unit), by Country 2024 & 2032
- Figure 13: Asia Pacific Nitinol Industry Revenue Share (%), by Country 2024 & 2032
- Figure 14: Asia Pacific Nitinol Industry Volume Share (%), by Country 2024 & 2032
- Figure 15: Middle East and Africa Nitinol Industry Revenue (Million), by Country 2024 & 2032
- Figure 16: Middle East and Africa Nitinol Industry Volume (K Unit), by Country 2024 & 2032
- Figure 17: Middle East and Africa Nitinol Industry Revenue Share (%), by Country 2024 & 2032
- Figure 18: Middle East and Africa Nitinol Industry Volume Share (%), by Country 2024 & 2032
- Figure 19: South America Nitinol Industry Revenue (Million), by Country 2024 & 2032
- Figure 20: South America Nitinol Industry Volume (K Unit), by Country 2024 & 2032
- Figure 21: South America Nitinol Industry Revenue Share (%), by Country 2024 & 2032
- Figure 22: South America Nitinol Industry Volume Share (%), by Country 2024 & 2032
- Figure 23: North America Nitinol Industry Revenue (Million), by Product Type 2024 & 2032
- Figure 24: North America Nitinol Industry Volume (K Unit), by Product Type 2024 & 2032
- Figure 25: North America Nitinol Industry Revenue Share (%), by Product Type 2024 & 2032
- Figure 26: North America Nitinol Industry Volume Share (%), by Product Type 2024 & 2032
- Figure 27: North America Nitinol Industry Revenue (Million), by Application 2024 & 2032
- Figure 28: North America Nitinol Industry Volume (K Unit), by Application 2024 & 2032
- Figure 29: North America Nitinol Industry Revenue Share (%), by Application 2024 & 2032
- Figure 30: North America Nitinol Industry Volume Share (%), by Application 2024 & 2032
- Figure 31: North America Nitinol Industry Revenue (Million), by Country 2024 & 2032
- Figure 32: North America Nitinol Industry Volume (K Unit), by Country 2024 & 2032
- Figure 33: North America Nitinol Industry Revenue Share (%), by Country 2024 & 2032
- Figure 34: North America Nitinol Industry Volume Share (%), by Country 2024 & 2032
- Figure 35: Europe Nitinol Industry Revenue (Million), by Product Type 2024 & 2032
- Figure 36: Europe Nitinol Industry Volume (K Unit), by Product Type 2024 & 2032
- Figure 37: Europe Nitinol Industry Revenue Share (%), by Product Type 2024 & 2032
- Figure 38: Europe Nitinol Industry Volume Share (%), by Product Type 2024 & 2032
- Figure 39: Europe Nitinol Industry Revenue (Million), by Application 2024 & 2032
- Figure 40: Europe Nitinol Industry Volume (K Unit), by Application 2024 & 2032
- Figure 41: Europe Nitinol Industry Revenue Share (%), by Application 2024 & 2032
- Figure 42: Europe Nitinol Industry Volume Share (%), by Application 2024 & 2032
- Figure 43: Europe Nitinol Industry Revenue (Million), by Country 2024 & 2032
- Figure 44: Europe Nitinol Industry Volume (K Unit), by Country 2024 & 2032
- Figure 45: Europe Nitinol Industry Revenue Share (%), by Country 2024 & 2032
- Figure 46: Europe Nitinol Industry Volume Share (%), by Country 2024 & 2032
- Figure 47: Asia Pacific Nitinol Industry Revenue (Million), by Product Type 2024 & 2032
- Figure 48: Asia Pacific Nitinol Industry Volume (K Unit), by Product Type 2024 & 2032
- Figure 49: Asia Pacific Nitinol Industry Revenue Share (%), by Product Type 2024 & 2032
- Figure 50: Asia Pacific Nitinol Industry Volume Share (%), by Product Type 2024 & 2032
- Figure 51: Asia Pacific Nitinol Industry Revenue (Million), by Application 2024 & 2032
- Figure 52: Asia Pacific Nitinol Industry Volume (K Unit), by Application 2024 & 2032
- Figure 53: Asia Pacific Nitinol Industry Revenue Share (%), by Application 2024 & 2032
- Figure 54: Asia Pacific Nitinol Industry Volume Share (%), by Application 2024 & 2032
- Figure 55: Asia Pacific Nitinol Industry Revenue (Million), by Country 2024 & 2032
- Figure 56: Asia Pacific Nitinol Industry Volume (K Unit), by Country 2024 & 2032
- Figure 57: Asia Pacific Nitinol Industry Revenue Share (%), by Country 2024 & 2032
- Figure 58: Asia Pacific Nitinol Industry Volume Share (%), by Country 2024 & 2032
- Figure 59: Middle East and Africa Nitinol Industry Revenue (Million), by Product Type 2024 & 2032
- Figure 60: Middle East and Africa Nitinol Industry Volume (K Unit), by Product Type 2024 & 2032
- Figure 61: Middle East and Africa Nitinol Industry Revenue Share (%), by Product Type 2024 & 2032
- Figure 62: Middle East and Africa Nitinol Industry Volume Share (%), by Product Type 2024 & 2032
- Figure 63: Middle East and Africa Nitinol Industry Revenue (Million), by Application 2024 & 2032
- Figure 64: Middle East and Africa Nitinol Industry Volume (K Unit), by Application 2024 & 2032
- Figure 65: Middle East and Africa Nitinol Industry Revenue Share (%), by Application 2024 & 2032
- Figure 66: Middle East and Africa Nitinol Industry Volume Share (%), by Application 2024 & 2032
- Figure 67: Middle East and Africa Nitinol Industry Revenue (Million), by Country 2024 & 2032
- Figure 68: Middle East and Africa Nitinol Industry Volume (K Unit), by Country 2024 & 2032
- Figure 69: Middle East and Africa Nitinol Industry Revenue Share (%), by Country 2024 & 2032
- Figure 70: Middle East and Africa Nitinol Industry Volume Share (%), by Country 2024 & 2032
- Figure 71: South America Nitinol Industry Revenue (Million), by Product Type 2024 & 2032
- Figure 72: South America Nitinol Industry Volume (K Unit), by Product Type 2024 & 2032
- Figure 73: South America Nitinol Industry Revenue Share (%), by Product Type 2024 & 2032
- Figure 74: South America Nitinol Industry Volume Share (%), by Product Type 2024 & 2032
- Figure 75: South America Nitinol Industry Revenue (Million), by Application 2024 & 2032
- Figure 76: South America Nitinol Industry Volume (K Unit), by Application 2024 & 2032
- Figure 77: South America Nitinol Industry Revenue Share (%), by Application 2024 & 2032
- Figure 78: South America Nitinol Industry Volume Share (%), by Application 2024 & 2032
- Figure 79: South America Nitinol Industry Revenue (Million), by Country 2024 & 2032
- Figure 80: South America Nitinol Industry Volume (K Unit), by Country 2024 & 2032
- Figure 81: South America Nitinol Industry Revenue Share (%), by Country 2024 & 2032
- Figure 82: South America Nitinol Industry Volume Share (%), by Country 2024 & 2032
List of Tables
- Table 1: Global Nitinol Industry Revenue Million Forecast, by Region 2019 & 2032
- Table 2: Global Nitinol Industry Volume K Unit Forecast, by Region 2019 & 2032
- Table 3: Global Nitinol Industry Revenue Million Forecast, by Product Type 2019 & 2032
- Table 4: Global Nitinol Industry Volume K Unit Forecast, by Product Type 2019 & 2032
- Table 5: Global Nitinol Industry Revenue Million Forecast, by Application 2019 & 2032
- Table 6: Global Nitinol Industry Volume K Unit Forecast, by Application 2019 & 2032
- Table 7: Global Nitinol Industry Revenue Million Forecast, by Region 2019 & 2032
- Table 8: Global Nitinol Industry Volume K Unit Forecast, by Region 2019 & 2032
- Table 9: Global Nitinol Industry Revenue Million Forecast, by Country 2019 & 2032
- Table 10: Global Nitinol Industry Volume K Unit Forecast, by Country 2019 & 2032
- Table 11: Global Nitinol Industry Revenue Million Forecast, by Country 2019 & 2032
- Table 12: Global Nitinol Industry Volume K Unit Forecast, by Country 2019 & 2032
- Table 13: Global Nitinol Industry Revenue Million Forecast, by Country 2019 & 2032
- Table 14: Global Nitinol Industry Volume K Unit Forecast, by Country 2019 & 2032
- Table 15: Global Nitinol Industry Revenue Million Forecast, by Country 2019 & 2032
- Table 16: Global Nitinol Industry Volume K Unit Forecast, by Country 2019 & 2032
- Table 17: Global Nitinol Industry Revenue Million Forecast, by Country 2019 & 2032
- Table 18: Global Nitinol Industry Volume K Unit Forecast, by Country 2019 & 2032
- Table 19: Global Nitinol Industry Revenue Million Forecast, by Product Type 2019 & 2032
- Table 20: Global Nitinol Industry Volume K Unit Forecast, by Product Type 2019 & 2032
- Table 21: Global Nitinol Industry Revenue Million Forecast, by Application 2019 & 2032
- Table 22: Global Nitinol Industry Volume K Unit Forecast, by Application 2019 & 2032
- Table 23: Global Nitinol Industry Revenue Million Forecast, by Country 2019 & 2032
- Table 24: Global Nitinol Industry Volume K Unit Forecast, by Country 2019 & 2032
- Table 25: United States Nitinol Industry Revenue (Million) Forecast, by Application 2019 & 2032
- Table 26: United States Nitinol Industry Volume (K Unit) Forecast, by Application 2019 & 2032
- Table 27: Canada Nitinol Industry Revenue (Million) Forecast, by Application 2019 & 2032
- Table 28: Canada Nitinol Industry Volume (K Unit) Forecast, by Application 2019 & 2032
- Table 29: Mexico Nitinol Industry Revenue (Million) Forecast, by Application 2019 & 2032
- Table 30: Mexico Nitinol Industry Volume (K Unit) Forecast, by Application 2019 & 2032
- Table 31: Global Nitinol Industry Revenue Million Forecast, by Product Type 2019 & 2032
- Table 32: Global Nitinol Industry Volume K Unit Forecast, by Product Type 2019 & 2032
- Table 33: Global Nitinol Industry Revenue Million Forecast, by Application 2019 & 2032
- Table 34: Global Nitinol Industry Volume K Unit Forecast, by Application 2019 & 2032
- Table 35: Global Nitinol Industry Revenue Million Forecast, by Country 2019 & 2032
- Table 36: Global Nitinol Industry Volume K Unit Forecast, by Country 2019 & 2032
- Table 37: Germany Nitinol Industry Revenue (Million) Forecast, by Application 2019 & 2032
- Table 38: Germany Nitinol Industry Volume (K Unit) Forecast, by Application 2019 & 2032
- Table 39: United Kingdom Nitinol Industry Revenue (Million) Forecast, by Application 2019 & 2032
- Table 40: United Kingdom Nitinol Industry Volume (K Unit) Forecast, by Application 2019 & 2032
- Table 41: France Nitinol Industry Revenue (Million) Forecast, by Application 2019 & 2032
- Table 42: France Nitinol Industry Volume (K Unit) Forecast, by Application 2019 & 2032
- Table 43: Italy Nitinol Industry Revenue (Million) Forecast, by Application 2019 & 2032
- Table 44: Italy Nitinol Industry Volume (K Unit) Forecast, by Application 2019 & 2032
- Table 45: Spain Nitinol Industry Revenue (Million) Forecast, by Application 2019 & 2032
- Table 46: Spain Nitinol Industry Volume (K Unit) Forecast, by Application 2019 & 2032
- Table 47: Rest of Europe Nitinol Industry Revenue (Million) Forecast, by Application 2019 & 2032
- Table 48: Rest of Europe Nitinol Industry Volume (K Unit) Forecast, by Application 2019 & 2032
- Table 49: Global Nitinol Industry Revenue Million Forecast, by Product Type 2019 & 2032
- Table 50: Global Nitinol Industry Volume K Unit Forecast, by Product Type 2019 & 2032
- Table 51: Global Nitinol Industry Revenue Million Forecast, by Application 2019 & 2032
- Table 52: Global Nitinol Industry Volume K Unit Forecast, by Application 2019 & 2032
- Table 53: Global Nitinol Industry Revenue Million Forecast, by Country 2019 & 2032
- Table 54: Global Nitinol Industry Volume K Unit Forecast, by Country 2019 & 2032
- Table 55: China Nitinol Industry Revenue (Million) Forecast, by Application 2019 & 2032
- Table 56: China Nitinol Industry Volume (K Unit) Forecast, by Application 2019 & 2032
- Table 57: Japan Nitinol Industry Revenue (Million) Forecast, by Application 2019 & 2032
- Table 58: Japan Nitinol Industry Volume (K Unit) Forecast, by Application 2019 & 2032
- Table 59: India Nitinol Industry Revenue (Million) Forecast, by Application 2019 & 2032
- Table 60: India Nitinol Industry Volume (K Unit) Forecast, by Application 2019 & 2032
- Table 61: Australia Nitinol Industry Revenue (Million) Forecast, by Application 2019 & 2032
- Table 62: Australia Nitinol Industry Volume (K Unit) Forecast, by Application 2019 & 2032
- Table 63: South Korea Nitinol Industry Revenue (Million) Forecast, by Application 2019 & 2032
- Table 64: South Korea Nitinol Industry Volume (K Unit) Forecast, by Application 2019 & 2032
- Table 65: Rest of Asia Pacific Nitinol Industry Revenue (Million) Forecast, by Application 2019 & 2032
- Table 66: Rest of Asia Pacific Nitinol Industry Volume (K Unit) Forecast, by Application 2019 & 2032
- Table 67: Global Nitinol Industry Revenue Million Forecast, by Product Type 2019 & 2032
- Table 68: Global Nitinol Industry Volume K Unit Forecast, by Product Type 2019 & 2032
- Table 69: Global Nitinol Industry Revenue Million Forecast, by Application 2019 & 2032
- Table 70: Global Nitinol Industry Volume K Unit Forecast, by Application 2019 & 2032
- Table 71: Global Nitinol Industry Revenue Million Forecast, by Country 2019 & 2032
- Table 72: Global Nitinol Industry Volume K Unit Forecast, by Country 2019 & 2032
- Table 73: GCC Nitinol Industry Revenue (Million) Forecast, by Application 2019 & 2032
- Table 74: GCC Nitinol Industry Volume (K Unit) Forecast, by Application 2019 & 2032
- Table 75: South Africa Nitinol Industry Revenue (Million) Forecast, by Application 2019 & 2032
- Table 76: South Africa Nitinol Industry Volume (K Unit) Forecast, by Application 2019 & 2032
- Table 77: Rest of Middle East and Africa Nitinol Industry Revenue (Million) Forecast, by Application 2019 & 2032
- Table 78: Rest of Middle East and Africa Nitinol Industry Volume (K Unit) Forecast, by Application 2019 & 2032
- Table 79: Global Nitinol Industry Revenue Million Forecast, by Product Type 2019 & 2032
- Table 80: Global Nitinol Industry Volume K Unit Forecast, by Product Type 2019 & 2032
- Table 81: Global Nitinol Industry Revenue Million Forecast, by Application 2019 & 2032
- Table 82: Global Nitinol Industry Volume K Unit Forecast, by Application 2019 & 2032
- Table 83: Global Nitinol Industry Revenue Million Forecast, by Country 2019 & 2032
- Table 84: Global Nitinol Industry Volume K Unit Forecast, by Country 2019 & 2032
- Table 85: Brazil Nitinol Industry Revenue (Million) Forecast, by Application 2019 & 2032
- Table 86: Brazil Nitinol Industry Volume (K Unit) Forecast, by Application 2019 & 2032
- Table 87: Argentina Nitinol Industry Revenue (Million) Forecast, by Application 2019 & 2032
- Table 88: Argentina Nitinol Industry Volume (K Unit) Forecast, by Application 2019 & 2032
- Table 89: Rest of South America Nitinol Industry Revenue (Million) Forecast, by Application 2019 & 2032
- Table 90: Rest of South America Nitinol Industry Volume (K Unit) Forecast, by Application 2019 & 2032
Frequently Asked Questions
1. What is the projected Compound Annual Growth Rate (CAGR) of the Nitinol Industry?
The projected CAGR is approximately 9.10%.
2. Which companies are prominent players in the Nitinol Industry?
Key companies in the market include Cook Medical, Arthrex Inc, Merck KGaA, Becton Dickinson & Company, Zimmer Biomet, Terumo Corporation, EndoSmart GmbH, W L Gore & Associate Inc, Boston Scientific Corporation, B Braun SE.
3. What are the main segments of the Nitinol Industry?
The market segments include Product Type, Application.
4. Can you provide details about the market size?
The market size is estimated to be USD XX Million as of 2022.
5. What are some drivers contributing to market growth?
Growing Burden of Chronic Diseases; Rising Preference for Minimally Invasive Surgeries.
6. What are the notable trends driving market growth?
Stents Segment to Witness Significant Growth over the Forecast Period..
7. Are there any restraints impacting market growth?
High-cost of Devices; Presence of Alternative Devices.
8. Can you provide examples of recent developments in the market?
November 2022: Alleima acquired Endosmart Gesellschaft für Medizintechnik GmbH (Endosmart), a Germany-based manufacturer of medical devices and components made of the shape-memory alloy nitinol. The product offering includes kidney stone retrieval baskets and snares, breast cancer tumor markers, as well as surgical instruments.
9. What pricing options are available for accessing the report?
Pricing options include single-user, multi-user, and enterprise licenses priced at USD 4750, USD 5250, and USD 8750 respectively.
10. Is the market size provided in terms of value or volume?
The market size is provided in terms of value, measured in Million and volume, measured in K Unit.
11. Are there any specific market keywords associated with the report?
Yes, the market keyword associated with the report is "Nitinol Industry," which aids in identifying and referencing the specific market segment covered.
12. How do I determine which pricing option suits my needs best?
The pricing options vary based on user requirements and access needs. Individual users may opt for single-user licenses, while businesses requiring broader access may choose multi-user or enterprise licenses for cost-effective access to the report.
13. Are there any additional resources or data provided in the Nitinol Industry report?
While the report offers comprehensive insights, it's advisable to review the specific contents or supplementary materials provided to ascertain if additional resources or data are available.
14. How can I stay updated on further developments or reports in the Nitinol Industry?
To stay informed about further developments, trends, and reports in the Nitinol Industry, consider subscribing to industry newsletters, following relevant companies and organizations, or regularly checking reputable industry news sources and publications.
Methodology
Step 1 - Identification of Relevant Samples Size from Population Database


Step 2 - Approaches for Defining Global Market Size (Value, Volume* & Price*)

Note*: In applicable scenarios
Step 3 - Data Sources
Primary Research
- Web Analytics
- Survey Reports
- Research Institute
- Latest Research Reports
- Opinion Leaders
Secondary Research
- Annual Reports
- White Paper
- Latest Press Release
- Industry Association
- Paid Database
- Investor Presentations

Step 4 - Data Triangulation
Involves using different sources of information in order to increase the validity of a study
These sources are likely to be stakeholders in a program - participants, other researchers, program staff, other community members, and so on.
Then we put all data in single framework & apply various statistical tools to find out the dynamic on the market.
During the analysis stage, feedback from the stakeholder groups would be compared to determine areas of agreement as well as areas of divergence


