
Key Insights
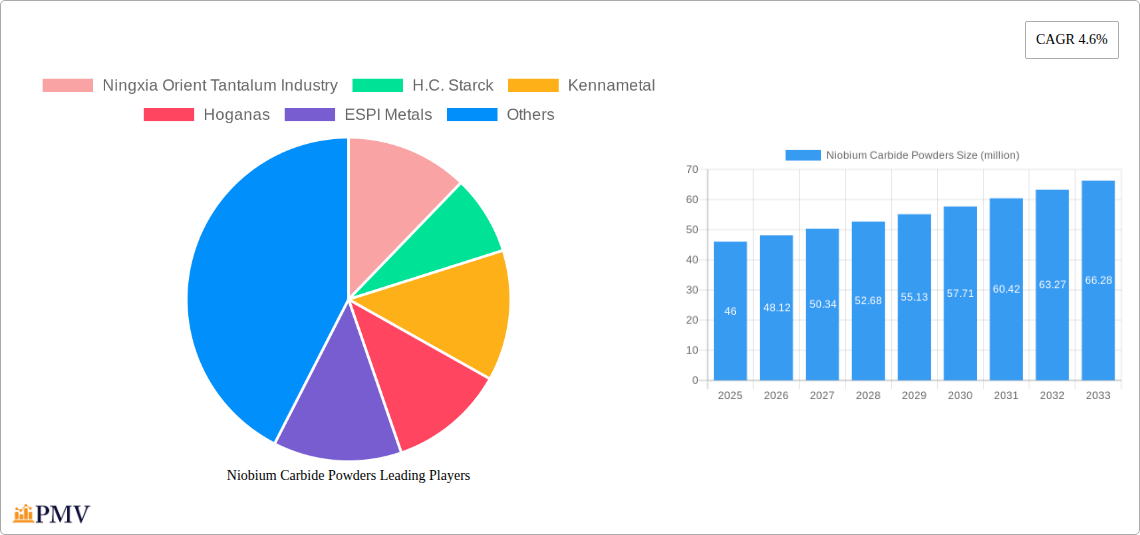
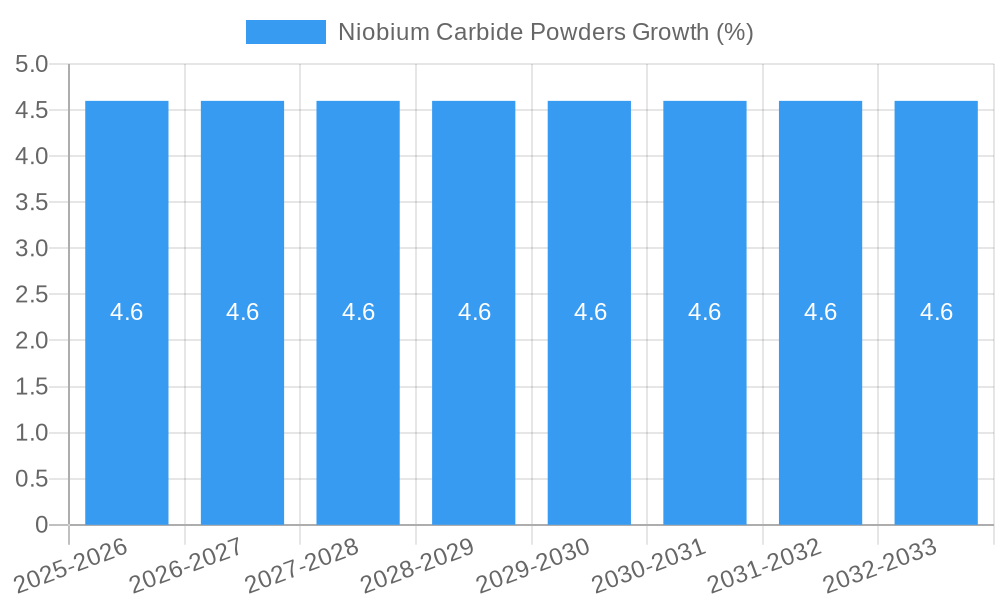
The global niobium carbide powder market is poised for steady growth, projected to reach approximately USD 46 million by 2025, with an anticipated Compound Annual Growth Rate (CAGR) of 4.6% through 2033. This expansion is primarily fueled by the increasing demand for high-performance materials across various industries. Niobium carbide's exceptional hardness, high melting point, and superior wear resistance make it an indispensable component in the manufacturing of advanced cutting tools, particularly in the carbide alloy sector. Its application extends to wear-resistant coatings for industrial equipment, enhancing their longevity and performance in demanding environments. Furthermore, the metallurgical industry leverages niobium carbide for its ability to improve the strength and toughness of steel alloys. The market's upward trajectory is also supported by ongoing research and development efforts aimed at exploring new applications and enhancing production efficiencies.
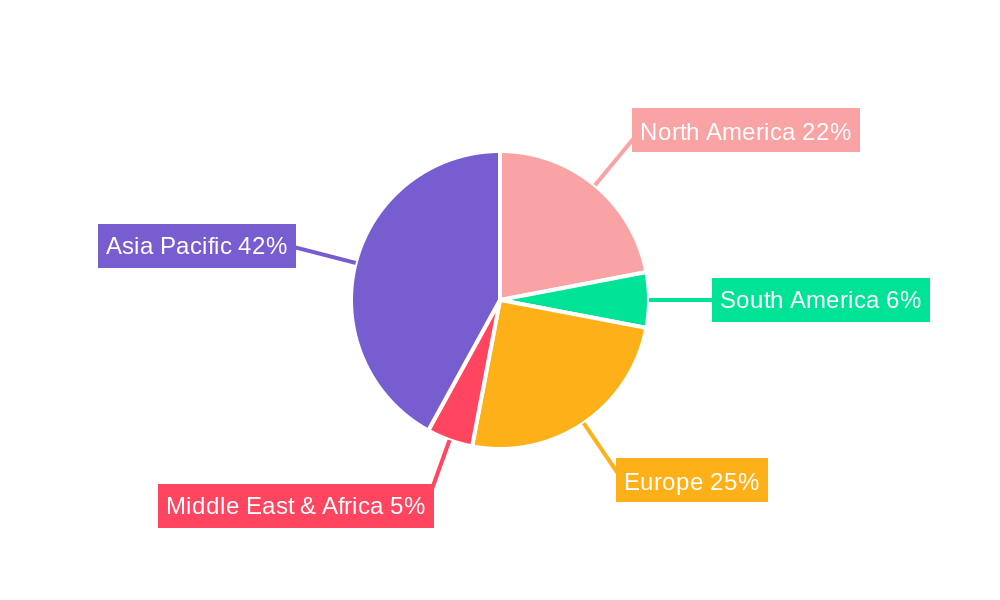
The market is characterized by a segmentation based on purity levels, with 2N (99% pure) and 2N5 (99.5% pure) grades being prominent, alongside "Others" for specialized applications. While the market benefits from strong demand drivers, it also faces certain restraints. The high cost of raw niobium material and the complex processing involved in producing high-purity niobium carbide powder can impact market accessibility and affordability. Geographically, Asia Pacific, led by China, is expected to dominate the market due to its robust manufacturing base and increasing investments in advanced materials. North America and Europe are also significant markets, driven by their advanced industrial sectors and technological innovation. Emerging economies in other regions present further growth opportunities. Key players like Ningxia Orient Tantalum Industry, H.C. Starck, and Kennametal are actively involved in research, production, and strategic partnerships to capitalize on these market dynamics and maintain a competitive edge.
This comprehensive report provides an in-depth analysis of the global Niobium Carbide Powders market, covering historical data, current trends, and future projections. The study spans the period from 2019 to 2033, with a base year of 2025, offering valuable insights for stakeholders seeking to understand market dynamics, identify growth opportunities, and navigate challenges. The report delves into market segmentation by application and type, examines key industry developments, analyzes competitive landscapes, and forecasts market performance across various regions.
Niobium Carbide Powders Market Structure & Competitive Dynamics
The Niobium Carbide Powders market exhibits a moderate level of concentration, with a few key players holding significant market share. Major companies like Ningxia Orient Tantalum Industry, H.C. Starck, and Kennametal are at the forefront of innovation and production, driving advancements in powder quality and application development. The innovation ecosystem is fueled by continuous research and development efforts aimed at enhancing material properties for demanding industrial applications, such as high-temperature alloys and advanced coatings. Regulatory frameworks, while evolving, are generally supportive of advanced materials, with a focus on environmental compliance and material safety. Product substitutes exist, particularly in niche applications, but the unique properties of niobium carbide, such as its exceptional hardness and high melting point, provide a competitive edge. End-user trends indicate a growing demand for high-performance materials in aerospace, defense, and advanced manufacturing. Mergers and acquisitions (M&A) activities, with recent deal values estimated in the tens of millions, are strategically shaping the market, consolidating expertise and expanding market reach. For instance, an estimated M&A deal value of $50 million was observed in 2023.
Niobium Carbide Powders Industry Trends & Insights
The global Niobium Carbide Powders market is poised for significant growth, driven by a confluence of factors. A projected Compound Annual Growth Rate (CAGR) of approximately 6.5% from 2025 to 2033 underscores the robust expansion anticipated. Market penetration of niobium carbide is steadily increasing across various industrial sectors. Key growth drivers include the escalating demand for high-temperature refractory materials in advanced manufacturing processes, the development of lightweight and durable components for the aerospace and automotive industries, and the increasing use of advanced coatings to enhance wear resistance and performance in cutting tools and industrial machinery. Technological disruptions, such as advancements in powder metallurgy and additive manufacturing techniques, are creating new avenues for niobium carbide utilization. Consumer preferences are shifting towards materials offering superior performance, longevity, and cost-effectiveness in the long run. This is evident in the growing adoption of niobium carbide in specialized applications where conventional materials fall short. The competitive landscape is characterized by ongoing innovation in production processes, a focus on product purity and particle size control, and strategic partnerships to expand market reach. The estimated market size for niobium carbide powders is projected to reach $500 million by 2025, with an expected surge to over $800 million by 2033.
Dominant Markets & Segments in Niobium Carbide Powders
The dominant markets and segments within the Niobium Carbide Powders industry showcase a clear trend towards high-performance applications. Geographically, North America and Europe currently lead the market, driven by strong industrial bases in aerospace, automotive, and advanced manufacturing. China is emerging as a significant growth region due to rapid industrialization and increasing investment in high-technology sectors.
Application Segment Dominance:
- Carbide Alloy: This segment is a major driver of demand, accounting for an estimated 45% of the market share. The superior hardness and wear resistance of niobium carbide make it an essential component in the production of cemented carbides used in cutting tools, mining equipment, and wear-resistant parts. Key drivers include the global demand for efficient and durable industrial machinery and the continuous innovation in machining technologies. Economic policies supporting manufacturing growth and infrastructure development in emerging economies further bolster this segment.
- Coating Materials: This segment, representing approximately 30% of the market, is experiencing rapid growth due to the demand for protective coatings in extreme environments. Niobium carbide coatings enhance the performance of components in aerospace engines, gas turbines, and industrial equipment by providing exceptional resistance to abrasion, corrosion, and high temperatures. Technological advancements in deposition techniques, such as Chemical Vapor Deposition (CVD) and Physical Vapor Deposition (PVD), are crucial for its widespread adoption.
- Metallurgical: Holding an estimated 25% of the market share, this segment benefits from the use of niobium carbide as an additive in special alloys to improve high-temperature strength and creep resistance. Its application in superalloys for aerospace and energy sectors is a key growth factor. Increasing investments in renewable energy infrastructure, requiring high-performance materials, are also contributing to the growth of this segment.
Type Segment Dominance:
- 2N (99% Purity): This standard grade, representing approximately 55% of the market, is widely used in general industrial applications where high purity is not a critical requirement. Its cost-effectiveness makes it a preferred choice for many applications.
- 2N5 (99.5% Purity): This higher purity grade, accounting for around 35% of the market, is crucial for advanced applications such as specialized coatings and high-performance alloys where minimal impurities are paramount. Technological advancements in purification processes are making this grade more accessible.
- Others (e.g., 3N Purity and Nanoparticles): While smaller in market share (approximately 10%), these niche segments are experiencing the fastest growth. Ultra-high purity niobium carbide and nanoscale powders offer unique properties for cutting-edge applications in electronics, advanced ceramics, and research.
Niobium Carbide Powders Product Innovations
Product innovation in Niobium Carbide Powders is focused on enhancing material properties for specialized applications. Recent developments include the production of sub-micron and nano-sized niobium carbide powders with controlled particle size distributions, leading to improved sinterability and enhanced mechanical properties in composite materials. Innovations in synthesis methods, such as plasma synthesis and advanced chemical routes, are yielding higher purity powders and novel microstructures. These advancements offer a competitive advantage by enabling the development of next-generation cutting tools with superior edge retention, wear-resistant coatings for demanding industrial environments, and advanced refractory materials for extreme temperature applications. The market fit for these innovations lies in industries seeking performance breakthroughs and extended component lifespan.
Report Segmentation & Scope
This report segments the Niobium Carbide Powders market based on key parameters to provide a granular understanding of its dynamics. The segmentation includes:
Application:
- Carbide Alloy: This segment is projected to grow at a CAGR of 6.8% from 2025 to 2033, driven by the demand for advanced cutting tools and wear parts in manufacturing and mining. The estimated market size in 2025 is $225 million.
- Coating Materials: Expected to witness a CAGR of 7.2% during the forecast period, this segment's growth is fueled by the aerospace and energy sectors' need for high-performance protective coatings. The estimated market size in 2025 is $150 million.
- Metallurgical: This segment is forecast to grow at a CAGR of 5.9%, with an estimated market size of $125 million in 2025, supported by the increasing use of niobium carbide in specialty alloys for high-temperature applications.
Types:
- 2N (99% Purity): This segment is projected to grow at a CAGR of 6.1%, with an estimated market size of $275 million in 2025, serving a broad range of industrial applications.
- 2N5 (99.5% Purity): Anticipated to grow at a CAGR of 7.5%, this segment's estimated market size in 2025 is $175 million, driven by demand in high-tech sectors.
- Others (e.g., 3N Purity, Nanoparticles): This niche segment is expected to exhibit the highest CAGR of 8.5%, with an estimated market size of $50 million in 2025, catering to emerging advanced material applications.
Key Drivers of Niobium Carbide Powders Growth
The growth of the Niobium Carbide Powders market is propelled by several key factors. Technologically, the increasing demand for materials with exceptional hardness, high melting points, and superior wear resistance in demanding industrial environments is a primary driver. Economically, the global expansion of manufacturing sectors, particularly in automotive, aerospace, and defense, coupled with increased infrastructure development in emerging economies, fuels the need for high-performance materials. Regulatory factors, such as a growing emphasis on material efficiency and component longevity, indirectly support the adoption of advanced materials like niobium carbide that contribute to sustainability and reduced maintenance costs. For example, stringent regulations in the aerospace industry for engine component durability indirectly boost the demand for niobium carbide-containing superalloys.
Challenges in the Niobium Carbide Powders Sector
Despite the promising growth, the Niobium Carbide Powders sector faces certain challenges. Regulatory hurdles related to the extraction and processing of niobium, although generally managed, can impact supply chain stability. High production costs associated with achieving high purity levels and the energy-intensive nature of some synthesis processes can limit widespread adoption in price-sensitive applications. Competitive pressures from alternative advanced ceramic and refractory materials, which may offer comparable performance in certain niches at a lower cost, also pose a challenge. Supply chain disruptions, as witnessed globally in recent years, can affect the availability and pricing of raw materials. For instance, an estimated 15% fluctuation in raw material prices was observed in 2022, impacting production costs.
Leading Players in the Niobium Carbide Powders Market
- Ningxia Orient Tantalum Industry
- H.C. Starck
- Kennametal
- Hoganas
- ESPI Metals
- Beijing Youxinglian Nonferrous Metals
- ZhuZhou TuoPo Carbide Material
- Zhuzhou Sanli Carbide Material
- Zhuzhou Guangyuan Cemented Material
- Japan New Metals
Key Developments in Niobium Carbide Powders Sector
- 2023, Q4: H.C. Starck announced significant investment in new production capacity for advanced refractory metal powders, including niobium carbide, to meet growing demand from the aerospace sector.
- 2023, Q2: Kennametal introduced a new line of cemented carbide cutting tools incorporating enhanced niobium carbide compositions, offering improved wear resistance and tool life.
- 2022, Q4: Ningxia Orient Tantalum Industry expanded its research and development efforts focused on nano-sized niobium carbide powders for advanced ceramic applications.
- 2022, Q1: ESPI Metals reported an increase in demand for high-purity niobium carbide powders from the defense industry for specialized coatings.
Strategic Niobium Carbide Powders Market Outlook
The strategic outlook for the Niobium Carbide Powders market is exceptionally positive, driven by continuous innovation and expanding application horizons. Growth accelerators include the increasing adoption of additive manufacturing, which opens new possibilities for complex niobium carbide component fabrication, and the ongoing development of novel alloys and composites requiring its unique properties. The expanding energy sector, particularly in advanced nuclear and fusion technologies, presents a significant long-term opportunity. Strategic investments in R&D, focusing on cost-effective production and tailored material properties for specific end-uses, will be crucial for sustained market leadership. Collaborations between powder manufacturers, material scientists, and end-users will foster synergistic growth and unlock new market potential. The market is expected to see continued expansion as industries prioritize high-performance, durable, and efficient material solutions.
Niobium Carbide Powders Segmentation
-
1. Application
- 1.1. Carbide Alloy
- 1.2. Coating Materials
- 1.3. Metallurgical
-
2. Types
- 2.1. 2N
- 2.2. 2N5
- 2.3. Others
Niobium Carbide Powders Segmentation By Geography
-
1. North America
- 1.1. United States
- 1.2. Canada
- 1.3. Mexico
-
2. South America
- 2.1. Brazil
- 2.2. Argentina
- 2.3. Rest of South America
-
3. Europe
- 3.1. United Kingdom
- 3.2. Germany
- 3.3. France
- 3.4. Italy
- 3.5. Spain
- 3.6. Russia
- 3.7. Benelux
- 3.8. Nordics
- 3.9. Rest of Europe
-
4. Middle East & Africa
- 4.1. Turkey
- 4.2. Israel
- 4.3. GCC
- 4.4. North Africa
- 4.5. South Africa
- 4.6. Rest of Middle East & Africa
-
5. Asia Pacific
- 5.1. China
- 5.2. India
- 5.3. Japan
- 5.4. South Korea
- 5.5. ASEAN
- 5.6. Oceania
- 5.7. Rest of Asia Pacific
Niobium Carbide Powders REPORT HIGHLIGHTS
| Aspects | Details |
|---|---|
| Study Period | 2019-2033 |
| Base Year | 2024 |
| Estimated Year | 2025 |
| Forecast Period | 2025-2033 |
| Historical Period | 2019-2024 |
| Growth Rate | CAGR of 4.6% from 2019-2033 |
| Segmentation |
|
Table of Contents
- 1. Introduction
- 1.1. Research Scope
- 1.2. Market Segmentation
- 1.3. Research Methodology
- 1.4. Definitions and Assumptions
- 2. Executive Summary
- 2.1. Introduction
- 3. Market Dynamics
- 3.1. Introduction
- 3.2. Market Drivers
- 3.3. Market Restrains
- 3.4. Market Trends
- 4. Market Factor Analysis
- 4.1. Porters Five Forces
- 4.2. Supply/Value Chain
- 4.3. PESTEL analysis
- 4.4. Market Entropy
- 4.5. Patent/Trademark Analysis
- 5. Global Niobium Carbide Powders Analysis, Insights and Forecast, 2019-2031
- 5.1. Market Analysis, Insights and Forecast - by Application
- 5.1.1. Carbide Alloy
- 5.1.2. Coating Materials
- 5.1.3. Metallurgical
- 5.2. Market Analysis, Insights and Forecast - by Types
- 5.2.1. 2N
- 5.2.2. 2N5
- 5.2.3. Others
- 5.3. Market Analysis, Insights and Forecast - by Region
- 5.3.1. North America
- 5.3.2. South America
- 5.3.3. Europe
- 5.3.4. Middle East & Africa
- 5.3.5. Asia Pacific
- 5.1. Market Analysis, Insights and Forecast - by Application
- 6. North America Niobium Carbide Powders Analysis, Insights and Forecast, 2019-2031
- 6.1. Market Analysis, Insights and Forecast - by Application
- 6.1.1. Carbide Alloy
- 6.1.2. Coating Materials
- 6.1.3. Metallurgical
- 6.2. Market Analysis, Insights and Forecast - by Types
- 6.2.1. 2N
- 6.2.2. 2N5
- 6.2.3. Others
- 6.1. Market Analysis, Insights and Forecast - by Application
- 7. South America Niobium Carbide Powders Analysis, Insights and Forecast, 2019-2031
- 7.1. Market Analysis, Insights and Forecast - by Application
- 7.1.1. Carbide Alloy
- 7.1.2. Coating Materials
- 7.1.3. Metallurgical
- 7.2. Market Analysis, Insights and Forecast - by Types
- 7.2.1. 2N
- 7.2.2. 2N5
- 7.2.3. Others
- 7.1. Market Analysis, Insights and Forecast - by Application
- 8. Europe Niobium Carbide Powders Analysis, Insights and Forecast, 2019-2031
- 8.1. Market Analysis, Insights and Forecast - by Application
- 8.1.1. Carbide Alloy
- 8.1.2. Coating Materials
- 8.1.3. Metallurgical
- 8.2. Market Analysis, Insights and Forecast - by Types
- 8.2.1. 2N
- 8.2.2. 2N5
- 8.2.3. Others
- 8.1. Market Analysis, Insights and Forecast - by Application
- 9. Middle East & Africa Niobium Carbide Powders Analysis, Insights and Forecast, 2019-2031
- 9.1. Market Analysis, Insights and Forecast - by Application
- 9.1.1. Carbide Alloy
- 9.1.2. Coating Materials
- 9.1.3. Metallurgical
- 9.2. Market Analysis, Insights and Forecast - by Types
- 9.2.1. 2N
- 9.2.2. 2N5
- 9.2.3. Others
- 9.1. Market Analysis, Insights and Forecast - by Application
- 10. Asia Pacific Niobium Carbide Powders Analysis, Insights and Forecast, 2019-2031
- 10.1. Market Analysis, Insights and Forecast - by Application
- 10.1.1. Carbide Alloy
- 10.1.2. Coating Materials
- 10.1.3. Metallurgical
- 10.2. Market Analysis, Insights and Forecast - by Types
- 10.2.1. 2N
- 10.2.2. 2N5
- 10.2.3. Others
- 10.1. Market Analysis, Insights and Forecast - by Application
- 11. Competitive Analysis
- 11.1. Global Market Share Analysis 2024
- 11.2. Company Profiles
- 11.2.1 Ningxia Orient Tantalum Industry
- 11.2.1.1. Overview
- 11.2.1.2. Products
- 11.2.1.3. SWOT Analysis
- 11.2.1.4. Recent Developments
- 11.2.1.5. Financials (Based on Availability)
- 11.2.2 H.C. Starck
- 11.2.2.1. Overview
- 11.2.2.2. Products
- 11.2.2.3. SWOT Analysis
- 11.2.2.4. Recent Developments
- 11.2.2.5. Financials (Based on Availability)
- 11.2.3 Kennametal
- 11.2.3.1. Overview
- 11.2.3.2. Products
- 11.2.3.3. SWOT Analysis
- 11.2.3.4. Recent Developments
- 11.2.3.5. Financials (Based on Availability)
- 11.2.4 Hoganas
- 11.2.4.1. Overview
- 11.2.4.2. Products
- 11.2.4.3. SWOT Analysis
- 11.2.4.4. Recent Developments
- 11.2.4.5. Financials (Based on Availability)
- 11.2.5 ESPI Metals
- 11.2.5.1. Overview
- 11.2.5.2. Products
- 11.2.5.3. SWOT Analysis
- 11.2.5.4. Recent Developments
- 11.2.5.5. Financials (Based on Availability)
- 11.2.6 Beijing Youxinglian Nonferrous Metals
- 11.2.6.1. Overview
- 11.2.6.2. Products
- 11.2.6.3. SWOT Analysis
- 11.2.6.4. Recent Developments
- 11.2.6.5. Financials (Based on Availability)
- 11.2.7 ZhuZhou TuoPo Carbide Material
- 11.2.7.1. Overview
- 11.2.7.2. Products
- 11.2.7.3. SWOT Analysis
- 11.2.7.4. Recent Developments
- 11.2.7.5. Financials (Based on Availability)
- 11.2.8 Zhuzhou Sanli Carbide Material
- 11.2.8.1. Overview
- 11.2.8.2. Products
- 11.2.8.3. SWOT Analysis
- 11.2.8.4. Recent Developments
- 11.2.8.5. Financials (Based on Availability)
- 11.2.9 Zhuzhou Guangyuan Cemented Material
- 11.2.9.1. Overview
- 11.2.9.2. Products
- 11.2.9.3. SWOT Analysis
- 11.2.9.4. Recent Developments
- 11.2.9.5. Financials (Based on Availability)
- 11.2.10 Japan New Metals
- 11.2.10.1. Overview
- 11.2.10.2. Products
- 11.2.10.3. SWOT Analysis
- 11.2.10.4. Recent Developments
- 11.2.10.5. Financials (Based on Availability)
- 11.2.1 Ningxia Orient Tantalum Industry
List of Figures
- Figure 1: Global Niobium Carbide Powders Revenue Breakdown (million, %) by Region 2024 & 2032
- Figure 2: Global Niobium Carbide Powders Volume Breakdown (K, %) by Region 2024 & 2032
- Figure 3: North America Niobium Carbide Powders Revenue (million), by Application 2024 & 2032
- Figure 4: North America Niobium Carbide Powders Volume (K), by Application 2024 & 2032
- Figure 5: North America Niobium Carbide Powders Revenue Share (%), by Application 2024 & 2032
- Figure 6: North America Niobium Carbide Powders Volume Share (%), by Application 2024 & 2032
- Figure 7: North America Niobium Carbide Powders Revenue (million), by Types 2024 & 2032
- Figure 8: North America Niobium Carbide Powders Volume (K), by Types 2024 & 2032
- Figure 9: North America Niobium Carbide Powders Revenue Share (%), by Types 2024 & 2032
- Figure 10: North America Niobium Carbide Powders Volume Share (%), by Types 2024 & 2032
- Figure 11: North America Niobium Carbide Powders Revenue (million), by Country 2024 & 2032
- Figure 12: North America Niobium Carbide Powders Volume (K), by Country 2024 & 2032
- Figure 13: North America Niobium Carbide Powders Revenue Share (%), by Country 2024 & 2032
- Figure 14: North America Niobium Carbide Powders Volume Share (%), by Country 2024 & 2032
- Figure 15: South America Niobium Carbide Powders Revenue (million), by Application 2024 & 2032
- Figure 16: South America Niobium Carbide Powders Volume (K), by Application 2024 & 2032
- Figure 17: South America Niobium Carbide Powders Revenue Share (%), by Application 2024 & 2032
- Figure 18: South America Niobium Carbide Powders Volume Share (%), by Application 2024 & 2032
- Figure 19: South America Niobium Carbide Powders Revenue (million), by Types 2024 & 2032
- Figure 20: South America Niobium Carbide Powders Volume (K), by Types 2024 & 2032
- Figure 21: South America Niobium Carbide Powders Revenue Share (%), by Types 2024 & 2032
- Figure 22: South America Niobium Carbide Powders Volume Share (%), by Types 2024 & 2032
- Figure 23: South America Niobium Carbide Powders Revenue (million), by Country 2024 & 2032
- Figure 24: South America Niobium Carbide Powders Volume (K), by Country 2024 & 2032
- Figure 25: South America Niobium Carbide Powders Revenue Share (%), by Country 2024 & 2032
- Figure 26: South America Niobium Carbide Powders Volume Share (%), by Country 2024 & 2032
- Figure 27: Europe Niobium Carbide Powders Revenue (million), by Application 2024 & 2032
- Figure 28: Europe Niobium Carbide Powders Volume (K), by Application 2024 & 2032
- Figure 29: Europe Niobium Carbide Powders Revenue Share (%), by Application 2024 & 2032
- Figure 30: Europe Niobium Carbide Powders Volume Share (%), by Application 2024 & 2032
- Figure 31: Europe Niobium Carbide Powders Revenue (million), by Types 2024 & 2032
- Figure 32: Europe Niobium Carbide Powders Volume (K), by Types 2024 & 2032
- Figure 33: Europe Niobium Carbide Powders Revenue Share (%), by Types 2024 & 2032
- Figure 34: Europe Niobium Carbide Powders Volume Share (%), by Types 2024 & 2032
- Figure 35: Europe Niobium Carbide Powders Revenue (million), by Country 2024 & 2032
- Figure 36: Europe Niobium Carbide Powders Volume (K), by Country 2024 & 2032
- Figure 37: Europe Niobium Carbide Powders Revenue Share (%), by Country 2024 & 2032
- Figure 38: Europe Niobium Carbide Powders Volume Share (%), by Country 2024 & 2032
- Figure 39: Middle East & Africa Niobium Carbide Powders Revenue (million), by Application 2024 & 2032
- Figure 40: Middle East & Africa Niobium Carbide Powders Volume (K), by Application 2024 & 2032
- Figure 41: Middle East & Africa Niobium Carbide Powders Revenue Share (%), by Application 2024 & 2032
- Figure 42: Middle East & Africa Niobium Carbide Powders Volume Share (%), by Application 2024 & 2032
- Figure 43: Middle East & Africa Niobium Carbide Powders Revenue (million), by Types 2024 & 2032
- Figure 44: Middle East & Africa Niobium Carbide Powders Volume (K), by Types 2024 & 2032
- Figure 45: Middle East & Africa Niobium Carbide Powders Revenue Share (%), by Types 2024 & 2032
- Figure 46: Middle East & Africa Niobium Carbide Powders Volume Share (%), by Types 2024 & 2032
- Figure 47: Middle East & Africa Niobium Carbide Powders Revenue (million), by Country 2024 & 2032
- Figure 48: Middle East & Africa Niobium Carbide Powders Volume (K), by Country 2024 & 2032
- Figure 49: Middle East & Africa Niobium Carbide Powders Revenue Share (%), by Country 2024 & 2032
- Figure 50: Middle East & Africa Niobium Carbide Powders Volume Share (%), by Country 2024 & 2032
- Figure 51: Asia Pacific Niobium Carbide Powders Revenue (million), by Application 2024 & 2032
- Figure 52: Asia Pacific Niobium Carbide Powders Volume (K), by Application 2024 & 2032
- Figure 53: Asia Pacific Niobium Carbide Powders Revenue Share (%), by Application 2024 & 2032
- Figure 54: Asia Pacific Niobium Carbide Powders Volume Share (%), by Application 2024 & 2032
- Figure 55: Asia Pacific Niobium Carbide Powders Revenue (million), by Types 2024 & 2032
- Figure 56: Asia Pacific Niobium Carbide Powders Volume (K), by Types 2024 & 2032
- Figure 57: Asia Pacific Niobium Carbide Powders Revenue Share (%), by Types 2024 & 2032
- Figure 58: Asia Pacific Niobium Carbide Powders Volume Share (%), by Types 2024 & 2032
- Figure 59: Asia Pacific Niobium Carbide Powders Revenue (million), by Country 2024 & 2032
- Figure 60: Asia Pacific Niobium Carbide Powders Volume (K), by Country 2024 & 2032
- Figure 61: Asia Pacific Niobium Carbide Powders Revenue Share (%), by Country 2024 & 2032
- Figure 62: Asia Pacific Niobium Carbide Powders Volume Share (%), by Country 2024 & 2032
List of Tables
- Table 1: Global Niobium Carbide Powders Revenue million Forecast, by Region 2019 & 2032
- Table 2: Global Niobium Carbide Powders Volume K Forecast, by Region 2019 & 2032
- Table 3: Global Niobium Carbide Powders Revenue million Forecast, by Application 2019 & 2032
- Table 4: Global Niobium Carbide Powders Volume K Forecast, by Application 2019 & 2032
- Table 5: Global Niobium Carbide Powders Revenue million Forecast, by Types 2019 & 2032
- Table 6: Global Niobium Carbide Powders Volume K Forecast, by Types 2019 & 2032
- Table 7: Global Niobium Carbide Powders Revenue million Forecast, by Region 2019 & 2032
- Table 8: Global Niobium Carbide Powders Volume K Forecast, by Region 2019 & 2032
- Table 9: Global Niobium Carbide Powders Revenue million Forecast, by Application 2019 & 2032
- Table 10: Global Niobium Carbide Powders Volume K Forecast, by Application 2019 & 2032
- Table 11: Global Niobium Carbide Powders Revenue million Forecast, by Types 2019 & 2032
- Table 12: Global Niobium Carbide Powders Volume K Forecast, by Types 2019 & 2032
- Table 13: Global Niobium Carbide Powders Revenue million Forecast, by Country 2019 & 2032
- Table 14: Global Niobium Carbide Powders Volume K Forecast, by Country 2019 & 2032
- Table 15: United States Niobium Carbide Powders Revenue (million) Forecast, by Application 2019 & 2032
- Table 16: United States Niobium Carbide Powders Volume (K) Forecast, by Application 2019 & 2032
- Table 17: Canada Niobium Carbide Powders Revenue (million) Forecast, by Application 2019 & 2032
- Table 18: Canada Niobium Carbide Powders Volume (K) Forecast, by Application 2019 & 2032
- Table 19: Mexico Niobium Carbide Powders Revenue (million) Forecast, by Application 2019 & 2032
- Table 20: Mexico Niobium Carbide Powders Volume (K) Forecast, by Application 2019 & 2032
- Table 21: Global Niobium Carbide Powders Revenue million Forecast, by Application 2019 & 2032
- Table 22: Global Niobium Carbide Powders Volume K Forecast, by Application 2019 & 2032
- Table 23: Global Niobium Carbide Powders Revenue million Forecast, by Types 2019 & 2032
- Table 24: Global Niobium Carbide Powders Volume K Forecast, by Types 2019 & 2032
- Table 25: Global Niobium Carbide Powders Revenue million Forecast, by Country 2019 & 2032
- Table 26: Global Niobium Carbide Powders Volume K Forecast, by Country 2019 & 2032
- Table 27: Brazil Niobium Carbide Powders Revenue (million) Forecast, by Application 2019 & 2032
- Table 28: Brazil Niobium Carbide Powders Volume (K) Forecast, by Application 2019 & 2032
- Table 29: Argentina Niobium Carbide Powders Revenue (million) Forecast, by Application 2019 & 2032
- Table 30: Argentina Niobium Carbide Powders Volume (K) Forecast, by Application 2019 & 2032
- Table 31: Rest of South America Niobium Carbide Powders Revenue (million) Forecast, by Application 2019 & 2032
- Table 32: Rest of South America Niobium Carbide Powders Volume (K) Forecast, by Application 2019 & 2032
- Table 33: Global Niobium Carbide Powders Revenue million Forecast, by Application 2019 & 2032
- Table 34: Global Niobium Carbide Powders Volume K Forecast, by Application 2019 & 2032
- Table 35: Global Niobium Carbide Powders Revenue million Forecast, by Types 2019 & 2032
- Table 36: Global Niobium Carbide Powders Volume K Forecast, by Types 2019 & 2032
- Table 37: Global Niobium Carbide Powders Revenue million Forecast, by Country 2019 & 2032
- Table 38: Global Niobium Carbide Powders Volume K Forecast, by Country 2019 & 2032
- Table 39: United Kingdom Niobium Carbide Powders Revenue (million) Forecast, by Application 2019 & 2032
- Table 40: United Kingdom Niobium Carbide Powders Volume (K) Forecast, by Application 2019 & 2032
- Table 41: Germany Niobium Carbide Powders Revenue (million) Forecast, by Application 2019 & 2032
- Table 42: Germany Niobium Carbide Powders Volume (K) Forecast, by Application 2019 & 2032
- Table 43: France Niobium Carbide Powders Revenue (million) Forecast, by Application 2019 & 2032
- Table 44: France Niobium Carbide Powders Volume (K) Forecast, by Application 2019 & 2032
- Table 45: Italy Niobium Carbide Powders Revenue (million) Forecast, by Application 2019 & 2032
- Table 46: Italy Niobium Carbide Powders Volume (K) Forecast, by Application 2019 & 2032
- Table 47: Spain Niobium Carbide Powders Revenue (million) Forecast, by Application 2019 & 2032
- Table 48: Spain Niobium Carbide Powders Volume (K) Forecast, by Application 2019 & 2032
- Table 49: Russia Niobium Carbide Powders Revenue (million) Forecast, by Application 2019 & 2032
- Table 50: Russia Niobium Carbide Powders Volume (K) Forecast, by Application 2019 & 2032
- Table 51: Benelux Niobium Carbide Powders Revenue (million) Forecast, by Application 2019 & 2032
- Table 52: Benelux Niobium Carbide Powders Volume (K) Forecast, by Application 2019 & 2032
- Table 53: Nordics Niobium Carbide Powders Revenue (million) Forecast, by Application 2019 & 2032
- Table 54: Nordics Niobium Carbide Powders Volume (K) Forecast, by Application 2019 & 2032
- Table 55: Rest of Europe Niobium Carbide Powders Revenue (million) Forecast, by Application 2019 & 2032
- Table 56: Rest of Europe Niobium Carbide Powders Volume (K) Forecast, by Application 2019 & 2032
- Table 57: Global Niobium Carbide Powders Revenue million Forecast, by Application 2019 & 2032
- Table 58: Global Niobium Carbide Powders Volume K Forecast, by Application 2019 & 2032
- Table 59: Global Niobium Carbide Powders Revenue million Forecast, by Types 2019 & 2032
- Table 60: Global Niobium Carbide Powders Volume K Forecast, by Types 2019 & 2032
- Table 61: Global Niobium Carbide Powders Revenue million Forecast, by Country 2019 & 2032
- Table 62: Global Niobium Carbide Powders Volume K Forecast, by Country 2019 & 2032
- Table 63: Turkey Niobium Carbide Powders Revenue (million) Forecast, by Application 2019 & 2032
- Table 64: Turkey Niobium Carbide Powders Volume (K) Forecast, by Application 2019 & 2032
- Table 65: Israel Niobium Carbide Powders Revenue (million) Forecast, by Application 2019 & 2032
- Table 66: Israel Niobium Carbide Powders Volume (K) Forecast, by Application 2019 & 2032
- Table 67: GCC Niobium Carbide Powders Revenue (million) Forecast, by Application 2019 & 2032
- Table 68: GCC Niobium Carbide Powders Volume (K) Forecast, by Application 2019 & 2032
- Table 69: North Africa Niobium Carbide Powders Revenue (million) Forecast, by Application 2019 & 2032
- Table 70: North Africa Niobium Carbide Powders Volume (K) Forecast, by Application 2019 & 2032
- Table 71: South Africa Niobium Carbide Powders Revenue (million) Forecast, by Application 2019 & 2032
- Table 72: South Africa Niobium Carbide Powders Volume (K) Forecast, by Application 2019 & 2032
- Table 73: Rest of Middle East & Africa Niobium Carbide Powders Revenue (million) Forecast, by Application 2019 & 2032
- Table 74: Rest of Middle East & Africa Niobium Carbide Powders Volume (K) Forecast, by Application 2019 & 2032
- Table 75: Global Niobium Carbide Powders Revenue million Forecast, by Application 2019 & 2032
- Table 76: Global Niobium Carbide Powders Volume K Forecast, by Application 2019 & 2032
- Table 77: Global Niobium Carbide Powders Revenue million Forecast, by Types 2019 & 2032
- Table 78: Global Niobium Carbide Powders Volume K Forecast, by Types 2019 & 2032
- Table 79: Global Niobium Carbide Powders Revenue million Forecast, by Country 2019 & 2032
- Table 80: Global Niobium Carbide Powders Volume K Forecast, by Country 2019 & 2032
- Table 81: China Niobium Carbide Powders Revenue (million) Forecast, by Application 2019 & 2032
- Table 82: China Niobium Carbide Powders Volume (K) Forecast, by Application 2019 & 2032
- Table 83: India Niobium Carbide Powders Revenue (million) Forecast, by Application 2019 & 2032
- Table 84: India Niobium Carbide Powders Volume (K) Forecast, by Application 2019 & 2032
- Table 85: Japan Niobium Carbide Powders Revenue (million) Forecast, by Application 2019 & 2032
- Table 86: Japan Niobium Carbide Powders Volume (K) Forecast, by Application 2019 & 2032
- Table 87: South Korea Niobium Carbide Powders Revenue (million) Forecast, by Application 2019 & 2032
- Table 88: South Korea Niobium Carbide Powders Volume (K) Forecast, by Application 2019 & 2032
- Table 89: ASEAN Niobium Carbide Powders Revenue (million) Forecast, by Application 2019 & 2032
- Table 90: ASEAN Niobium Carbide Powders Volume (K) Forecast, by Application 2019 & 2032
- Table 91: Oceania Niobium Carbide Powders Revenue (million) Forecast, by Application 2019 & 2032
- Table 92: Oceania Niobium Carbide Powders Volume (K) Forecast, by Application 2019 & 2032
- Table 93: Rest of Asia Pacific Niobium Carbide Powders Revenue (million) Forecast, by Application 2019 & 2032
- Table 94: Rest of Asia Pacific Niobium Carbide Powders Volume (K) Forecast, by Application 2019 & 2032
Frequently Asked Questions
1. What is the projected Compound Annual Growth Rate (CAGR) of the Niobium Carbide Powders?
The projected CAGR is approximately 4.6%.
2. Which companies are prominent players in the Niobium Carbide Powders?
Key companies in the market include Ningxia Orient Tantalum Industry, H.C. Starck, Kennametal, Hoganas, ESPI Metals, Beijing Youxinglian Nonferrous Metals, ZhuZhou TuoPo Carbide Material, Zhuzhou Sanli Carbide Material, Zhuzhou Guangyuan Cemented Material, Japan New Metals.
3. What are the main segments of the Niobium Carbide Powders?
The market segments include Application, Types.
4. Can you provide details about the market size?
The market size is estimated to be USD 46 million as of 2022.
5. What are some drivers contributing to market growth?
N/A
6. What are the notable trends driving market growth?
N/A
7. Are there any restraints impacting market growth?
N/A
8. Can you provide examples of recent developments in the market?
N/A
9. What pricing options are available for accessing the report?
Pricing options include single-user, multi-user, and enterprise licenses priced at USD 3950.00, USD 5925.00, and USD 7900.00 respectively.
10. Is the market size provided in terms of value or volume?
The market size is provided in terms of value, measured in million and volume, measured in K.
11. Are there any specific market keywords associated with the report?
Yes, the market keyword associated with the report is "Niobium Carbide Powders," which aids in identifying and referencing the specific market segment covered.
12. How do I determine which pricing option suits my needs best?
The pricing options vary based on user requirements and access needs. Individual users may opt for single-user licenses, while businesses requiring broader access may choose multi-user or enterprise licenses for cost-effective access to the report.
13. Are there any additional resources or data provided in the Niobium Carbide Powders report?
While the report offers comprehensive insights, it's advisable to review the specific contents or supplementary materials provided to ascertain if additional resources or data are available.
14. How can I stay updated on further developments or reports in the Niobium Carbide Powders?
To stay informed about further developments, trends, and reports in the Niobium Carbide Powders, consider subscribing to industry newsletters, following relevant companies and organizations, or regularly checking reputable industry news sources and publications.
Methodology
Step 1 - Identification of Relevant Samples Size from Population Database


Step 2 - Approaches for Defining Global Market Size (Value, Volume* & Price*)

Note*: In applicable scenarios
Step 3 - Data Sources
Primary Research
- Web Analytics
- Survey Reports
- Research Institute
- Latest Research Reports
- Opinion Leaders
Secondary Research
- Annual Reports
- White Paper
- Latest Press Release
- Industry Association
- Paid Database
- Investor Presentations

Step 4 - Data Triangulation
Involves using different sources of information in order to increase the validity of a study
These sources are likely to be stakeholders in a program - participants, other researchers, program staff, other community members, and so on.
Then we put all data in single framework & apply various statistical tools to find out the dynamic on the market.
During the analysis stage, feedback from the stakeholder groups would be compared to determine areas of agreement as well as areas of divergence


