
Key Insights
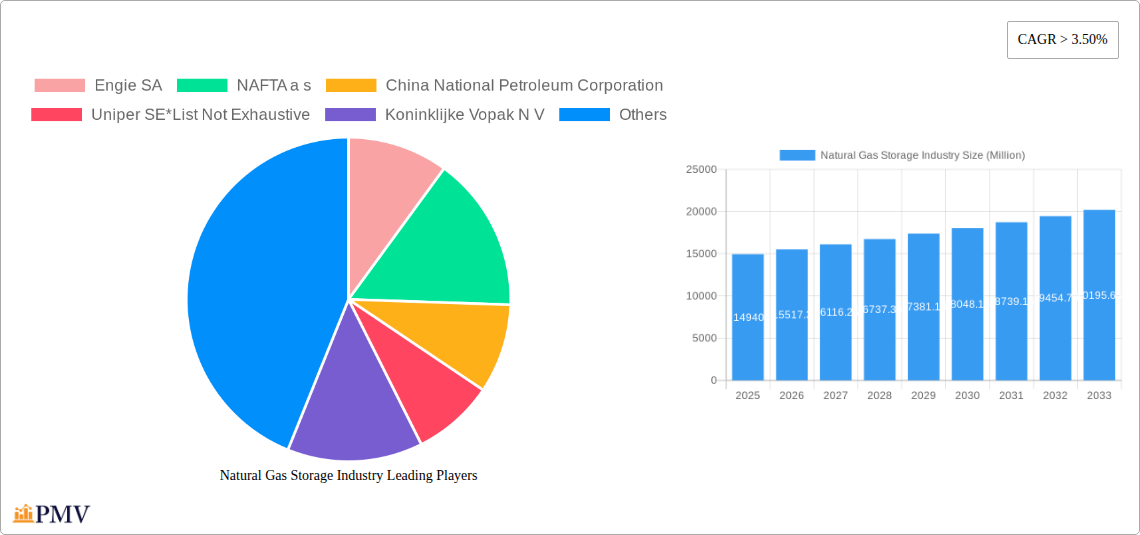
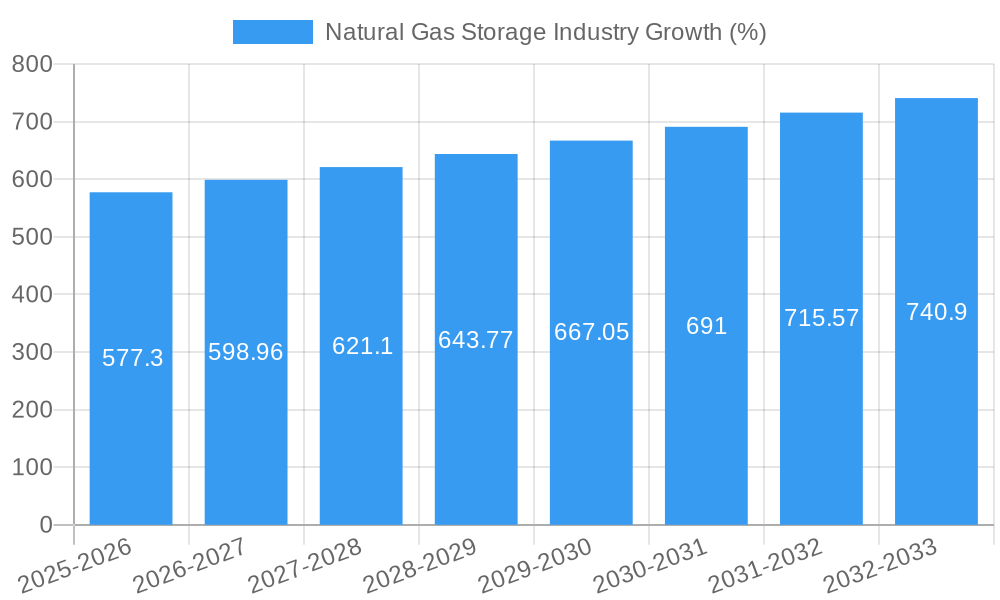
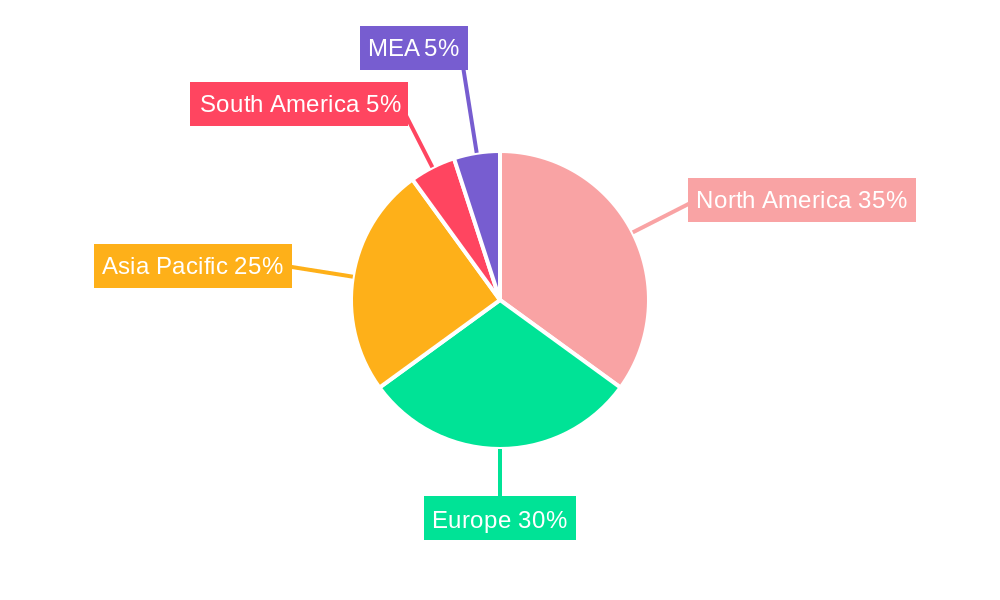
The global natural gas storage market, valued at $14.94 billion in 2025, is projected to experience robust growth, driven by increasing energy demand, particularly in rapidly developing economies, and the need for enhanced energy security. The compound annual growth rate (CAGR) exceeding 3.50% from 2025 to 2033 indicates a significant expansion of this market. Key drivers include the intermittent nature of renewable energy sources, necessitating reliable storage solutions to ensure grid stability. Furthermore, government regulations promoting energy diversification and the shift towards cleaner energy sources are indirectly fueling investment in natural gas storage infrastructure. The market is segmented by storage type, with underground storage dominating due to its higher capacity and lower cost per unit of gas stored. Above-ground storage, however, is gaining traction in regions with limited underground storage options. Major players such as Engie SA, China National Petroleum Corporation, and Vopak are actively involved in expanding their storage capacity and geographically diversifying their operations to capitalize on market growth opportunities. The regional distribution reflects the energy consumption patterns of various geographic areas, with North America and Europe currently holding significant market share. However, Asia-Pacific is predicted to witness substantial growth in the forecast period due to the rapid industrialization and urbanization in countries such as China and India.
Growth in the natural gas storage sector is also influenced by technological advancements, including the development of more efficient and cost-effective storage technologies, as well as improved monitoring and management systems. However, restraints include the high capital expenditure required for building and maintaining storage facilities, environmental concerns related to potential leaks and greenhouse gas emissions, and geopolitical factors influencing gas supply chains. The market's future depends on several factors such as the pace of renewable energy integration, government policies, and international energy collaborations. The ongoing transition towards a cleaner energy mix, while presenting challenges, also offers lucrative opportunities for natural gas as a bridging fuel, and consequently for gas storage infrastructure investment. The continued expansion of the global economy and the increasing demand for reliable and efficient energy solutions will continue to underpin the market's growth trajectory throughout the forecast period.
Natural Gas Storage Industry: A Comprehensive Market Report (2019-2033)
This in-depth report provides a comprehensive analysis of the Natural Gas Storage Industry, offering invaluable insights into market dynamics, competitive landscapes, and future growth projections. Covering the period from 2019 to 2033, with a base year of 2025 and a forecast period spanning 2025-2033, this report is essential for industry stakeholders seeking to navigate this evolving sector. The global market size in 2025 is estimated at $XX Million.
Natural Gas Storage Industry Market Structure & Competitive Dynamics
The natural gas storage industry exhibits a moderately concentrated market structure, with a few major players controlling a significant share of the global market. Key players include Engie SA, NAFTA a s, China National Petroleum Corporation, Uniper SE, Koninklijke Vopak N.V., Enbridge Inc, Chiyoda Corporation, John Wood Group PLC, Gazprom PAO, and Costain Group PLC. However, the market also features numerous smaller regional players. The industry is characterized by a dynamic interplay of factors such as mergers and acquisitions (M&A), technological innovation, and evolving regulatory frameworks.
M&A activities have significantly shaped the market landscape, with deal values exceeding $XX Million in recent years. These deals often involve strategic acquisitions aimed at expanding geographic reach, technological capabilities, or market share. Market concentration is influenced by factors such as economies of scale, access to capital, and technological expertise. Innovation ecosystems are fostered by collaborations between industry players, research institutions, and technology providers. Regulatory frameworks vary across different regions, impacting the profitability and competitiveness of storage providers. Product substitutes, such as compressed air energy storage (CAES), are emerging and could influence market dynamics over the long term. End-user trends, primarily driven by increasing demand for natural gas and the need for energy security, are shaping the growth trajectory of the industry.
Natural Gas Storage Industry Industry Trends & Insights
The natural gas storage industry is experiencing robust growth, driven by factors such as rising global energy demand, increased natural gas consumption, and the growing importance of energy security. The industry's Compound Annual Growth Rate (CAGR) during the forecast period (2025-2033) is projected at XX%, indicating significant expansion opportunities. Market penetration of advanced storage technologies is accelerating, driven by the need for improved efficiency, safety, and environmental sustainability. Technological disruptions, such as the integration of smart sensors and data analytics, are enhancing the operational efficiency of storage facilities. Consumer preferences are shifting towards environmentally friendly storage solutions, prompting investments in renewable energy integration and carbon capture technologies. The competitive landscape remains dynamic, with ongoing M&A activities and the emergence of new technological solutions continually reshaping the market.
Dominant Markets & Segments in Natural Gas Storage Industry
The natural gas storage market is geographically diverse, with significant growth across various regions. However, [Insert Region/Country Name] currently holds the dominant market position, driven by factors such as robust economic growth, favorable government policies, and well-established infrastructure.
Key Drivers of Dominance in [Insert Region/Country Name]:
- Strong economic growth fueling energy demand
- Favorable government regulations and incentives for natural gas storage
- Extensive pipeline infrastructure facilitating gas transportation and storage
- Significant investment in storage capacity expansion
Underground Storage: This segment dominates the market due to its higher storage capacity and cost-effectiveness compared to above-ground storage. The segment is further propelled by increasing investment in large-scale underground facilities in key gas-consuming regions.
Above-Ground Storage: This segment is characterized by smaller-scale facilities and serves localized demand. Growth in this segment is driven by the need for decentralized storage solutions and the increasing adoption of liquefied natural gas (LNG) storage technologies.
Natural Gas Storage Industry Product Innovations
Technological advancements are transforming the natural gas storage industry. Recent innovations include the development of advanced materials for storage tanks, improving durability and reducing environmental impact. Smart sensors and data analytics optimize storage operations, enhancing safety and efficiency. The integration of renewable energy sources, such as wind and solar, into storage systems is also gaining traction. These innovations provide competitive advantages by improving storage capacity, reducing operational costs, and enhancing environmental sustainability, leading to increased market penetration.
Report Segmentation & Scope
This report segments the natural gas storage market primarily by storage type:
Underground Storage: This segment encompasses various types of underground storage facilities, including depleted gas fields, aquifers, salt caverns, and mines. This segment is expected to witness significant growth during the forecast period due to its large storage capacity and cost-effectiveness. Competitive dynamics in this segment are driven by the availability of suitable geological formations and the investment needed for facility development.
Above-Ground Storage: This segment includes above-ground storage tanks, which are often used for smaller-scale storage applications or in locations where underground storage is not feasible. Growth in this segment is driven by the increasing adoption of LNG and compressed natural gas (CNG) technologies. Competitive dynamics are largely influenced by technology advancements, construction costs, and site availability.
Key Drivers of Natural Gas Storage Industry Growth
Several factors drive the growth of the natural gas storage industry. Firstly, the increasing demand for natural gas globally fuels the need for robust storage infrastructure to ensure supply reliability. Secondly, government initiatives promoting energy security and the diversification of energy sources are incentivizing investment in natural gas storage. Thirdly, technological advancements are leading to more efficient, cost-effective, and environmentally friendly storage solutions. Finally, the growing adoption of LNG and CNG technologies is creating new market opportunities in this sector.
Challenges in the Natural Gas Storage Industry Sector
The natural gas storage industry faces various challenges, including regulatory hurdles related to environmental permits and safety standards, potentially leading to project delays and increased costs. Supply chain disruptions, especially in the procurement of specialized materials and equipment, can impact project timelines and profitability. Moreover, intense competition from existing and emerging players demands continuous innovation and cost optimization to maintain market share. The overall impact of these challenges is estimated to reduce the market growth by approximately XX% during the forecast period.
Leading Players in the Natural Gas Storage Industry Market
- Engie SA
- NAFTA a s
- China National Petroleum Corporation
- Uniper SE
- Koninklijke Vopak N.V.
- Enbridge Inc
- Chiyoda Corporation
- John Wood Group PLC
- Gazprom PAO
- Costain Group PLC
Key Developments in Natural Gas Storage Industry Sector
- 2022 Q4: Engie SA announces a significant expansion of its underground gas storage capacity in [Location].
- 2023 Q1: New regulations implemented in [Region] to encourage the development of renewable energy integrated natural gas storage.
- 2023 Q2: Partnership formed between [Company A] and [Company B] to develop a next-generation LNG storage technology.
- 2024 Q1: China National Petroleum Corporation invests in new above-ground storage facilities to meet regional demand.
- 2024 Q3: Technological innovation in salt cavern storage improves efficiency by XX%.
Strategic Natural Gas Storage Industry Market Outlook
The future of the natural gas storage industry looks promising, driven by continued growth in natural gas demand, investments in infrastructure development, and ongoing technological innovation. Strategic opportunities lie in the development of next-generation storage technologies, expansion into new geographic markets, and the integration of renewable energy sources into storage systems. The industry will be shaped by the balance between meeting growing energy demands, ensuring energy security, and mitigating the environmental impact of natural gas consumption. The market is poised for continued growth, particularly in regions experiencing rapid economic growth and increasing demand for natural gas.
Natural Gas Storage Industry Segmentation
-
1. Type
- 1.1. Underground Storage
- 1.2. Above-Ground Storage
Natural Gas Storage Industry Segmentation By Geography
- 1. North America
- 2. Europe
- 3. Asia Pacific
- 4. South America
- 5. Middle East and Africa
Natural Gas Storage Industry REPORT HIGHLIGHTS
| Aspects | Details |
|---|---|
| Study Period | 2019-2033 |
| Base Year | 2024 |
| Estimated Year | 2025 |
| Forecast Period | 2025-2033 |
| Historical Period | 2019-2024 |
| Growth Rate | CAGR of > 3.50% from 2019-2033 |
| Segmentation |
|
Table of Contents
- 1. Introduction
- 1.1. Research Scope
- 1.2. Market Segmentation
- 1.3. Research Methodology
- 1.4. Definitions and Assumptions
- 2. Executive Summary
- 2.1. Introduction
- 3. Market Dynamics
- 3.1. Introduction
- 3.2. Market Drivers
- 3.2.1. 4.; Increasing Electricity Demand4.; Rsing Investments in the Coal Industry
- 3.3. Market Restrains
- 3.3.1. 4.; Increasing Installation of Renewable Energy Sources
- 3.4. Market Trends
- 3.4.1. Underground Storage to Dominate the Market
- 4. Market Factor Analysis
- 4.1. Porters Five Forces
- 4.2. Supply/Value Chain
- 4.3. PESTEL analysis
- 4.4. Market Entropy
- 4.5. Patent/Trademark Analysis
- 5. Global Natural Gas Storage Industry Analysis, Insights and Forecast, 2019-2031
- 5.1. Market Analysis, Insights and Forecast - by Type
- 5.1.1. Underground Storage
- 5.1.2. Above-Ground Storage
- 5.2. Market Analysis, Insights and Forecast - by Region
- 5.2.1. North America
- 5.2.2. Europe
- 5.2.3. Asia Pacific
- 5.2.4. South America
- 5.2.5. Middle East and Africa
- 5.1. Market Analysis, Insights and Forecast - by Type
- 6. North America Natural Gas Storage Industry Analysis, Insights and Forecast, 2019-2031
- 6.1. Market Analysis, Insights and Forecast - by Type
- 6.1.1. Underground Storage
- 6.1.2. Above-Ground Storage
- 6.1. Market Analysis, Insights and Forecast - by Type
- 7. Europe Natural Gas Storage Industry Analysis, Insights and Forecast, 2019-2031
- 7.1. Market Analysis, Insights and Forecast - by Type
- 7.1.1. Underground Storage
- 7.1.2. Above-Ground Storage
- 7.1. Market Analysis, Insights and Forecast - by Type
- 8. Asia Pacific Natural Gas Storage Industry Analysis, Insights and Forecast, 2019-2031
- 8.1. Market Analysis, Insights and Forecast - by Type
- 8.1.1. Underground Storage
- 8.1.2. Above-Ground Storage
- 8.1. Market Analysis, Insights and Forecast - by Type
- 9. South America Natural Gas Storage Industry Analysis, Insights and Forecast, 2019-2031
- 9.1. Market Analysis, Insights and Forecast - by Type
- 9.1.1. Underground Storage
- 9.1.2. Above-Ground Storage
- 9.1. Market Analysis, Insights and Forecast - by Type
- 10. Middle East and Africa Natural Gas Storage Industry Analysis, Insights and Forecast, 2019-2031
- 10.1. Market Analysis, Insights and Forecast - by Type
- 10.1.1. Underground Storage
- 10.1.2. Above-Ground Storage
- 10.1. Market Analysis, Insights and Forecast - by Type
- 11. North America Natural Gas Storage Industry Analysis, Insights and Forecast, 2019-2031
- 11.1. Market Analysis, Insights and Forecast - By Country/Sub-region
- 11.1.1 United States
- 11.1.2 Canada
- 11.1.3 Mexico
- 12. Europe Natural Gas Storage Industry Analysis, Insights and Forecast, 2019-2031
- 12.1. Market Analysis, Insights and Forecast - By Country/Sub-region
- 12.1.1 Germany
- 12.1.2 United Kingdom
- 12.1.3 France
- 12.1.4 Spain
- 12.1.5 Italy
- 12.1.6 Spain
- 12.1.7 Belgium
- 12.1.8 Netherland
- 12.1.9 Nordics
- 12.1.10 Rest of Europe
- 13. Asia Pacific Natural Gas Storage Industry Analysis, Insights and Forecast, 2019-2031
- 13.1. Market Analysis, Insights and Forecast - By Country/Sub-region
- 13.1.1 China
- 13.1.2 Japan
- 13.1.3 India
- 13.1.4 South Korea
- 13.1.5 Southeast Asia
- 13.1.6 Australia
- 13.1.7 Indonesia
- 13.1.8 Phillipes
- 13.1.9 Singapore
- 13.1.10 Thailandc
- 13.1.11 Rest of Asia Pacific
- 14. South America Natural Gas Storage Industry Analysis, Insights and Forecast, 2019-2031
- 14.1. Market Analysis, Insights and Forecast - By Country/Sub-region
- 14.1.1 Brazil
- 14.1.2 Argentina
- 14.1.3 Peru
- 14.1.4 Chile
- 14.1.5 Colombia
- 14.1.6 Ecuador
- 14.1.7 Venezuela
- 14.1.8 Rest of South America
- 15. North America Natural Gas Storage Industry Analysis, Insights and Forecast, 2019-2031
- 15.1. Market Analysis, Insights and Forecast - By Country/Sub-region
- 15.1.1 United States
- 15.1.2 Canada
- 15.1.3 Mexico
- 16. MEA Natural Gas Storage Industry Analysis, Insights and Forecast, 2019-2031
- 16.1. Market Analysis, Insights and Forecast - By Country/Sub-region
- 16.1.1 United Arab Emirates
- 16.1.2 Saudi Arabia
- 16.1.3 South Africa
- 16.1.4 Rest of Middle East and Africa
- 17. Competitive Analysis
- 17.1. Global Market Share Analysis 2024
- 17.2. Company Profiles
- 17.2.1 Engie SA
- 17.2.1.1. Overview
- 17.2.1.2. Products
- 17.2.1.3. SWOT Analysis
- 17.2.1.4. Recent Developments
- 17.2.1.5. Financials (Based on Availability)
- 17.2.2 NAFTA a s
- 17.2.2.1. Overview
- 17.2.2.2. Products
- 17.2.2.3. SWOT Analysis
- 17.2.2.4. Recent Developments
- 17.2.2.5. Financials (Based on Availability)
- 17.2.3 China National Petroleum Corporation
- 17.2.3.1. Overview
- 17.2.3.2. Products
- 17.2.3.3. SWOT Analysis
- 17.2.3.4. Recent Developments
- 17.2.3.5. Financials (Based on Availability)
- 17.2.4 Uniper SE*List Not Exhaustive
- 17.2.4.1. Overview
- 17.2.4.2. Products
- 17.2.4.3. SWOT Analysis
- 17.2.4.4. Recent Developments
- 17.2.4.5. Financials (Based on Availability)
- 17.2.5 Koninklijke Vopak N V
- 17.2.5.1. Overview
- 17.2.5.2. Products
- 17.2.5.3. SWOT Analysis
- 17.2.5.4. Recent Developments
- 17.2.5.5. Financials (Based on Availability)
- 17.2.6 Enbridge Inc
- 17.2.6.1. Overview
- 17.2.6.2. Products
- 17.2.6.3. SWOT Analysis
- 17.2.6.4. Recent Developments
- 17.2.6.5. Financials (Based on Availability)
- 17.2.7 Chiyoda Corporation
- 17.2.7.1. Overview
- 17.2.7.2. Products
- 17.2.7.3. SWOT Analysis
- 17.2.7.4. Recent Developments
- 17.2.7.5. Financials (Based on Availability)
- 17.2.8 John Wood Group PLC
- 17.2.8.1. Overview
- 17.2.8.2. Products
- 17.2.8.3. SWOT Analysis
- 17.2.8.4. Recent Developments
- 17.2.8.5. Financials (Based on Availability)
- 17.2.9 Gazprom PAO
- 17.2.9.1. Overview
- 17.2.9.2. Products
- 17.2.9.3. SWOT Analysis
- 17.2.9.4. Recent Developments
- 17.2.9.5. Financials (Based on Availability)
- 17.2.10 Costain Group PLC
- 17.2.10.1. Overview
- 17.2.10.2. Products
- 17.2.10.3. SWOT Analysis
- 17.2.10.4. Recent Developments
- 17.2.10.5. Financials (Based on Availability)
- 17.2.1 Engie SA
List of Figures
- Figure 1: Global Natural Gas Storage Industry Revenue Breakdown (Million, %) by Region 2024 & 2032
- Figure 2: Global Natural Gas Storage Industry Volume Breakdown (K Tons, %) by Region 2024 & 2032
- Figure 3: North America Natural Gas Storage Industry Revenue (Million), by Country 2024 & 2032
- Figure 4: North America Natural Gas Storage Industry Volume (K Tons), by Country 2024 & 2032
- Figure 5: North America Natural Gas Storage Industry Revenue Share (%), by Country 2024 & 2032
- Figure 6: North America Natural Gas Storage Industry Volume Share (%), by Country 2024 & 2032
- Figure 7: Europe Natural Gas Storage Industry Revenue (Million), by Country 2024 & 2032
- Figure 8: Europe Natural Gas Storage Industry Volume (K Tons), by Country 2024 & 2032
- Figure 9: Europe Natural Gas Storage Industry Revenue Share (%), by Country 2024 & 2032
- Figure 10: Europe Natural Gas Storage Industry Volume Share (%), by Country 2024 & 2032
- Figure 11: Asia Pacific Natural Gas Storage Industry Revenue (Million), by Country 2024 & 2032
- Figure 12: Asia Pacific Natural Gas Storage Industry Volume (K Tons), by Country 2024 & 2032
- Figure 13: Asia Pacific Natural Gas Storage Industry Revenue Share (%), by Country 2024 & 2032
- Figure 14: Asia Pacific Natural Gas Storage Industry Volume Share (%), by Country 2024 & 2032
- Figure 15: South America Natural Gas Storage Industry Revenue (Million), by Country 2024 & 2032
- Figure 16: South America Natural Gas Storage Industry Volume (K Tons), by Country 2024 & 2032
- Figure 17: South America Natural Gas Storage Industry Revenue Share (%), by Country 2024 & 2032
- Figure 18: South America Natural Gas Storage Industry Volume Share (%), by Country 2024 & 2032
- Figure 19: North America Natural Gas Storage Industry Revenue (Million), by Country 2024 & 2032
- Figure 20: North America Natural Gas Storage Industry Volume (K Tons), by Country 2024 & 2032
- Figure 21: North America Natural Gas Storage Industry Revenue Share (%), by Country 2024 & 2032
- Figure 22: North America Natural Gas Storage Industry Volume Share (%), by Country 2024 & 2032
- Figure 23: MEA Natural Gas Storage Industry Revenue (Million), by Country 2024 & 2032
- Figure 24: MEA Natural Gas Storage Industry Volume (K Tons), by Country 2024 & 2032
- Figure 25: MEA Natural Gas Storage Industry Revenue Share (%), by Country 2024 & 2032
- Figure 26: MEA Natural Gas Storage Industry Volume Share (%), by Country 2024 & 2032
- Figure 27: North America Natural Gas Storage Industry Revenue (Million), by Type 2024 & 2032
- Figure 28: North America Natural Gas Storage Industry Volume (K Tons), by Type 2024 & 2032
- Figure 29: North America Natural Gas Storage Industry Revenue Share (%), by Type 2024 & 2032
- Figure 30: North America Natural Gas Storage Industry Volume Share (%), by Type 2024 & 2032
- Figure 31: North America Natural Gas Storage Industry Revenue (Million), by Country 2024 & 2032
- Figure 32: North America Natural Gas Storage Industry Volume (K Tons), by Country 2024 & 2032
- Figure 33: North America Natural Gas Storage Industry Revenue Share (%), by Country 2024 & 2032
- Figure 34: North America Natural Gas Storage Industry Volume Share (%), by Country 2024 & 2032
- Figure 35: Europe Natural Gas Storage Industry Revenue (Million), by Type 2024 & 2032
- Figure 36: Europe Natural Gas Storage Industry Volume (K Tons), by Type 2024 & 2032
- Figure 37: Europe Natural Gas Storage Industry Revenue Share (%), by Type 2024 & 2032
- Figure 38: Europe Natural Gas Storage Industry Volume Share (%), by Type 2024 & 2032
- Figure 39: Europe Natural Gas Storage Industry Revenue (Million), by Country 2024 & 2032
- Figure 40: Europe Natural Gas Storage Industry Volume (K Tons), by Country 2024 & 2032
- Figure 41: Europe Natural Gas Storage Industry Revenue Share (%), by Country 2024 & 2032
- Figure 42: Europe Natural Gas Storage Industry Volume Share (%), by Country 2024 & 2032
- Figure 43: Asia Pacific Natural Gas Storage Industry Revenue (Million), by Type 2024 & 2032
- Figure 44: Asia Pacific Natural Gas Storage Industry Volume (K Tons), by Type 2024 & 2032
- Figure 45: Asia Pacific Natural Gas Storage Industry Revenue Share (%), by Type 2024 & 2032
- Figure 46: Asia Pacific Natural Gas Storage Industry Volume Share (%), by Type 2024 & 2032
- Figure 47: Asia Pacific Natural Gas Storage Industry Revenue (Million), by Country 2024 & 2032
- Figure 48: Asia Pacific Natural Gas Storage Industry Volume (K Tons), by Country 2024 & 2032
- Figure 49: Asia Pacific Natural Gas Storage Industry Revenue Share (%), by Country 2024 & 2032
- Figure 50: Asia Pacific Natural Gas Storage Industry Volume Share (%), by Country 2024 & 2032
- Figure 51: South America Natural Gas Storage Industry Revenue (Million), by Type 2024 & 2032
- Figure 52: South America Natural Gas Storage Industry Volume (K Tons), by Type 2024 & 2032
- Figure 53: South America Natural Gas Storage Industry Revenue Share (%), by Type 2024 & 2032
- Figure 54: South America Natural Gas Storage Industry Volume Share (%), by Type 2024 & 2032
- Figure 55: South America Natural Gas Storage Industry Revenue (Million), by Country 2024 & 2032
- Figure 56: South America Natural Gas Storage Industry Volume (K Tons), by Country 2024 & 2032
- Figure 57: South America Natural Gas Storage Industry Revenue Share (%), by Country 2024 & 2032
- Figure 58: South America Natural Gas Storage Industry Volume Share (%), by Country 2024 & 2032
- Figure 59: Middle East and Africa Natural Gas Storage Industry Revenue (Million), by Type 2024 & 2032
- Figure 60: Middle East and Africa Natural Gas Storage Industry Volume (K Tons), by Type 2024 & 2032
- Figure 61: Middle East and Africa Natural Gas Storage Industry Revenue Share (%), by Type 2024 & 2032
- Figure 62: Middle East and Africa Natural Gas Storage Industry Volume Share (%), by Type 2024 & 2032
- Figure 63: Middle East and Africa Natural Gas Storage Industry Revenue (Million), by Country 2024 & 2032
- Figure 64: Middle East and Africa Natural Gas Storage Industry Volume (K Tons), by Country 2024 & 2032
- Figure 65: Middle East and Africa Natural Gas Storage Industry Revenue Share (%), by Country 2024 & 2032
- Figure 66: Middle East and Africa Natural Gas Storage Industry Volume Share (%), by Country 2024 & 2032
List of Tables
- Table 1: Global Natural Gas Storage Industry Revenue Million Forecast, by Region 2019 & 2032
- Table 2: Global Natural Gas Storage Industry Volume K Tons Forecast, by Region 2019 & 2032
- Table 3: Global Natural Gas Storage Industry Revenue Million Forecast, by Type 2019 & 2032
- Table 4: Global Natural Gas Storage Industry Volume K Tons Forecast, by Type 2019 & 2032
- Table 5: Global Natural Gas Storage Industry Revenue Million Forecast, by Region 2019 & 2032
- Table 6: Global Natural Gas Storage Industry Volume K Tons Forecast, by Region 2019 & 2032
- Table 7: Global Natural Gas Storage Industry Revenue Million Forecast, by Country 2019 & 2032
- Table 8: Global Natural Gas Storage Industry Volume K Tons Forecast, by Country 2019 & 2032
- Table 9: United States Natural Gas Storage Industry Revenue (Million) Forecast, by Application 2019 & 2032
- Table 10: United States Natural Gas Storage Industry Volume (K Tons) Forecast, by Application 2019 & 2032
- Table 11: Canada Natural Gas Storage Industry Revenue (Million) Forecast, by Application 2019 & 2032
- Table 12: Canada Natural Gas Storage Industry Volume (K Tons) Forecast, by Application 2019 & 2032
- Table 13: Mexico Natural Gas Storage Industry Revenue (Million) Forecast, by Application 2019 & 2032
- Table 14: Mexico Natural Gas Storage Industry Volume (K Tons) Forecast, by Application 2019 & 2032
- Table 15: Global Natural Gas Storage Industry Revenue Million Forecast, by Country 2019 & 2032
- Table 16: Global Natural Gas Storage Industry Volume K Tons Forecast, by Country 2019 & 2032
- Table 17: Germany Natural Gas Storage Industry Revenue (Million) Forecast, by Application 2019 & 2032
- Table 18: Germany Natural Gas Storage Industry Volume (K Tons) Forecast, by Application 2019 & 2032
- Table 19: United Kingdom Natural Gas Storage Industry Revenue (Million) Forecast, by Application 2019 & 2032
- Table 20: United Kingdom Natural Gas Storage Industry Volume (K Tons) Forecast, by Application 2019 & 2032
- Table 21: France Natural Gas Storage Industry Revenue (Million) Forecast, by Application 2019 & 2032
- Table 22: France Natural Gas Storage Industry Volume (K Tons) Forecast, by Application 2019 & 2032
- Table 23: Spain Natural Gas Storage Industry Revenue (Million) Forecast, by Application 2019 & 2032
- Table 24: Spain Natural Gas Storage Industry Volume (K Tons) Forecast, by Application 2019 & 2032
- Table 25: Italy Natural Gas Storage Industry Revenue (Million) Forecast, by Application 2019 & 2032
- Table 26: Italy Natural Gas Storage Industry Volume (K Tons) Forecast, by Application 2019 & 2032
- Table 27: Spain Natural Gas Storage Industry Revenue (Million) Forecast, by Application 2019 & 2032
- Table 28: Spain Natural Gas Storage Industry Volume (K Tons) Forecast, by Application 2019 & 2032
- Table 29: Belgium Natural Gas Storage Industry Revenue (Million) Forecast, by Application 2019 & 2032
- Table 30: Belgium Natural Gas Storage Industry Volume (K Tons) Forecast, by Application 2019 & 2032
- Table 31: Netherland Natural Gas Storage Industry Revenue (Million) Forecast, by Application 2019 & 2032
- Table 32: Netherland Natural Gas Storage Industry Volume (K Tons) Forecast, by Application 2019 & 2032
- Table 33: Nordics Natural Gas Storage Industry Revenue (Million) Forecast, by Application 2019 & 2032
- Table 34: Nordics Natural Gas Storage Industry Volume (K Tons) Forecast, by Application 2019 & 2032
- Table 35: Rest of Europe Natural Gas Storage Industry Revenue (Million) Forecast, by Application 2019 & 2032
- Table 36: Rest of Europe Natural Gas Storage Industry Volume (K Tons) Forecast, by Application 2019 & 2032
- Table 37: Global Natural Gas Storage Industry Revenue Million Forecast, by Country 2019 & 2032
- Table 38: Global Natural Gas Storage Industry Volume K Tons Forecast, by Country 2019 & 2032
- Table 39: China Natural Gas Storage Industry Revenue (Million) Forecast, by Application 2019 & 2032
- Table 40: China Natural Gas Storage Industry Volume (K Tons) Forecast, by Application 2019 & 2032
- Table 41: Japan Natural Gas Storage Industry Revenue (Million) Forecast, by Application 2019 & 2032
- Table 42: Japan Natural Gas Storage Industry Volume (K Tons) Forecast, by Application 2019 & 2032
- Table 43: India Natural Gas Storage Industry Revenue (Million) Forecast, by Application 2019 & 2032
- Table 44: India Natural Gas Storage Industry Volume (K Tons) Forecast, by Application 2019 & 2032
- Table 45: South Korea Natural Gas Storage Industry Revenue (Million) Forecast, by Application 2019 & 2032
- Table 46: South Korea Natural Gas Storage Industry Volume (K Tons) Forecast, by Application 2019 & 2032
- Table 47: Southeast Asia Natural Gas Storage Industry Revenue (Million) Forecast, by Application 2019 & 2032
- Table 48: Southeast Asia Natural Gas Storage Industry Volume (K Tons) Forecast, by Application 2019 & 2032
- Table 49: Australia Natural Gas Storage Industry Revenue (Million) Forecast, by Application 2019 & 2032
- Table 50: Australia Natural Gas Storage Industry Volume (K Tons) Forecast, by Application 2019 & 2032
- Table 51: Indonesia Natural Gas Storage Industry Revenue (Million) Forecast, by Application 2019 & 2032
- Table 52: Indonesia Natural Gas Storage Industry Volume (K Tons) Forecast, by Application 2019 & 2032
- Table 53: Phillipes Natural Gas Storage Industry Revenue (Million) Forecast, by Application 2019 & 2032
- Table 54: Phillipes Natural Gas Storage Industry Volume (K Tons) Forecast, by Application 2019 & 2032
- Table 55: Singapore Natural Gas Storage Industry Revenue (Million) Forecast, by Application 2019 & 2032
- Table 56: Singapore Natural Gas Storage Industry Volume (K Tons) Forecast, by Application 2019 & 2032
- Table 57: Thailandc Natural Gas Storage Industry Revenue (Million) Forecast, by Application 2019 & 2032
- Table 58: Thailandc Natural Gas Storage Industry Volume (K Tons) Forecast, by Application 2019 & 2032
- Table 59: Rest of Asia Pacific Natural Gas Storage Industry Revenue (Million) Forecast, by Application 2019 & 2032
- Table 60: Rest of Asia Pacific Natural Gas Storage Industry Volume (K Tons) Forecast, by Application 2019 & 2032
- Table 61: Global Natural Gas Storage Industry Revenue Million Forecast, by Country 2019 & 2032
- Table 62: Global Natural Gas Storage Industry Volume K Tons Forecast, by Country 2019 & 2032
- Table 63: Brazil Natural Gas Storage Industry Revenue (Million) Forecast, by Application 2019 & 2032
- Table 64: Brazil Natural Gas Storage Industry Volume (K Tons) Forecast, by Application 2019 & 2032
- Table 65: Argentina Natural Gas Storage Industry Revenue (Million) Forecast, by Application 2019 & 2032
- Table 66: Argentina Natural Gas Storage Industry Volume (K Tons) Forecast, by Application 2019 & 2032
- Table 67: Peru Natural Gas Storage Industry Revenue (Million) Forecast, by Application 2019 & 2032
- Table 68: Peru Natural Gas Storage Industry Volume (K Tons) Forecast, by Application 2019 & 2032
- Table 69: Chile Natural Gas Storage Industry Revenue (Million) Forecast, by Application 2019 & 2032
- Table 70: Chile Natural Gas Storage Industry Volume (K Tons) Forecast, by Application 2019 & 2032
- Table 71: Colombia Natural Gas Storage Industry Revenue (Million) Forecast, by Application 2019 & 2032
- Table 72: Colombia Natural Gas Storage Industry Volume (K Tons) Forecast, by Application 2019 & 2032
- Table 73: Ecuador Natural Gas Storage Industry Revenue (Million) Forecast, by Application 2019 & 2032
- Table 74: Ecuador Natural Gas Storage Industry Volume (K Tons) Forecast, by Application 2019 & 2032
- Table 75: Venezuela Natural Gas Storage Industry Revenue (Million) Forecast, by Application 2019 & 2032
- Table 76: Venezuela Natural Gas Storage Industry Volume (K Tons) Forecast, by Application 2019 & 2032
- Table 77: Rest of South America Natural Gas Storage Industry Revenue (Million) Forecast, by Application 2019 & 2032
- Table 78: Rest of South America Natural Gas Storage Industry Volume (K Tons) Forecast, by Application 2019 & 2032
- Table 79: Global Natural Gas Storage Industry Revenue Million Forecast, by Country 2019 & 2032
- Table 80: Global Natural Gas Storage Industry Volume K Tons Forecast, by Country 2019 & 2032
- Table 81: United States Natural Gas Storage Industry Revenue (Million) Forecast, by Application 2019 & 2032
- Table 82: United States Natural Gas Storage Industry Volume (K Tons) Forecast, by Application 2019 & 2032
- Table 83: Canada Natural Gas Storage Industry Revenue (Million) Forecast, by Application 2019 & 2032
- Table 84: Canada Natural Gas Storage Industry Volume (K Tons) Forecast, by Application 2019 & 2032
- Table 85: Mexico Natural Gas Storage Industry Revenue (Million) Forecast, by Application 2019 & 2032
- Table 86: Mexico Natural Gas Storage Industry Volume (K Tons) Forecast, by Application 2019 & 2032
- Table 87: Global Natural Gas Storage Industry Revenue Million Forecast, by Country 2019 & 2032
- Table 88: Global Natural Gas Storage Industry Volume K Tons Forecast, by Country 2019 & 2032
- Table 89: United Arab Emirates Natural Gas Storage Industry Revenue (Million) Forecast, by Application 2019 & 2032
- Table 90: United Arab Emirates Natural Gas Storage Industry Volume (K Tons) Forecast, by Application 2019 & 2032
- Table 91: Saudi Arabia Natural Gas Storage Industry Revenue (Million) Forecast, by Application 2019 & 2032
- Table 92: Saudi Arabia Natural Gas Storage Industry Volume (K Tons) Forecast, by Application 2019 & 2032
- Table 93: South Africa Natural Gas Storage Industry Revenue (Million) Forecast, by Application 2019 & 2032
- Table 94: South Africa Natural Gas Storage Industry Volume (K Tons) Forecast, by Application 2019 & 2032
- Table 95: Rest of Middle East and Africa Natural Gas Storage Industry Revenue (Million) Forecast, by Application 2019 & 2032
- Table 96: Rest of Middle East and Africa Natural Gas Storage Industry Volume (K Tons) Forecast, by Application 2019 & 2032
- Table 97: Global Natural Gas Storage Industry Revenue Million Forecast, by Type 2019 & 2032
- Table 98: Global Natural Gas Storage Industry Volume K Tons Forecast, by Type 2019 & 2032
- Table 99: Global Natural Gas Storage Industry Revenue Million Forecast, by Country 2019 & 2032
- Table 100: Global Natural Gas Storage Industry Volume K Tons Forecast, by Country 2019 & 2032
- Table 101: Global Natural Gas Storage Industry Revenue Million Forecast, by Type 2019 & 2032
- Table 102: Global Natural Gas Storage Industry Volume K Tons Forecast, by Type 2019 & 2032
- Table 103: Global Natural Gas Storage Industry Revenue Million Forecast, by Country 2019 & 2032
- Table 104: Global Natural Gas Storage Industry Volume K Tons Forecast, by Country 2019 & 2032
- Table 105: Global Natural Gas Storage Industry Revenue Million Forecast, by Type 2019 & 2032
- Table 106: Global Natural Gas Storage Industry Volume K Tons Forecast, by Type 2019 & 2032
- Table 107: Global Natural Gas Storage Industry Revenue Million Forecast, by Country 2019 & 2032
- Table 108: Global Natural Gas Storage Industry Volume K Tons Forecast, by Country 2019 & 2032
- Table 109: Global Natural Gas Storage Industry Revenue Million Forecast, by Type 2019 & 2032
- Table 110: Global Natural Gas Storage Industry Volume K Tons Forecast, by Type 2019 & 2032
- Table 111: Global Natural Gas Storage Industry Revenue Million Forecast, by Country 2019 & 2032
- Table 112: Global Natural Gas Storage Industry Volume K Tons Forecast, by Country 2019 & 2032
- Table 113: Global Natural Gas Storage Industry Revenue Million Forecast, by Type 2019 & 2032
- Table 114: Global Natural Gas Storage Industry Volume K Tons Forecast, by Type 2019 & 2032
- Table 115: Global Natural Gas Storage Industry Revenue Million Forecast, by Country 2019 & 2032
- Table 116: Global Natural Gas Storage Industry Volume K Tons Forecast, by Country 2019 & 2032
Frequently Asked Questions
1. What is the projected Compound Annual Growth Rate (CAGR) of the Natural Gas Storage Industry?
The projected CAGR is approximately > 3.50%.
2. Which companies are prominent players in the Natural Gas Storage Industry?
Key companies in the market include Engie SA, NAFTA a s, China National Petroleum Corporation, Uniper SE*List Not Exhaustive, Koninklijke Vopak N V, Enbridge Inc, Chiyoda Corporation, John Wood Group PLC, Gazprom PAO, Costain Group PLC.
3. What are the main segments of the Natural Gas Storage Industry?
The market segments include Type.
4. Can you provide details about the market size?
The market size is estimated to be USD 14940 Million as of 2022.
5. What are some drivers contributing to market growth?
4.; Increasing Electricity Demand4.; Rsing Investments in the Coal Industry.
6. What are the notable trends driving market growth?
Underground Storage to Dominate the Market.
7. Are there any restraints impacting market growth?
4.; Increasing Installation of Renewable Energy Sources.
8. Can you provide examples of recent developments in the market?
Technological innovations in storage systems
9. What pricing options are available for accessing the report?
Pricing options include single-user, multi-user, and enterprise licenses priced at USD 4750, USD 5250, and USD 8750 respectively.
10. Is the market size provided in terms of value or volume?
The market size is provided in terms of value, measured in Million and volume, measured in K Tons.
11. Are there any specific market keywords associated with the report?
Yes, the market keyword associated with the report is "Natural Gas Storage Industry," which aids in identifying and referencing the specific market segment covered.
12. How do I determine which pricing option suits my needs best?
The pricing options vary based on user requirements and access needs. Individual users may opt for single-user licenses, while businesses requiring broader access may choose multi-user or enterprise licenses for cost-effective access to the report.
13. Are there any additional resources or data provided in the Natural Gas Storage Industry report?
While the report offers comprehensive insights, it's advisable to review the specific contents or supplementary materials provided to ascertain if additional resources or data are available.
14. How can I stay updated on further developments or reports in the Natural Gas Storage Industry?
To stay informed about further developments, trends, and reports in the Natural Gas Storage Industry, consider subscribing to industry newsletters, following relevant companies and organizations, or regularly checking reputable industry news sources and publications.
Methodology
Step 1 - Identification of Relevant Samples Size from Population Database


Step 2 - Approaches for Defining Global Market Size (Value, Volume* & Price*)

Note*: In applicable scenarios
Step 3 - Data Sources
Primary Research
- Web Analytics
- Survey Reports
- Research Institute
- Latest Research Reports
- Opinion Leaders
Secondary Research
- Annual Reports
- White Paper
- Latest Press Release
- Industry Association
- Paid Database
- Investor Presentations

Step 4 - Data Triangulation
Involves using different sources of information in order to increase the validity of a study
These sources are likely to be stakeholders in a program - participants, other researchers, program staff, other community members, and so on.
Then we put all data in single framework & apply various statistical tools to find out the dynamic on the market.
During the analysis stage, feedback from the stakeholder groups would be compared to determine areas of agreement as well as areas of divergence


