
Key Insights
The North American inertial systems market is experiencing robust growth, driven by increasing demand across diverse sectors. The market's expansion is fueled by several key factors. Firstly, the burgeoning civil aviation industry, with its focus on enhanced safety and navigation precision, is a significant driver. Secondly, the defense sector's continuous investment in advanced guidance and navigation systems for military applications contributes substantially to market growth. Thirdly, the rising adoption of inertial measurement units (IMUs) in consumer electronics, particularly smartphones and wearables, is a significant contributor. Furthermore, the automotive industry's integration of IMUs for advanced driver-assistance systems (ADAS) and autonomous driving functionalities is another key driver. The market is segmented by application (civil aviation, defense, consumer electronics, automotive, energy and infrastructure, medical, and other applications) and by component (accelerometer, gyroscope, IMU, magnetometer, attitude heading and navigation system, and other components). North America holds a significant market share due to its strong technological base, substantial R&D investments, and the presence of major players in the industry. Growth is projected to continue at a healthy pace, driven by technological advancements, rising demand for precision navigation, and the increasing adoption of automation across multiple sectors.
The competitive landscape is characterized by a mix of established players and emerging companies. Major industry players such as Rockwell Collins, Honeywell Aerospace, and Analog Devices hold substantial market share, leveraging their expertise and established customer bases. However, the market also features several innovative companies introducing novel technologies and solutions, contributing to increased competition and accelerating market growth. The forecast period (2025-2033) anticipates sustained expansion, influenced by ongoing technological advancements in sensor technology, the development of more compact and energy-efficient IMUs, and the integration of inertial systems with other technologies like GPS and GNSS for improved accuracy and reliability. Market segmentation analysis reveals that the IMU component segment holds the largest market share due to its widespread applications across numerous sectors. The civil aviation and defense applications currently dominate market share but growth in automotive and consumer electronics applications is expected to accelerate.
North America Inertial Systems Market Report: 2019-2033
This comprehensive report provides an in-depth analysis of the North America (NA) inertial systems market, offering valuable insights for stakeholders across the industry value chain. The study covers the period from 2019 to 2033, with 2025 as the base and estimated year. The report meticulously examines market segmentation, competitive dynamics, technological advancements, and future growth prospects, providing a holistic understanding of this dynamic sector. Market values are expressed in Millions.
NA Inertial Systems Market Structure & Competitive Dynamics
The NA inertial systems market exhibits a moderately concentrated structure, with several key players holding significant market share. The competitive landscape is characterized by intense rivalry, driven by continuous innovation, technological advancements, and strategic mergers and acquisitions (M&A). Key players leverage their expertise in accelerometer, gyroscope, IMU, and other component technologies to cater to diverse applications. Regulatory frameworks, particularly those concerning aerospace and defense, significantly influence market dynamics. The presence of substitute technologies, such as GPS and vision-based systems, adds further complexity to the competitive landscape. End-user trends, especially in the burgeoning autonomous vehicle and UAV sectors, are shaping demand patterns.
- Market Concentration: The top 5 players account for approximately xx% of the market share in 2025.
- Innovation Ecosystems: Strong R&D investments drive innovation in miniaturization, performance, and power efficiency.
- Regulatory Frameworks: Stringent safety and performance standards govern aerospace and defense applications.
- Product Substitutes: GPS and other navigation technologies pose a competitive threat.
- End-User Trends: Growing adoption of autonomous systems fuels market growth.
- M&A Activity: In recent years, M&A activity has been moderate, with deal values averaging approximately xx Million.
NA Inertial Systems Market Industry Trends & Insights
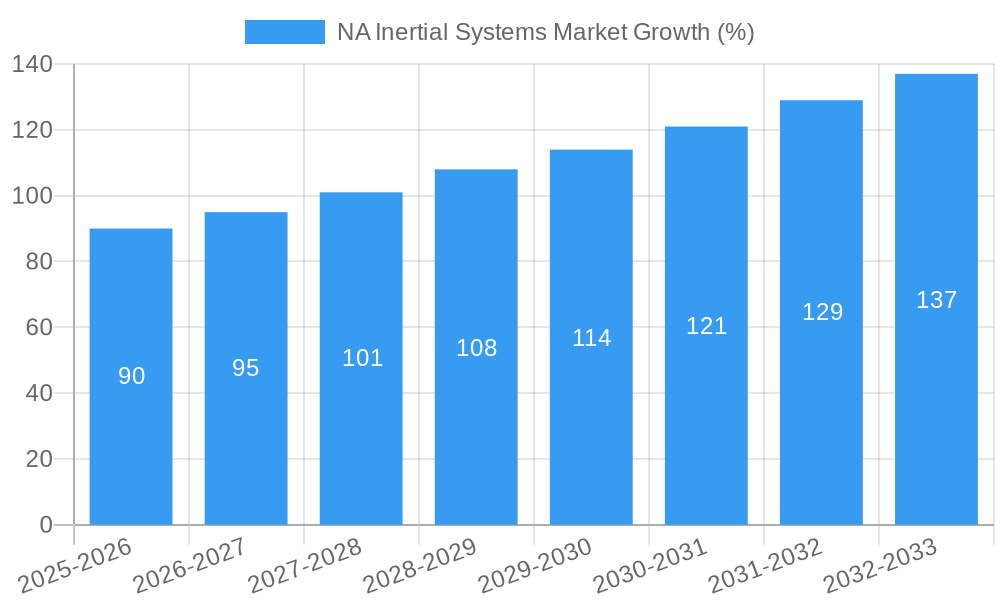
The NA inertial systems market is projected to witness robust growth during the forecast period (2025-2033), driven by a CAGR of xx%. Technological advancements such as the development of MEMS-based inertial sensors are enabling miniaturization, improved accuracy, and reduced costs. This has facilitated the penetration of inertial systems into diverse applications beyond traditional aerospace and defense sectors. Consumer electronics, automotive, and robotics are key growth drivers. Furthermore, increasing demand for high-precision navigation and positioning systems in autonomous vehicles and drones is significantly impacting market growth. The market penetration rate of inertial systems in automotive applications is expected to reach xx% by 2033.
Dominant Markets & Segments in NA Inertial Systems Market
The defense segment dominates the NA inertial systems market, driven by strong government spending on defense modernization programs and the increasing demand for precision-guided munitions. Within components, IMUs represent the largest segment due to their widespread use in various applications. The United States accounts for the largest market share within North America, followed by Canada and Mexico.
By Application:
- Defense: High demand for advanced navigation systems in military aircraft, missiles, and unmanned aerial vehicles (UAVs).
- Civil Aviation: Growing adoption of inertial navigation systems for improved flight safety and efficiency.
- Automotive: Rapid expansion of advanced driver-assistance systems (ADAS) and autonomous driving technologies.
- Consumer Electronics: Integration of inertial sensors in smartphones, wearable devices, and gaming consoles.
- Key Drivers: Stringent safety regulations, increasing demand for high-precision navigation, growing adoption of autonomous vehicles.
By Component:
- IMU: Dominates due to its use in various applications requiring combined acceleration and angular rate measurements.
- Accelerometer: High demand from consumer electronics and automotive sectors.
- Gyroscope: Crucial component for attitude and heading determination in various applications.
- Magnetometer: Widely used for compass applications and heading determination.
- Key Drivers: Advancements in MEMS technology, decreasing cost and size of inertial sensors.
NA Inertial Systems Market Product Innovations
Recent years have witnessed significant innovations in inertial systems, focusing on enhanced accuracy, miniaturization, and lower power consumption. MEMS-based inertial sensors have revolutionized the market, leading to smaller, lighter, and more cost-effective systems. The development of advanced algorithms for data fusion and improved sensor integration has also significantly contributed to enhancing overall system performance and reliability. Furthermore, new applications are emerging such as improved navigation capabilities in GNSS-denied environments, driving further innovation in the field.
Report Segmentation & Scope
This report segments the NA inertial systems market by application (Civil Aviation, Defense, Consumer Electronics, Automotive, Energy and Infrastructure, Medical, Other Applications) and by component (Accelerometer, Gyroscope, IMU, Magnetometer, Attitude Heading and Navigation System, Other Components). Each segment is analyzed based on its market size, growth rate, and key players. The report provides detailed forecasts for each segment for the period 2025-2033, offering valuable insights into future market trends and opportunities.
Key Drivers of NA Inertial Systems Market Growth
The NA inertial systems market is propelled by several key factors, including increasing demand for precise navigation and positioning in various applications, rising adoption of autonomous systems (e.g., self-driving cars, drones), advancements in MEMS technology leading to smaller, cheaper sensors, and continued investments in defense modernization programs. Government regulations supporting the development and adoption of advanced navigation technologies in critical infrastructure further fuel market growth.
Challenges in the NA Inertial Systems Market Sector
Despite the positive outlook, the NA inertial systems market faces certain challenges, including the high cost of advanced inertial systems, the presence of substitute technologies (e.g., GPS), stringent safety regulations and certification processes, and potential supply chain disruptions. Furthermore, intense competition among established players and emerging market entrants poses a constant challenge for maintaining profitability.
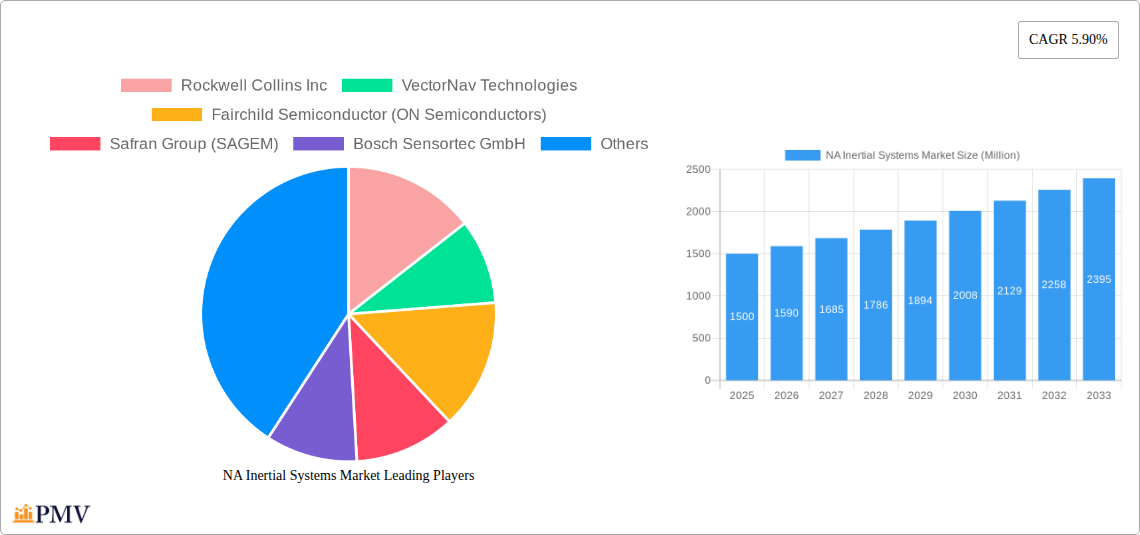
Leading Players in the NA Inertial Systems Market Market
- Rockwell Collins Inc
- VectorNav Technologies
- Fairchild Semiconductor (ON Semiconductors)
- Safran Group (SAGEM)
- Bosch Sensortec GmbH
- Moog Inc
- Thales Group
- STMicroelectronics NV
- Meggitt PLC
- Analog Devices Inc
- Honeywell Aerospace Inc
- InvenSense Inc
- Northrop Grumman Corporation
Key Developments in NA Inertial Systems Market Sector
- January 2023: Inertial Labs launched an upgraded "INS-U" GPS-Aided Inertial Navigation System, enhancing high-dynamic applications and enabling navigation in GNSS-denied environments.
- July 2022: TT Electronics secured a Letter of Authority from Honeywell Aerospace to design a new power supply for next-generation inertial navigation units.
Strategic NA Inertial Systems Market Outlook
The future of the NA inertial systems market appears bright, with continued growth expected across various applications. Strategic opportunities lie in developing advanced sensor fusion algorithms, exploring new applications in emerging technologies (e.g., robotics, IoT), and focusing on miniaturization and power efficiency. Companies focusing on innovation and strategic partnerships will be well-positioned to capture significant market share in the years to come.
NA Inertial Systems Market Segmentation
-
1. Application
- 1.1. Civil Aviation
- 1.2. Defense
- 1.3. Consumer Electronics
- 1.4. Automotive
- 1.5. Energy and Infrastructure
- 1.6. Medical
- 1.7. Other Applications
-
2. Component
- 2.1. Accelerometer
- 2.2. Gyroscope
- 2.3. IMU
- 2.4. Magnetometer
- 2.5. Attitude Heading and Navigation System
- 2.6. Other Components
-
3. Geography
- 3.1. United States
- 3.2. Canada
NA Inertial Systems Market Segmentation By Geography
- 1. United States
- 2. Canada
NA Inertial Systems Market REPORT HIGHLIGHTS
| Aspects | Details |
|---|---|
| Study Period | 2019-2033 |
| Base Year | 2024 |
| Estimated Year | 2025 |
| Forecast Period | 2025-2033 |
| Historical Period | 2019-2024 |
| Growth Rate | CAGR of 5.90% from 2019-2033 |
| Segmentation |
|
Table of Contents
- 1. Introduction
- 1.1. Research Scope
- 1.2. Market Segmentation
- 1.3. Research Methodology
- 1.4. Definitions and Assumptions
- 2. Executive Summary
- 2.1. Introduction
- 3. Market Dynamics
- 3.1. Introduction
- 3.2. Market Drivers
- 3.2.1. Emergence of MEMS Technology; Inclination of Growth Toward Defense and Aerospace; Technological Advancements in Navigation Systems
- 3.3. Market Restrains
- 3.3.1. Operational Complexity and High Maintenance Costs
- 3.4. Market Trends
- 3.4.1. Increasing Demand in Accuracy to Drive the Market
- 4. Market Factor Analysis
- 4.1. Porters Five Forces
- 4.2. Supply/Value Chain
- 4.3. PESTEL analysis
- 4.4. Market Entropy
- 4.5. Patent/Trademark Analysis
- 5. Global NA Inertial Systems Market Analysis, Insights and Forecast, 2019-2031
- 5.1. Market Analysis, Insights and Forecast - by Application
- 5.1.1. Civil Aviation
- 5.1.2. Defense
- 5.1.3. Consumer Electronics
- 5.1.4. Automotive
- 5.1.5. Energy and Infrastructure
- 5.1.6. Medical
- 5.1.7. Other Applications
- 5.2. Market Analysis, Insights and Forecast - by Component
- 5.2.1. Accelerometer
- 5.2.2. Gyroscope
- 5.2.3. IMU
- 5.2.4. Magnetometer
- 5.2.5. Attitude Heading and Navigation System
- 5.2.6. Other Components
- 5.3. Market Analysis, Insights and Forecast - by Geography
- 5.3.1. United States
- 5.3.2. Canada
- 5.4. Market Analysis, Insights and Forecast - by Region
- 5.4.1. United States
- 5.4.2. Canada
- 5.1. Market Analysis, Insights and Forecast - by Application
- 6. United States NA Inertial Systems Market Analysis, Insights and Forecast, 2019-2031
- 6.1. Market Analysis, Insights and Forecast - by Application
- 6.1.1. Civil Aviation
- 6.1.2. Defense
- 6.1.3. Consumer Electronics
- 6.1.4. Automotive
- 6.1.5. Energy and Infrastructure
- 6.1.6. Medical
- 6.1.7. Other Applications
- 6.2. Market Analysis, Insights and Forecast - by Component
- 6.2.1. Accelerometer
- 6.2.2. Gyroscope
- 6.2.3. IMU
- 6.2.4. Magnetometer
- 6.2.5. Attitude Heading and Navigation System
- 6.2.6. Other Components
- 6.3. Market Analysis, Insights and Forecast - by Geography
- 6.3.1. United States
- 6.3.2. Canada
- 6.1. Market Analysis, Insights and Forecast - by Application
- 7. Canada NA Inertial Systems Market Analysis, Insights and Forecast, 2019-2031
- 7.1. Market Analysis, Insights and Forecast - by Application
- 7.1.1. Civil Aviation
- 7.1.2. Defense
- 7.1.3. Consumer Electronics
- 7.1.4. Automotive
- 7.1.5. Energy and Infrastructure
- 7.1.6. Medical
- 7.1.7. Other Applications
- 7.2. Market Analysis, Insights and Forecast - by Component
- 7.2.1. Accelerometer
- 7.2.2. Gyroscope
- 7.2.3. IMU
- 7.2.4. Magnetometer
- 7.2.5. Attitude Heading and Navigation System
- 7.2.6. Other Components
- 7.3. Market Analysis, Insights and Forecast - by Geography
- 7.3.1. United States
- 7.3.2. Canada
- 7.1. Market Analysis, Insights and Forecast - by Application
- 8. North America NA Inertial Systems Market Analysis, Insights and Forecast, 2019-2031
- 8.1. Market Analysis, Insights and Forecast - By Country/Sub-region
- 8.1.1 United States
- 8.1.2 Canada
- 8.1.3 Mexico
- 9. Europe NA Inertial Systems Market Analysis, Insights and Forecast, 2019-2031
- 9.1. Market Analysis, Insights and Forecast - By Country/Sub-region
- 9.1.1 Germany
- 9.1.2 United Kingdom
- 9.1.3 France
- 9.1.4 Spain
- 9.1.5 Italy
- 9.1.6 Spain
- 9.1.7 Belgium
- 9.1.8 Netherland
- 9.1.9 Nordics
- 9.1.10 Rest of Europe
- 10. Asia Pacific NA Inertial Systems Market Analysis, Insights and Forecast, 2019-2031
- 10.1. Market Analysis, Insights and Forecast - By Country/Sub-region
- 10.1.1 China
- 10.1.2 Japan
- 10.1.3 India
- 10.1.4 South Korea
- 10.1.5 Southeast Asia
- 10.1.6 Australia
- 10.1.7 Indonesia
- 10.1.8 Phillipes
- 10.1.9 Singapore
- 10.1.10 Thailandc
- 10.1.11 Rest of Asia Pacific
- 11. South America NA Inertial Systems Market Analysis, Insights and Forecast, 2019-2031
- 11.1. Market Analysis, Insights and Forecast - By Country/Sub-region
- 11.1.1 Brazil
- 11.1.2 Argentina
- 11.1.3 Peru
- 11.1.4 Chile
- 11.1.5 Colombia
- 11.1.6 Ecuador
- 11.1.7 Venezuela
- 11.1.8 Rest of South America
- 12. North America NA Inertial Systems Market Analysis, Insights and Forecast, 2019-2031
- 12.1. Market Analysis, Insights and Forecast - By Country/Sub-region
- 12.1.1 United States
- 12.1.2 Canada
- 12.1.3 Mexico
- 13. MEA NA Inertial Systems Market Analysis, Insights and Forecast, 2019-2031
- 13.1. Market Analysis, Insights and Forecast - By Country/Sub-region
- 13.1.1 United Arab Emirates
- 13.1.2 Saudi Arabia
- 13.1.3 South Africa
- 13.1.4 Rest of Middle East and Africa
- 14. Competitive Analysis
- 14.1. Global Market Share Analysis 2024
- 14.2. Company Profiles
- 14.2.1 Rockwell Collins Inc
- 14.2.1.1. Overview
- 14.2.1.2. Products
- 14.2.1.3. SWOT Analysis
- 14.2.1.4. Recent Developments
- 14.2.1.5. Financials (Based on Availability)
- 14.2.2 VectorNav Technologies
- 14.2.2.1. Overview
- 14.2.2.2. Products
- 14.2.2.3. SWOT Analysis
- 14.2.2.4. Recent Developments
- 14.2.2.5. Financials (Based on Availability)
- 14.2.3 Fairchild Semiconductor (ON Semiconductors)
- 14.2.3.1. Overview
- 14.2.3.2. Products
- 14.2.3.3. SWOT Analysis
- 14.2.3.4. Recent Developments
- 14.2.3.5. Financials (Based on Availability)
- 14.2.4 Safran Group (SAGEM)
- 14.2.4.1. Overview
- 14.2.4.2. Products
- 14.2.4.3. SWOT Analysis
- 14.2.4.4. Recent Developments
- 14.2.4.5. Financials (Based on Availability)
- 14.2.5 Bosch Sensortec GmbH
- 14.2.5.1. Overview
- 14.2.5.2. Products
- 14.2.5.3. SWOT Analysis
- 14.2.5.4. Recent Developments
- 14.2.5.5. Financials (Based on Availability)
- 14.2.6 Moog Inc
- 14.2.6.1. Overview
- 14.2.6.2. Products
- 14.2.6.3. SWOT Analysis
- 14.2.6.4. Recent Developments
- 14.2.6.5. Financials (Based on Availability)
- 14.2.7 Thales Group
- 14.2.7.1. Overview
- 14.2.7.2. Products
- 14.2.7.3. SWOT Analysis
- 14.2.7.4. Recent Developments
- 14.2.7.5. Financials (Based on Availability)
- 14.2.8 STMicroelectronics NV
- 14.2.8.1. Overview
- 14.2.8.2. Products
- 14.2.8.3. SWOT Analysis
- 14.2.8.4. Recent Developments
- 14.2.8.5. Financials (Based on Availability)
- 14.2.9 Meggitt PLC*List Not Exhaustive
- 14.2.9.1. Overview
- 14.2.9.2. Products
- 14.2.9.3. SWOT Analysis
- 14.2.9.4. Recent Developments
- 14.2.9.5. Financials (Based on Availability)
- 14.2.10 Analog Devices Inc
- 14.2.10.1. Overview
- 14.2.10.2. Products
- 14.2.10.3. SWOT Analysis
- 14.2.10.4. Recent Developments
- 14.2.10.5. Financials (Based on Availability)
- 14.2.11 Honeywell Aerospace Inc
- 14.2.11.1. Overview
- 14.2.11.2. Products
- 14.2.11.3. SWOT Analysis
- 14.2.11.4. Recent Developments
- 14.2.11.5. Financials (Based on Availability)
- 14.2.12 InvenSense Inc
- 14.2.12.1. Overview
- 14.2.12.2. Products
- 14.2.12.3. SWOT Analysis
- 14.2.12.4. Recent Developments
- 14.2.12.5. Financials (Based on Availability)
- 14.2.13 Northrop Grumman Corporation
- 14.2.13.1. Overview
- 14.2.13.2. Products
- 14.2.13.3. SWOT Analysis
- 14.2.13.4. Recent Developments
- 14.2.13.5. Financials (Based on Availability)
- 14.2.1 Rockwell Collins Inc
List of Figures
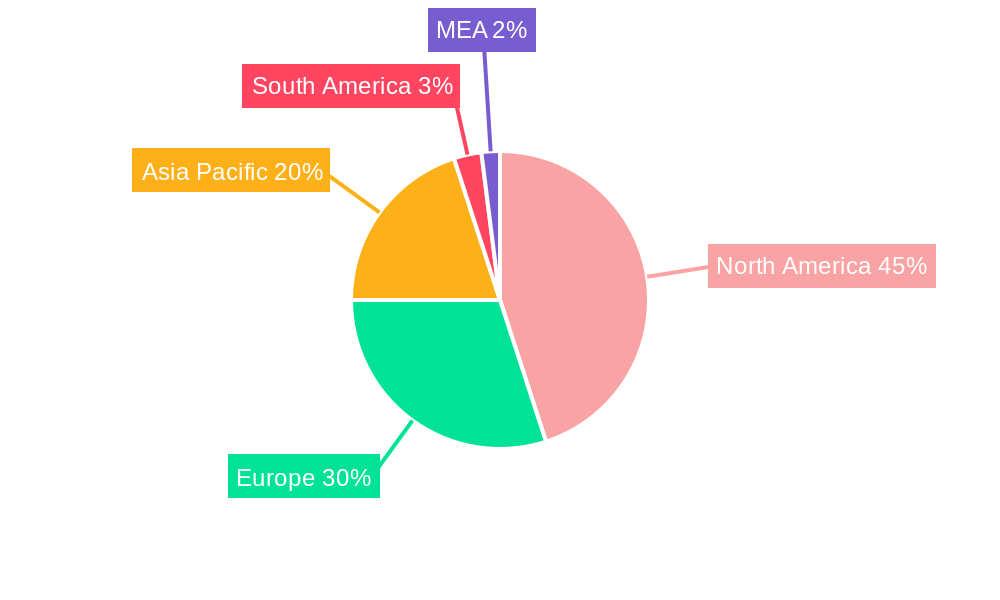
- Figure 1: Global NA Inertial Systems Market Revenue Breakdown (Million, %) by Region 2024 & 2032
- Figure 2: North America NA Inertial Systems Market Revenue (Million), by Country 2024 & 2032
- Figure 3: North America NA Inertial Systems Market Revenue Share (%), by Country 2024 & 2032
- Figure 4: Europe NA Inertial Systems Market Revenue (Million), by Country 2024 & 2032
- Figure 5: Europe NA Inertial Systems Market Revenue Share (%), by Country 2024 & 2032
- Figure 6: Asia Pacific NA Inertial Systems Market Revenue (Million), by Country 2024 & 2032
- Figure 7: Asia Pacific NA Inertial Systems Market Revenue Share (%), by Country 2024 & 2032
- Figure 8: South America NA Inertial Systems Market Revenue (Million), by Country 2024 & 2032
- Figure 9: South America NA Inertial Systems Market Revenue Share (%), by Country 2024 & 2032
- Figure 10: North America NA Inertial Systems Market Revenue (Million), by Country 2024 & 2032
- Figure 11: North America NA Inertial Systems Market Revenue Share (%), by Country 2024 & 2032
- Figure 12: MEA NA Inertial Systems Market Revenue (Million), by Country 2024 & 2032
- Figure 13: MEA NA Inertial Systems Market Revenue Share (%), by Country 2024 & 2032
- Figure 14: United States NA Inertial Systems Market Revenue (Million), by Application 2024 & 2032
- Figure 15: United States NA Inertial Systems Market Revenue Share (%), by Application 2024 & 2032
- Figure 16: United States NA Inertial Systems Market Revenue (Million), by Component 2024 & 2032
- Figure 17: United States NA Inertial Systems Market Revenue Share (%), by Component 2024 & 2032
- Figure 18: United States NA Inertial Systems Market Revenue (Million), by Geography 2024 & 2032
- Figure 19: United States NA Inertial Systems Market Revenue Share (%), by Geography 2024 & 2032
- Figure 20: United States NA Inertial Systems Market Revenue (Million), by Country 2024 & 2032
- Figure 21: United States NA Inertial Systems Market Revenue Share (%), by Country 2024 & 2032
- Figure 22: Canada NA Inertial Systems Market Revenue (Million), by Application 2024 & 2032
- Figure 23: Canada NA Inertial Systems Market Revenue Share (%), by Application 2024 & 2032
- Figure 24: Canada NA Inertial Systems Market Revenue (Million), by Component 2024 & 2032
- Figure 25: Canada NA Inertial Systems Market Revenue Share (%), by Component 2024 & 2032
- Figure 26: Canada NA Inertial Systems Market Revenue (Million), by Geography 2024 & 2032
- Figure 27: Canada NA Inertial Systems Market Revenue Share (%), by Geography 2024 & 2032
- Figure 28: Canada NA Inertial Systems Market Revenue (Million), by Country 2024 & 2032
- Figure 29: Canada NA Inertial Systems Market Revenue Share (%), by Country 2024 & 2032
List of Tables
- Table 1: Global NA Inertial Systems Market Revenue Million Forecast, by Region 2019 & 2032
- Table 2: Global NA Inertial Systems Market Revenue Million Forecast, by Application 2019 & 2032
- Table 3: Global NA Inertial Systems Market Revenue Million Forecast, by Component 2019 & 2032
- Table 4: Global NA Inertial Systems Market Revenue Million Forecast, by Geography 2019 & 2032
- Table 5: Global NA Inertial Systems Market Revenue Million Forecast, by Region 2019 & 2032
- Table 6: Global NA Inertial Systems Market Revenue Million Forecast, by Country 2019 & 2032
- Table 7: United States NA Inertial Systems Market Revenue (Million) Forecast, by Application 2019 & 2032
- Table 8: Canada NA Inertial Systems Market Revenue (Million) Forecast, by Application 2019 & 2032
- Table 9: Mexico NA Inertial Systems Market Revenue (Million) Forecast, by Application 2019 & 2032
- Table 10: Global NA Inertial Systems Market Revenue Million Forecast, by Country 2019 & 2032
- Table 11: Germany NA Inertial Systems Market Revenue (Million) Forecast, by Application 2019 & 2032
- Table 12: United Kingdom NA Inertial Systems Market Revenue (Million) Forecast, by Application 2019 & 2032
- Table 13: France NA Inertial Systems Market Revenue (Million) Forecast, by Application 2019 & 2032
- Table 14: Spain NA Inertial Systems Market Revenue (Million) Forecast, by Application 2019 & 2032
- Table 15: Italy NA Inertial Systems Market Revenue (Million) Forecast, by Application 2019 & 2032
- Table 16: Spain NA Inertial Systems Market Revenue (Million) Forecast, by Application 2019 & 2032
- Table 17: Belgium NA Inertial Systems Market Revenue (Million) Forecast, by Application 2019 & 2032
- Table 18: Netherland NA Inertial Systems Market Revenue (Million) Forecast, by Application 2019 & 2032
- Table 19: Nordics NA Inertial Systems Market Revenue (Million) Forecast, by Application 2019 & 2032
- Table 20: Rest of Europe NA Inertial Systems Market Revenue (Million) Forecast, by Application 2019 & 2032
- Table 21: Global NA Inertial Systems Market Revenue Million Forecast, by Country 2019 & 2032
- Table 22: China NA Inertial Systems Market Revenue (Million) Forecast, by Application 2019 & 2032
- Table 23: Japan NA Inertial Systems Market Revenue (Million) Forecast, by Application 2019 & 2032
- Table 24: India NA Inertial Systems Market Revenue (Million) Forecast, by Application 2019 & 2032
- Table 25: South Korea NA Inertial Systems Market Revenue (Million) Forecast, by Application 2019 & 2032
- Table 26: Southeast Asia NA Inertial Systems Market Revenue (Million) Forecast, by Application 2019 & 2032
- Table 27: Australia NA Inertial Systems Market Revenue (Million) Forecast, by Application 2019 & 2032
- Table 28: Indonesia NA Inertial Systems Market Revenue (Million) Forecast, by Application 2019 & 2032
- Table 29: Phillipes NA Inertial Systems Market Revenue (Million) Forecast, by Application 2019 & 2032
- Table 30: Singapore NA Inertial Systems Market Revenue (Million) Forecast, by Application 2019 & 2032
- Table 31: Thailandc NA Inertial Systems Market Revenue (Million) Forecast, by Application 2019 & 2032
- Table 32: Rest of Asia Pacific NA Inertial Systems Market Revenue (Million) Forecast, by Application 2019 & 2032
- Table 33: Global NA Inertial Systems Market Revenue Million Forecast, by Country 2019 & 2032
- Table 34: Brazil NA Inertial Systems Market Revenue (Million) Forecast, by Application 2019 & 2032
- Table 35: Argentina NA Inertial Systems Market Revenue (Million) Forecast, by Application 2019 & 2032
- Table 36: Peru NA Inertial Systems Market Revenue (Million) Forecast, by Application 2019 & 2032
- Table 37: Chile NA Inertial Systems Market Revenue (Million) Forecast, by Application 2019 & 2032
- Table 38: Colombia NA Inertial Systems Market Revenue (Million) Forecast, by Application 2019 & 2032
- Table 39: Ecuador NA Inertial Systems Market Revenue (Million) Forecast, by Application 2019 & 2032
- Table 40: Venezuela NA Inertial Systems Market Revenue (Million) Forecast, by Application 2019 & 2032
- Table 41: Rest of South America NA Inertial Systems Market Revenue (Million) Forecast, by Application 2019 & 2032
- Table 42: Global NA Inertial Systems Market Revenue Million Forecast, by Country 2019 & 2032
- Table 43: United States NA Inertial Systems Market Revenue (Million) Forecast, by Application 2019 & 2032
- Table 44: Canada NA Inertial Systems Market Revenue (Million) Forecast, by Application 2019 & 2032
- Table 45: Mexico NA Inertial Systems Market Revenue (Million) Forecast, by Application 2019 & 2032
- Table 46: Global NA Inertial Systems Market Revenue Million Forecast, by Country 2019 & 2032
- Table 47: United Arab Emirates NA Inertial Systems Market Revenue (Million) Forecast, by Application 2019 & 2032
- Table 48: Saudi Arabia NA Inertial Systems Market Revenue (Million) Forecast, by Application 2019 & 2032
- Table 49: South Africa NA Inertial Systems Market Revenue (Million) Forecast, by Application 2019 & 2032
- Table 50: Rest of Middle East and Africa NA Inertial Systems Market Revenue (Million) Forecast, by Application 2019 & 2032
- Table 51: Global NA Inertial Systems Market Revenue Million Forecast, by Application 2019 & 2032
- Table 52: Global NA Inertial Systems Market Revenue Million Forecast, by Component 2019 & 2032
- Table 53: Global NA Inertial Systems Market Revenue Million Forecast, by Geography 2019 & 2032
- Table 54: Global NA Inertial Systems Market Revenue Million Forecast, by Country 2019 & 2032
- Table 55: Global NA Inertial Systems Market Revenue Million Forecast, by Application 2019 & 2032
- Table 56: Global NA Inertial Systems Market Revenue Million Forecast, by Component 2019 & 2032
- Table 57: Global NA Inertial Systems Market Revenue Million Forecast, by Geography 2019 & 2032
- Table 58: Global NA Inertial Systems Market Revenue Million Forecast, by Country 2019 & 2032
Frequently Asked Questions
1. What is the projected Compound Annual Growth Rate (CAGR) of the NA Inertial Systems Market?
The projected CAGR is approximately 5.90%.
2. Which companies are prominent players in the NA Inertial Systems Market?
Key companies in the market include Rockwell Collins Inc, VectorNav Technologies, Fairchild Semiconductor (ON Semiconductors), Safran Group (SAGEM), Bosch Sensortec GmbH, Moog Inc, Thales Group, STMicroelectronics NV, Meggitt PLC*List Not Exhaustive, Analog Devices Inc, Honeywell Aerospace Inc, InvenSense Inc, Northrop Grumman Corporation.
3. What are the main segments of the NA Inertial Systems Market?
The market segments include Application, Component, Geography.
4. Can you provide details about the market size?
The market size is estimated to be USD XX Million as of 2022.
5. What are some drivers contributing to market growth?
Emergence of MEMS Technology; Inclination of Growth Toward Defense and Aerospace; Technological Advancements in Navigation Systems.
6. What are the notable trends driving market growth?
Increasing Demand in Accuracy to Drive the Market.
7. Are there any restraints impacting market growth?
Operational Complexity and High Maintenance Costs.
8. Can you provide examples of recent developments in the market?
January 2023 - Inertial Labs released an upgraded version of the "INS-U" GPS-Aided Inertial Navigation System and an extended version of the Differential Pressure Sensor and Embedded Air Data Computer, allowing the unit to measure airspeed with up to 600 KNOTS to enhance high dynamic applications. This new INS-U version can send fused (GNSS + IMU) NMEA data to Pixhawk Autopilot, allowing Pixhawk Autopilot to navigate UAVs in GNSS-denied environments for extended periods (more than 1 hour).
9. What pricing options are available for accessing the report?
Pricing options include single-user, multi-user, and enterprise licenses priced at USD 4750, USD 5250, and USD 8750 respectively.
10. Is the market size provided in terms of value or volume?
The market size is provided in terms of value, measured in Million.
11. Are there any specific market keywords associated with the report?
Yes, the market keyword associated with the report is "NA Inertial Systems Market," which aids in identifying and referencing the specific market segment covered.
12. How do I determine which pricing option suits my needs best?
The pricing options vary based on user requirements and access needs. Individual users may opt for single-user licenses, while businesses requiring broader access may choose multi-user or enterprise licenses for cost-effective access to the report.
13. Are there any additional resources or data provided in the NA Inertial Systems Market report?
While the report offers comprehensive insights, it's advisable to review the specific contents or supplementary materials provided to ascertain if additional resources or data are available.
14. How can I stay updated on further developments or reports in the NA Inertial Systems Market?
To stay informed about further developments, trends, and reports in the NA Inertial Systems Market, consider subscribing to industry newsletters, following relevant companies and organizations, or regularly checking reputable industry news sources and publications.
Methodology
Step 1 - Identification of Relevant Samples Size from Population Database


Step 2 - Approaches for Defining Global Market Size (Value, Volume* & Price*)

Note*: In applicable scenarios
Step 3 - Data Sources
Primary Research
- Web Analytics
- Survey Reports
- Research Institute
- Latest Research Reports
- Opinion Leaders
Secondary Research
- Annual Reports
- White Paper
- Latest Press Release
- Industry Association
- Paid Database
- Investor Presentations

Step 4 - Data Triangulation
Involves using different sources of information in order to increase the validity of a study
These sources are likely to be stakeholders in a program - participants, other researchers, program staff, other community members, and so on.
Then we put all data in single framework & apply various statistical tools to find out the dynamic on the market.
During the analysis stage, feedback from the stakeholder groups would be compared to determine areas of agreement as well as areas of divergence


