
Key Insights
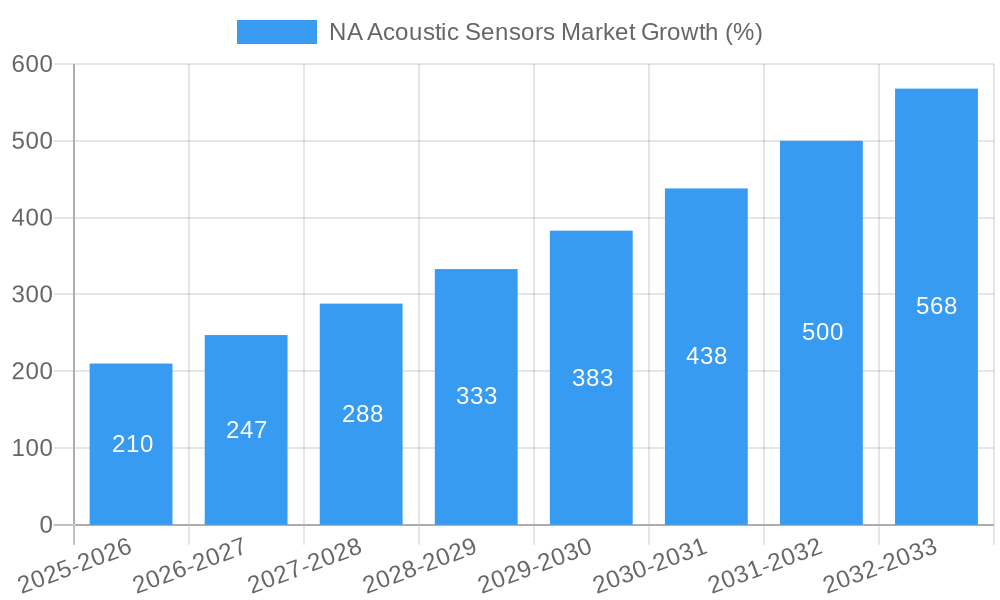
The North American acoustic sensor market is experiencing robust growth, driven by increasing demand across diverse sectors. The market's Compound Annual Growth Rate (CAGR) of 14.15% from 2019 to 2024 indicates a significant upward trajectory. This expansion is fueled by several key factors. The burgeoning automotive industry, particularly the rise of Advanced Driver-Assistance Systems (ADAS) and autonomous vehicles, necessitates sophisticated acoustic sensing for functionalities like parking assist, collision avoidance, and pedestrian detection. Similarly, the healthcare sector's adoption of acoustic sensors for medical imaging, diagnostics, and therapeutic applications contributes substantially to market growth. Furthermore, the expansion of smart homes and the Internet of Things (IoT) creates a substantial demand for acoustic sensors in consumer electronics, enhancing features like voice control and environmental monitoring. The aerospace and defense industries also leverage these sensors for structural health monitoring, leak detection, and surveillance systems, adding to the overall market dynamism.
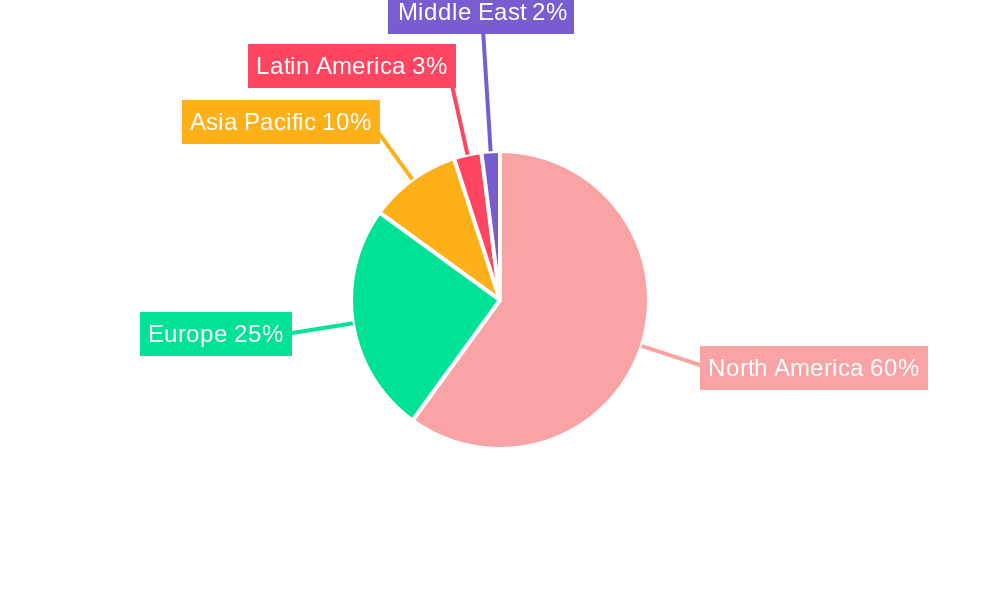
While the market faces certain restraints, such as the high initial investment cost associated with advanced acoustic sensor technologies and the potential for signal interference in noisy environments, these challenges are being mitigated through ongoing technological advancements. Miniaturization, improved signal processing capabilities, and the development of more cost-effective manufacturing processes are continuously broadening the applications and affordability of acoustic sensors. Within North America, the United States currently holds the largest market share, due to its strong technological base and significant presence of key players in the automotive, aerospace, and consumer electronics sectors. Canada, although smaller, is experiencing steady growth, propelled by government initiatives supporting technological innovation and the expansion of related industries. The forecast period (2025-2033) is poised for continued strong growth, with the market value projected to significantly increase based on the existing CAGR and the ongoing adoption of acoustic sensor technology in various sectors.
North America Acoustic Sensors Market: A Comprehensive Report (2019-2033)
This detailed report provides a comprehensive analysis of the North America (NA) Acoustic Sensors Market, offering invaluable insights for industry stakeholders, investors, and researchers. The study period covers 2019-2033, with 2025 as the base and estimated year, and a forecast period of 2025-2033. The report delves into market segmentation, competitive dynamics, growth drivers, challenges, and key developments, providing a 360-degree view of this dynamic market. The total market value is projected at xx Million in 2025 and is expected to reach xx Million by 2033, exhibiting a CAGR of xx%.
NA Acoustic Sensors Market Structure & Competitive Dynamics
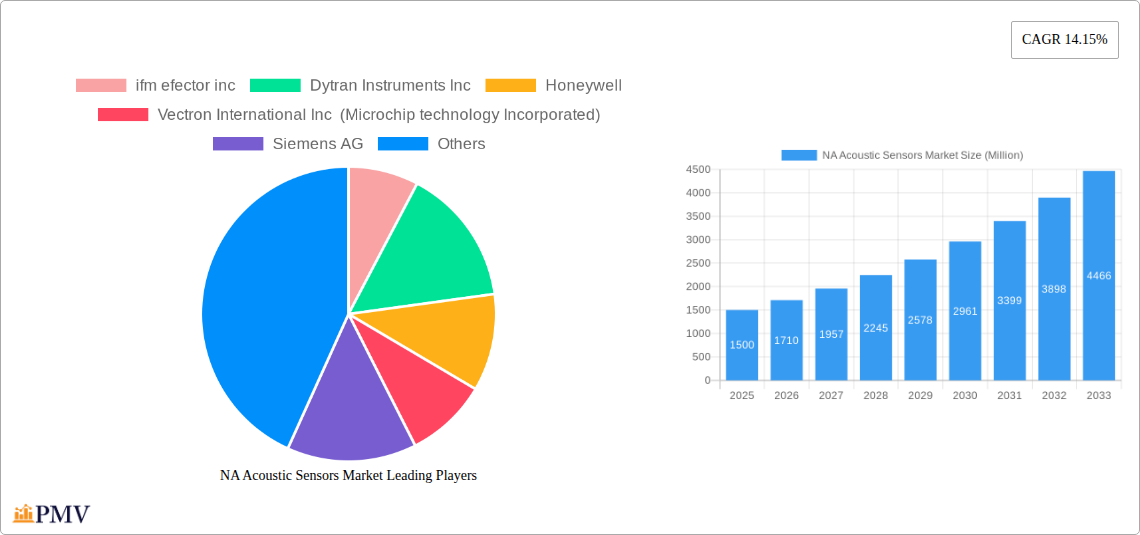
The NA Acoustic Sensors market exhibits a moderately concentrated structure, with several key players holding significant market share. The market is characterized by a dynamic interplay of established industry giants like Honeywell and Siemens AG, and innovative emerging companies. Innovation ecosystems are actively developing, driven by advancements in materials science, microelectronics, and signal processing. Regulatory frameworks, particularly concerning safety and environmental standards, significantly influence market operations. Product substitutes, such as optical sensors, pose a competitive threat, while ongoing M&A activities reshape the competitive landscape.
- Market Concentration: The top 5 players hold an estimated xx% market share in 2025.
- Innovation Ecosystems: Significant investments in R&D focusing on miniaturization, enhanced sensitivity, and improved power efficiency.
- Regulatory Frameworks: Compliance with safety and environmental regulations (e.g., RoHS, REACH) is crucial.
- Product Substitutes: Competition from optical and other sensing technologies.
- M&A Activities: Several acquisitions and strategic partnerships have been observed in the past five years, with total deal values exceeding xx Million. Examples include [Insert Specific Examples if Available, otherwise state "Examples not publicly disclosed"].
NA Acoustic Sensors Market Industry Trends & Insights
The NA acoustic sensors market is experiencing robust growth, driven by increasing demand across various sectors. Technological advancements, particularly in miniaturization and improved signal processing capabilities, are enhancing the performance and applications of these sensors. Consumer preferences for smart and connected devices fuel demand, while competitive dynamics lead to continuous innovation and price optimization. Market penetration is increasing across various applications, with significant growth expected in the automotive and healthcare sectors. The market is expected to witness a CAGR of xx% during the forecast period (2025-2033), driven by increasing demand for high-precision sensors in various applications. Factors such as the rising adoption of IoT devices, advancements in sensor technology, and the increasing demand for automation are boosting the growth of the market.
Dominant Markets & Segments in NA Acoustic Sensors Market
The United States dominates the NA acoustic sensors market, driven by robust technological advancements, a large consumer base, and substantial investments in R&D. Within segments:
By Sensing Parameter: Pressure sensors hold the largest market share, followed by temperature and torque sensors. The growth of pressure sensors is driven by increasing demand from industrial automation and healthcare applications.
By Application: The automotive industry is the leading application segment, driven by the increasing demand for advanced driver-assistance systems (ADAS) and safety features. The healthcare sector is also a significant application segment, driven by the increasing demand for medical imaging and diagnostic equipment.
By Country: The United States accounts for the largest share of the market, followed by Canada. Key drivers in the United States include strong technological innovation, established manufacturing base, and high adoption rates. In Canada, growth is fueled by investments in infrastructure and increasing adoption in industrial automation.
By Type: Wireless sensors are witnessing faster growth compared to wired sensors, driven by the increasing demand for portability and ease of installation.
By Wave Type: Surface acoustic wave (SAW) sensors are gaining traction due to their high sensitivity and cost-effectiveness.
Key Drivers (US): Strong R&D investments, established manufacturing base, high technological adoption, presence of major industry players.
Key Drivers (Canada): Investments in infrastructure development, increasing industrial automation, government initiatives promoting technological innovation.
NA Acoustic Sensors Market Product Innovations
Recent years have witnessed significant innovations in acoustic sensor technology, focusing on miniaturization, improved sensitivity, and wider operating temperature ranges. The integration of advanced signal processing algorithms enhances accuracy and reduces noise. New materials and manufacturing processes further improve sensor performance and reduce costs. These innovations cater to the growing demand for higher precision, reliability, and cost-effectiveness across diverse applications, particularly in automotive, healthcare, and industrial automation.
Report Segmentation & Scope
This report segments the NA acoustic sensors market by sensing parameter (temperature, pressure, torque), application (aerospace & defense, automotive, consumer electronics, healthcare, IT & telecom, others), country (United States, Canada), type (wired, wireless), and wave type (surface wave, bulk wave). Each segment's market size, growth projections, and competitive dynamics are analyzed in detail. Growth rates vary across segments, reflecting differing technological advancements and application-specific demands. The competitive landscape within each segment is influenced by factors such as technology leadership, market share, and strategic partnerships.
Key Drivers of NA Acoustic Sensors Market Growth
Several factors drive the growth of the NA acoustic sensors market:
- Technological Advancements: Miniaturization, improved sensitivity, and lower power consumption are key drivers.
- Rising Demand across Applications: The automotive, healthcare, and industrial automation sectors are major growth contributors.
- Government Regulations & Initiatives: Government support for technological innovation and environmental regulations drive market growth.
Challenges in the NA Acoustic Sensors Market Sector
The NA acoustic sensors market faces several challenges:
- Supply Chain Disruptions: Global supply chain disruptions can affect the availability of raw materials and components.
- High R&D Costs: Developing advanced sensor technologies requires significant investments.
- Intense Competition: The presence of established players and new entrants creates intense competitive pressure.
Leading Players in the NA Acoustic Sensors Market Market
- ifm efector inc
- Dytran Instruments Inc
- Honeywell
- Vectron International Inc (Microchip technology Incorporated)
- Siemens AG
- KYOCERA Corporation
- Murata Manufacturing Co Ltd
- Panasonic Corporation
- Campbell Scientific Inc
Key Developments in NA Acoustic Sensors Market Sector
- November 2021: CeramTec developed highly customized PZT components for underwater acoustic sonar applications.
- January 2022: NanoVibronix Inc. filed three patent applications related to its Surface Acoustic Wave (SAW) technology for medical devices.
Strategic NA Acoustic Sensors Market Outlook
The NA acoustic sensors market presents substantial growth opportunities. Continued technological advancements, increasing demand across diverse applications, and favorable regulatory environments will drive market expansion. Strategic partnerships, M&A activities, and investments in R&D will shape the competitive landscape. Companies focusing on innovation, product differentiation, and efficient supply chain management are poised for success in this dynamic market.
NA Acoustic Sensors Market Segmentation
-
1. Type
- 1.1. Wired
- 1.2. Wireless
-
2. Wave Type
- 2.1. Surface Wave
- 2.2. Bulk Wave
-
3. Sensing Parameter
- 3.1. Temperature
- 3.2. Pressure
- 3.3. Torque
-
4. Application
- 4.1. Aerospace and Defense
- 4.2. Automotive
- 4.3. Consumer Electronics
- 4.4. Healthcare
- 4.5. IT and Telecom
- 4.6. Others
NA Acoustic Sensors Market Segmentation By Geography
-
1. North America
- 1.1. United States
- 1.2. Canada
- 1.3. Mexico
-
2. South America
- 2.1. Brazil
- 2.2. Argentina
- 2.3. Rest of South America
-
3. Europe
- 3.1. United Kingdom
- 3.2. Germany
- 3.3. France
- 3.4. Italy
- 3.5. Spain
- 3.6. Russia
- 3.7. Benelux
- 3.8. Nordics
- 3.9. Rest of Europe
-
4. Middle East & Africa
- 4.1. Turkey
- 4.2. Israel
- 4.3. GCC
- 4.4. North Africa
- 4.5. South Africa
- 4.6. Rest of Middle East & Africa
-
5. Asia Pacific
- 5.1. China
- 5.2. India
- 5.3. Japan
- 5.4. South Korea
- 5.5. ASEAN
- 5.6. Oceania
- 5.7. Rest of Asia Pacific
NA Acoustic Sensors Market REPORT HIGHLIGHTS
| Aspects | Details |
|---|---|
| Study Period | 2019-2033 |
| Base Year | 2024 |
| Estimated Year | 2025 |
| Forecast Period | 2025-2033 |
| Historical Period | 2019-2024 |
| Growth Rate | CAGR of 14.15% from 2019-2033 |
| Segmentation |
|
Table of Contents
- 1. Introduction
- 1.1. Research Scope
- 1.2. Market Segmentation
- 1.3. Research Methodology
- 1.4. Definitions and Assumptions
- 2. Executive Summary
- 2.1. Introduction
- 3. Market Dynamics
- 3.1. Introduction
- 3.2. Market Drivers
- 3.2.1. Rapid Growing Numbe of End-users; Low Manufacturing Costs
- 3.3. Market Restrains
- 3.3.1. Technical Difficulties
- 3.4. Market Trends
- 3.4.1. Telecommunications is Expected to Drive Market Growth
- 4. Market Factor Analysis
- 4.1. Porters Five Forces
- 4.2. Supply/Value Chain
- 4.3. PESTEL analysis
- 4.4. Market Entropy
- 4.5. Patent/Trademark Analysis
- 5. Global NA Acoustic Sensors Market Analysis, Insights and Forecast, 2019-2031
- 5.1. Market Analysis, Insights and Forecast - by Type
- 5.1.1. Wired
- 5.1.2. Wireless
- 5.2. Market Analysis, Insights and Forecast - by Wave Type
- 5.2.1. Surface Wave
- 5.2.2. Bulk Wave
- 5.3. Market Analysis, Insights and Forecast - by Sensing Parameter
- 5.3.1. Temperature
- 5.3.2. Pressure
- 5.3.3. Torque
- 5.4. Market Analysis, Insights and Forecast - by Application
- 5.4.1. Aerospace and Defense
- 5.4.2. Automotive
- 5.4.3. Consumer Electronics
- 5.4.4. Healthcare
- 5.4.5. IT and Telecom
- 5.4.6. Others
- 5.5. Market Analysis, Insights and Forecast - by Region
- 5.5.1. North America
- 5.5.2. South America
- 5.5.3. Europe
- 5.5.4. Middle East & Africa
- 5.5.5. Asia Pacific
- 5.1. Market Analysis, Insights and Forecast - by Type
- 6. North America NA Acoustic Sensors Market Analysis, Insights and Forecast, 2019-2031
- 6.1. Market Analysis, Insights and Forecast - by Type
- 6.1.1. Wired
- 6.1.2. Wireless
- 6.2. Market Analysis, Insights and Forecast - by Wave Type
- 6.2.1. Surface Wave
- 6.2.2. Bulk Wave
- 6.3. Market Analysis, Insights and Forecast - by Sensing Parameter
- 6.3.1. Temperature
- 6.3.2. Pressure
- 6.3.3. Torque
- 6.4. Market Analysis, Insights and Forecast - by Application
- 6.4.1. Aerospace and Defense
- 6.4.2. Automotive
- 6.4.3. Consumer Electronics
- 6.4.4. Healthcare
- 6.4.5. IT and Telecom
- 6.4.6. Others
- 6.1. Market Analysis, Insights and Forecast - by Type
- 7. South America NA Acoustic Sensors Market Analysis, Insights and Forecast, 2019-2031
- 7.1. Market Analysis, Insights and Forecast - by Type
- 7.1.1. Wired
- 7.1.2. Wireless
- 7.2. Market Analysis, Insights and Forecast - by Wave Type
- 7.2.1. Surface Wave
- 7.2.2. Bulk Wave
- 7.3. Market Analysis, Insights and Forecast - by Sensing Parameter
- 7.3.1. Temperature
- 7.3.2. Pressure
- 7.3.3. Torque
- 7.4. Market Analysis, Insights and Forecast - by Application
- 7.4.1. Aerospace and Defense
- 7.4.2. Automotive
- 7.4.3. Consumer Electronics
- 7.4.4. Healthcare
- 7.4.5. IT and Telecom
- 7.4.6. Others
- 7.1. Market Analysis, Insights and Forecast - by Type
- 8. Europe NA Acoustic Sensors Market Analysis, Insights and Forecast, 2019-2031
- 8.1. Market Analysis, Insights and Forecast - by Type
- 8.1.1. Wired
- 8.1.2. Wireless
- 8.2. Market Analysis, Insights and Forecast - by Wave Type
- 8.2.1. Surface Wave
- 8.2.2. Bulk Wave
- 8.3. Market Analysis, Insights and Forecast - by Sensing Parameter
- 8.3.1. Temperature
- 8.3.2. Pressure
- 8.3.3. Torque
- 8.4. Market Analysis, Insights and Forecast - by Application
- 8.4.1. Aerospace and Defense
- 8.4.2. Automotive
- 8.4.3. Consumer Electronics
- 8.4.4. Healthcare
- 8.4.5. IT and Telecom
- 8.4.6. Others
- 8.1. Market Analysis, Insights and Forecast - by Type
- 9. Middle East & Africa NA Acoustic Sensors Market Analysis, Insights and Forecast, 2019-2031
- 9.1. Market Analysis, Insights and Forecast - by Type
- 9.1.1. Wired
- 9.1.2. Wireless
- 9.2. Market Analysis, Insights and Forecast - by Wave Type
- 9.2.1. Surface Wave
- 9.2.2. Bulk Wave
- 9.3. Market Analysis, Insights and Forecast - by Sensing Parameter
- 9.3.1. Temperature
- 9.3.2. Pressure
- 9.3.3. Torque
- 9.4. Market Analysis, Insights and Forecast - by Application
- 9.4.1. Aerospace and Defense
- 9.4.2. Automotive
- 9.4.3. Consumer Electronics
- 9.4.4. Healthcare
- 9.4.5. IT and Telecom
- 9.4.6. Others
- 9.1. Market Analysis, Insights and Forecast - by Type
- 10. Asia Pacific NA Acoustic Sensors Market Analysis, Insights and Forecast, 2019-2031
- 10.1. Market Analysis, Insights and Forecast - by Type
- 10.1.1. Wired
- 10.1.2. Wireless
- 10.2. Market Analysis, Insights and Forecast - by Wave Type
- 10.2.1. Surface Wave
- 10.2.2. Bulk Wave
- 10.3. Market Analysis, Insights and Forecast - by Sensing Parameter
- 10.3.1. Temperature
- 10.3.2. Pressure
- 10.3.3. Torque
- 10.4. Market Analysis, Insights and Forecast - by Application
- 10.4.1. Aerospace and Defense
- 10.4.2. Automotive
- 10.4.3. Consumer Electronics
- 10.4.4. Healthcare
- 10.4.5. IT and Telecom
- 10.4.6. Others
- 10.1. Market Analysis, Insights and Forecast - by Type
- 11. North America NA Acoustic Sensors Market Analysis, Insights and Forecast, 2019-2031
- 11.1. Market Analysis, Insights and Forecast - By Country/Sub-region
- 11.1.1 United States
- 11.1.2 Canada
- 12. Europe NA Acoustic Sensors Market Analysis, Insights and Forecast, 2019-2031
- 12.1. Market Analysis, Insights and Forecast - By Country/Sub-region
- 12.1.1 United Kingdom
- 12.1.2 Germany
- 12.1.3 France
- 12.1.4 Benelux
- 12.1.5 Rest of Europe
- 13. Asia Pacific NA Acoustic Sensors Market Analysis, Insights and Forecast, 2019-2031
- 13.1. Market Analysis, Insights and Forecast - By Country/Sub-region
- 13.1.1 China
- 13.1.2 India
- 13.1.3 Japan
- 13.1.4 Rest of Asia Pacific
- 14. Latin America NA Acoustic Sensors Market Analysis, Insights and Forecast, 2019-2031
- 14.1. Market Analysis, Insights and Forecast - By Country/Sub-region
- 14.1.1 Brazil
- 14.1.2 Argentina
- 14.1.3 Mexico
- 14.1.4 Rest of Latin America
- 15. Middle East NA Acoustic Sensors Market Analysis, Insights and Forecast, 2019-2031
- 15.1. Market Analysis, Insights and Forecast - By Country/Sub-region
- 15.1.1.
- 16. United Arab Emirates NA Acoustic Sensors Market Analysis, Insights and Forecast, 2019-2031
- 16.1. Market Analysis, Insights and Forecast - By Country/Sub-region
- 16.1.1 Saudi Arabia
- 16.1.2 South Africa
- 16.1.3 Rest of Middle East
- 17. Competitive Analysis
- 17.1. Global Market Share Analysis 2024
- 17.2. Company Profiles
- 17.2.1 ifm efector inc
- 17.2.1.1. Overview
- 17.2.1.2. Products
- 17.2.1.3. SWOT Analysis
- 17.2.1.4. Recent Developments
- 17.2.1.5. Financials (Based on Availability)
- 17.2.2 Dytran Instruments Inc
- 17.2.2.1. Overview
- 17.2.2.2. Products
- 17.2.2.3. SWOT Analysis
- 17.2.2.4. Recent Developments
- 17.2.2.5. Financials (Based on Availability)
- 17.2.3 Honeywell
- 17.2.3.1. Overview
- 17.2.3.2. Products
- 17.2.3.3. SWOT Analysis
- 17.2.3.4. Recent Developments
- 17.2.3.5. Financials (Based on Availability)
- 17.2.4 Vectron International Inc (Microchip technology Incorporated)
- 17.2.4.1. Overview
- 17.2.4.2. Products
- 17.2.4.3. SWOT Analysis
- 17.2.4.4. Recent Developments
- 17.2.4.5. Financials (Based on Availability)
- 17.2.5 Siemens AG
- 17.2.5.1. Overview
- 17.2.5.2. Products
- 17.2.5.3. SWOT Analysis
- 17.2.5.4. Recent Developments
- 17.2.5.5. Financials (Based on Availability)
- 17.2.6 KYOCERA Corporation*List Not Exhaustive
- 17.2.6.1. Overview
- 17.2.6.2. Products
- 17.2.6.3. SWOT Analysis
- 17.2.6.4. Recent Developments
- 17.2.6.5. Financials (Based on Availability)
- 17.2.7 Murata Manufacturing Co Ltd
- 17.2.7.1. Overview
- 17.2.7.2. Products
- 17.2.7.3. SWOT Analysis
- 17.2.7.4. Recent Developments
- 17.2.7.5. Financials (Based on Availability)
- 17.2.8 Panasonic Corporation
- 17.2.8.1. Overview
- 17.2.8.2. Products
- 17.2.8.3. SWOT Analysis
- 17.2.8.4. Recent Developments
- 17.2.8.5. Financials (Based on Availability)
- 17.2.9 Campbell Scientific Inc
- 17.2.9.1. Overview
- 17.2.9.2. Products
- 17.2.9.3. SWOT Analysis
- 17.2.9.4. Recent Developments
- 17.2.9.5. Financials (Based on Availability)
- 17.2.1 ifm efector inc
List of Figures
- Figure 1: Global NA Acoustic Sensors Market Revenue Breakdown (Million, %) by Region 2024 & 2032
- Figure 2: North America NA Acoustic Sensors Market Revenue (Million), by Country 2024 & 2032
- Figure 3: North America NA Acoustic Sensors Market Revenue Share (%), by Country 2024 & 2032
- Figure 4: Europe NA Acoustic Sensors Market Revenue (Million), by Country 2024 & 2032
- Figure 5: Europe NA Acoustic Sensors Market Revenue Share (%), by Country 2024 & 2032
- Figure 6: Asia Pacific NA Acoustic Sensors Market Revenue (Million), by Country 2024 & 2032
- Figure 7: Asia Pacific NA Acoustic Sensors Market Revenue Share (%), by Country 2024 & 2032
- Figure 8: Latin America NA Acoustic Sensors Market Revenue (Million), by Country 2024 & 2032
- Figure 9: Latin America NA Acoustic Sensors Market Revenue Share (%), by Country 2024 & 2032
- Figure 10: Middle East NA Acoustic Sensors Market Revenue (Million), by Country 2024 & 2032
- Figure 11: Middle East NA Acoustic Sensors Market Revenue Share (%), by Country 2024 & 2032
- Figure 12: United Arab Emirates NA Acoustic Sensors Market Revenue (Million), by Country 2024 & 2032
- Figure 13: United Arab Emirates NA Acoustic Sensors Market Revenue Share (%), by Country 2024 & 2032
- Figure 14: North America NA Acoustic Sensors Market Revenue (Million), by Type 2024 & 2032
- Figure 15: North America NA Acoustic Sensors Market Revenue Share (%), by Type 2024 & 2032
- Figure 16: North America NA Acoustic Sensors Market Revenue (Million), by Wave Type 2024 & 2032
- Figure 17: North America NA Acoustic Sensors Market Revenue Share (%), by Wave Type 2024 & 2032
- Figure 18: North America NA Acoustic Sensors Market Revenue (Million), by Sensing Parameter 2024 & 2032
- Figure 19: North America NA Acoustic Sensors Market Revenue Share (%), by Sensing Parameter 2024 & 2032
- Figure 20: North America NA Acoustic Sensors Market Revenue (Million), by Application 2024 & 2032
- Figure 21: North America NA Acoustic Sensors Market Revenue Share (%), by Application 2024 & 2032
- Figure 22: North America NA Acoustic Sensors Market Revenue (Million), by Country 2024 & 2032
- Figure 23: North America NA Acoustic Sensors Market Revenue Share (%), by Country 2024 & 2032
- Figure 24: South America NA Acoustic Sensors Market Revenue (Million), by Type 2024 & 2032
- Figure 25: South America NA Acoustic Sensors Market Revenue Share (%), by Type 2024 & 2032
- Figure 26: South America NA Acoustic Sensors Market Revenue (Million), by Wave Type 2024 & 2032
- Figure 27: South America NA Acoustic Sensors Market Revenue Share (%), by Wave Type 2024 & 2032
- Figure 28: South America NA Acoustic Sensors Market Revenue (Million), by Sensing Parameter 2024 & 2032
- Figure 29: South America NA Acoustic Sensors Market Revenue Share (%), by Sensing Parameter 2024 & 2032
- Figure 30: South America NA Acoustic Sensors Market Revenue (Million), by Application 2024 & 2032
- Figure 31: South America NA Acoustic Sensors Market Revenue Share (%), by Application 2024 & 2032
- Figure 32: South America NA Acoustic Sensors Market Revenue (Million), by Country 2024 & 2032
- Figure 33: South America NA Acoustic Sensors Market Revenue Share (%), by Country 2024 & 2032
- Figure 34: Europe NA Acoustic Sensors Market Revenue (Million), by Type 2024 & 2032
- Figure 35: Europe NA Acoustic Sensors Market Revenue Share (%), by Type 2024 & 2032
- Figure 36: Europe NA Acoustic Sensors Market Revenue (Million), by Wave Type 2024 & 2032
- Figure 37: Europe NA Acoustic Sensors Market Revenue Share (%), by Wave Type 2024 & 2032
- Figure 38: Europe NA Acoustic Sensors Market Revenue (Million), by Sensing Parameter 2024 & 2032
- Figure 39: Europe NA Acoustic Sensors Market Revenue Share (%), by Sensing Parameter 2024 & 2032
- Figure 40: Europe NA Acoustic Sensors Market Revenue (Million), by Application 2024 & 2032
- Figure 41: Europe NA Acoustic Sensors Market Revenue Share (%), by Application 2024 & 2032
- Figure 42: Europe NA Acoustic Sensors Market Revenue (Million), by Country 2024 & 2032
- Figure 43: Europe NA Acoustic Sensors Market Revenue Share (%), by Country 2024 & 2032
- Figure 44: Middle East & Africa NA Acoustic Sensors Market Revenue (Million), by Type 2024 & 2032
- Figure 45: Middle East & Africa NA Acoustic Sensors Market Revenue Share (%), by Type 2024 & 2032
- Figure 46: Middle East & Africa NA Acoustic Sensors Market Revenue (Million), by Wave Type 2024 & 2032
- Figure 47: Middle East & Africa NA Acoustic Sensors Market Revenue Share (%), by Wave Type 2024 & 2032
- Figure 48: Middle East & Africa NA Acoustic Sensors Market Revenue (Million), by Sensing Parameter 2024 & 2032
- Figure 49: Middle East & Africa NA Acoustic Sensors Market Revenue Share (%), by Sensing Parameter 2024 & 2032
- Figure 50: Middle East & Africa NA Acoustic Sensors Market Revenue (Million), by Application 2024 & 2032
- Figure 51: Middle East & Africa NA Acoustic Sensors Market Revenue Share (%), by Application 2024 & 2032
- Figure 52: Middle East & Africa NA Acoustic Sensors Market Revenue (Million), by Country 2024 & 2032
- Figure 53: Middle East & Africa NA Acoustic Sensors Market Revenue Share (%), by Country 2024 & 2032
- Figure 54: Asia Pacific NA Acoustic Sensors Market Revenue (Million), by Type 2024 & 2032
- Figure 55: Asia Pacific NA Acoustic Sensors Market Revenue Share (%), by Type 2024 & 2032
- Figure 56: Asia Pacific NA Acoustic Sensors Market Revenue (Million), by Wave Type 2024 & 2032
- Figure 57: Asia Pacific NA Acoustic Sensors Market Revenue Share (%), by Wave Type 2024 & 2032
- Figure 58: Asia Pacific NA Acoustic Sensors Market Revenue (Million), by Sensing Parameter 2024 & 2032
- Figure 59: Asia Pacific NA Acoustic Sensors Market Revenue Share (%), by Sensing Parameter 2024 & 2032
- Figure 60: Asia Pacific NA Acoustic Sensors Market Revenue (Million), by Application 2024 & 2032
- Figure 61: Asia Pacific NA Acoustic Sensors Market Revenue Share (%), by Application 2024 & 2032
- Figure 62: Asia Pacific NA Acoustic Sensors Market Revenue (Million), by Country 2024 & 2032
- Figure 63: Asia Pacific NA Acoustic Sensors Market Revenue Share (%), by Country 2024 & 2032
List of Tables
- Table 1: Global NA Acoustic Sensors Market Revenue Million Forecast, by Region 2019 & 2032
- Table 2: Global NA Acoustic Sensors Market Revenue Million Forecast, by Type 2019 & 2032
- Table 3: Global NA Acoustic Sensors Market Revenue Million Forecast, by Wave Type 2019 & 2032
- Table 4: Global NA Acoustic Sensors Market Revenue Million Forecast, by Sensing Parameter 2019 & 2032
- Table 5: Global NA Acoustic Sensors Market Revenue Million Forecast, by Application 2019 & 2032
- Table 6: Global NA Acoustic Sensors Market Revenue Million Forecast, by Region 2019 & 2032
- Table 7: Global NA Acoustic Sensors Market Revenue Million Forecast, by Country 2019 & 2032
- Table 8: United States NA Acoustic Sensors Market Revenue (Million) Forecast, by Application 2019 & 2032
- Table 9: Canada NA Acoustic Sensors Market Revenue (Million) Forecast, by Application 2019 & 2032
- Table 10: Global NA Acoustic Sensors Market Revenue Million Forecast, by Country 2019 & 2032
- Table 11: United Kingdom NA Acoustic Sensors Market Revenue (Million) Forecast, by Application 2019 & 2032
- Table 12: Germany NA Acoustic Sensors Market Revenue (Million) Forecast, by Application 2019 & 2032
- Table 13: France NA Acoustic Sensors Market Revenue (Million) Forecast, by Application 2019 & 2032
- Table 14: Benelux NA Acoustic Sensors Market Revenue (Million) Forecast, by Application 2019 & 2032
- Table 15: Rest of Europe NA Acoustic Sensors Market Revenue (Million) Forecast, by Application 2019 & 2032
- Table 16: Global NA Acoustic Sensors Market Revenue Million Forecast, by Country 2019 & 2032
- Table 17: China NA Acoustic Sensors Market Revenue (Million) Forecast, by Application 2019 & 2032
- Table 18: India NA Acoustic Sensors Market Revenue (Million) Forecast, by Application 2019 & 2032
- Table 19: Japan NA Acoustic Sensors Market Revenue (Million) Forecast, by Application 2019 & 2032
- Table 20: Rest of Asia Pacific NA Acoustic Sensors Market Revenue (Million) Forecast, by Application 2019 & 2032
- Table 21: Global NA Acoustic Sensors Market Revenue Million Forecast, by Country 2019 & 2032
- Table 22: Brazil NA Acoustic Sensors Market Revenue (Million) Forecast, by Application 2019 & 2032
- Table 23: Argentina NA Acoustic Sensors Market Revenue (Million) Forecast, by Application 2019 & 2032
- Table 24: Mexico NA Acoustic Sensors Market Revenue (Million) Forecast, by Application 2019 & 2032
- Table 25: Rest of Latin America NA Acoustic Sensors Market Revenue (Million) Forecast, by Application 2019 & 2032
- Table 26: Global NA Acoustic Sensors Market Revenue Million Forecast, by Country 2019 & 2032
- Table 27: NA Acoustic Sensors Market Revenue (Million) Forecast, by Application 2019 & 2032
- Table 28: Global NA Acoustic Sensors Market Revenue Million Forecast, by Country 2019 & 2032
- Table 29: Saudi Arabia NA Acoustic Sensors Market Revenue (Million) Forecast, by Application 2019 & 2032
- Table 30: South Africa NA Acoustic Sensors Market Revenue (Million) Forecast, by Application 2019 & 2032
- Table 31: Rest of Middle East NA Acoustic Sensors Market Revenue (Million) Forecast, by Application 2019 & 2032
- Table 32: Global NA Acoustic Sensors Market Revenue Million Forecast, by Type 2019 & 2032
- Table 33: Global NA Acoustic Sensors Market Revenue Million Forecast, by Wave Type 2019 & 2032
- Table 34: Global NA Acoustic Sensors Market Revenue Million Forecast, by Sensing Parameter 2019 & 2032
- Table 35: Global NA Acoustic Sensors Market Revenue Million Forecast, by Application 2019 & 2032
- Table 36: Global NA Acoustic Sensors Market Revenue Million Forecast, by Country 2019 & 2032
- Table 37: United States NA Acoustic Sensors Market Revenue (Million) Forecast, by Application 2019 & 2032
- Table 38: Canada NA Acoustic Sensors Market Revenue (Million) Forecast, by Application 2019 & 2032
- Table 39: Mexico NA Acoustic Sensors Market Revenue (Million) Forecast, by Application 2019 & 2032
- Table 40: Global NA Acoustic Sensors Market Revenue Million Forecast, by Type 2019 & 2032
- Table 41: Global NA Acoustic Sensors Market Revenue Million Forecast, by Wave Type 2019 & 2032
- Table 42: Global NA Acoustic Sensors Market Revenue Million Forecast, by Sensing Parameter 2019 & 2032
- Table 43: Global NA Acoustic Sensors Market Revenue Million Forecast, by Application 2019 & 2032
- Table 44: Global NA Acoustic Sensors Market Revenue Million Forecast, by Country 2019 & 2032
- Table 45: Brazil NA Acoustic Sensors Market Revenue (Million) Forecast, by Application 2019 & 2032
- Table 46: Argentina NA Acoustic Sensors Market Revenue (Million) Forecast, by Application 2019 & 2032
- Table 47: Rest of South America NA Acoustic Sensors Market Revenue (Million) Forecast, by Application 2019 & 2032
- Table 48: Global NA Acoustic Sensors Market Revenue Million Forecast, by Type 2019 & 2032
- Table 49: Global NA Acoustic Sensors Market Revenue Million Forecast, by Wave Type 2019 & 2032
- Table 50: Global NA Acoustic Sensors Market Revenue Million Forecast, by Sensing Parameter 2019 & 2032
- Table 51: Global NA Acoustic Sensors Market Revenue Million Forecast, by Application 2019 & 2032
- Table 52: Global NA Acoustic Sensors Market Revenue Million Forecast, by Country 2019 & 2032
- Table 53: United Kingdom NA Acoustic Sensors Market Revenue (Million) Forecast, by Application 2019 & 2032
- Table 54: Germany NA Acoustic Sensors Market Revenue (Million) Forecast, by Application 2019 & 2032
- Table 55: France NA Acoustic Sensors Market Revenue (Million) Forecast, by Application 2019 & 2032
- Table 56: Italy NA Acoustic Sensors Market Revenue (Million) Forecast, by Application 2019 & 2032
- Table 57: Spain NA Acoustic Sensors Market Revenue (Million) Forecast, by Application 2019 & 2032
- Table 58: Russia NA Acoustic Sensors Market Revenue (Million) Forecast, by Application 2019 & 2032
- Table 59: Benelux NA Acoustic Sensors Market Revenue (Million) Forecast, by Application 2019 & 2032
- Table 60: Nordics NA Acoustic Sensors Market Revenue (Million) Forecast, by Application 2019 & 2032
- Table 61: Rest of Europe NA Acoustic Sensors Market Revenue (Million) Forecast, by Application 2019 & 2032
- Table 62: Global NA Acoustic Sensors Market Revenue Million Forecast, by Type 2019 & 2032
- Table 63: Global NA Acoustic Sensors Market Revenue Million Forecast, by Wave Type 2019 & 2032
- Table 64: Global NA Acoustic Sensors Market Revenue Million Forecast, by Sensing Parameter 2019 & 2032
- Table 65: Global NA Acoustic Sensors Market Revenue Million Forecast, by Application 2019 & 2032
- Table 66: Global NA Acoustic Sensors Market Revenue Million Forecast, by Country 2019 & 2032
- Table 67: Turkey NA Acoustic Sensors Market Revenue (Million) Forecast, by Application 2019 & 2032
- Table 68: Israel NA Acoustic Sensors Market Revenue (Million) Forecast, by Application 2019 & 2032
- Table 69: GCC NA Acoustic Sensors Market Revenue (Million) Forecast, by Application 2019 & 2032
- Table 70: North Africa NA Acoustic Sensors Market Revenue (Million) Forecast, by Application 2019 & 2032
- Table 71: South Africa NA Acoustic Sensors Market Revenue (Million) Forecast, by Application 2019 & 2032
- Table 72: Rest of Middle East & Africa NA Acoustic Sensors Market Revenue (Million) Forecast, by Application 2019 & 2032
- Table 73: Global NA Acoustic Sensors Market Revenue Million Forecast, by Type 2019 & 2032
- Table 74: Global NA Acoustic Sensors Market Revenue Million Forecast, by Wave Type 2019 & 2032
- Table 75: Global NA Acoustic Sensors Market Revenue Million Forecast, by Sensing Parameter 2019 & 2032
- Table 76: Global NA Acoustic Sensors Market Revenue Million Forecast, by Application 2019 & 2032
- Table 77: Global NA Acoustic Sensors Market Revenue Million Forecast, by Country 2019 & 2032
- Table 78: China NA Acoustic Sensors Market Revenue (Million) Forecast, by Application 2019 & 2032
- Table 79: India NA Acoustic Sensors Market Revenue (Million) Forecast, by Application 2019 & 2032
- Table 80: Japan NA Acoustic Sensors Market Revenue (Million) Forecast, by Application 2019 & 2032
- Table 81: South Korea NA Acoustic Sensors Market Revenue (Million) Forecast, by Application 2019 & 2032
- Table 82: ASEAN NA Acoustic Sensors Market Revenue (Million) Forecast, by Application 2019 & 2032
- Table 83: Oceania NA Acoustic Sensors Market Revenue (Million) Forecast, by Application 2019 & 2032
- Table 84: Rest of Asia Pacific NA Acoustic Sensors Market Revenue (Million) Forecast, by Application 2019 & 2032
Frequently Asked Questions
1. What is the projected Compound Annual Growth Rate (CAGR) of the NA Acoustic Sensors Market?
The projected CAGR is approximately 14.15%.
2. Which companies are prominent players in the NA Acoustic Sensors Market?
Key companies in the market include ifm efector inc, Dytran Instruments Inc, Honeywell, Vectron International Inc (Microchip technology Incorporated), Siemens AG, KYOCERA Corporation*List Not Exhaustive, Murata Manufacturing Co Ltd, Panasonic Corporation, Campbell Scientific Inc.
3. What are the main segments of the NA Acoustic Sensors Market?
The market segments include Type, Wave Type, Sensing Parameter, Application.
4. Can you provide details about the market size?
The market size is estimated to be USD XX Million as of 2022.
5. What are some drivers contributing to market growth?
Rapid Growing Numbe of End-users; Low Manufacturing Costs.
6. What are the notable trends driving market growth?
Telecommunications is Expected to Drive Market Growth.
7. Are there any restraints impacting market growth?
Technical Difficulties.
8. Can you provide examples of recent developments in the market?
January 2022: A medical device company "NanoVibronix Inc." that provides the PainShield and UroShield SAW Portable Ultrasonic Therapeutic Devices, has filed three patent applications with the United States Patent and Trademark Office related to its Surface Acoustic Wave (SAW) technology and indwelling medical devices to protect targeted new product launches and improvements to existing medical devices.
9. What pricing options are available for accessing the report?
Pricing options include single-user, multi-user, and enterprise licenses priced at USD 4750, USD 4950, and USD 6800 respectively.
10. Is the market size provided in terms of value or volume?
The market size is provided in terms of value, measured in Million.
11. Are there any specific market keywords associated with the report?
Yes, the market keyword associated with the report is "NA Acoustic Sensors Market," which aids in identifying and referencing the specific market segment covered.
12. How do I determine which pricing option suits my needs best?
The pricing options vary based on user requirements and access needs. Individual users may opt for single-user licenses, while businesses requiring broader access may choose multi-user or enterprise licenses for cost-effective access to the report.
13. Are there any additional resources or data provided in the NA Acoustic Sensors Market report?
While the report offers comprehensive insights, it's advisable to review the specific contents or supplementary materials provided to ascertain if additional resources or data are available.
14. How can I stay updated on further developments or reports in the NA Acoustic Sensors Market?
To stay informed about further developments, trends, and reports in the NA Acoustic Sensors Market, consider subscribing to industry newsletters, following relevant companies and organizations, or regularly checking reputable industry news sources and publications.
Methodology
Step 1 - Identification of Relevant Samples Size from Population Database


Step 2 - Approaches for Defining Global Market Size (Value, Volume* & Price*)

Note*: In applicable scenarios
Step 3 - Data Sources
Primary Research
- Web Analytics
- Survey Reports
- Research Institute
- Latest Research Reports
- Opinion Leaders
Secondary Research
- Annual Reports
- White Paper
- Latest Press Release
- Industry Association
- Paid Database
- Investor Presentations

Step 4 - Data Triangulation
Involves using different sources of information in order to increase the validity of a study
These sources are likely to be stakeholders in a program - participants, other researchers, program staff, other community members, and so on.
Then we put all data in single framework & apply various statistical tools to find out the dynamic on the market.
During the analysis stage, feedback from the stakeholder groups would be compared to determine areas of agreement as well as areas of divergence


