
Key Insights
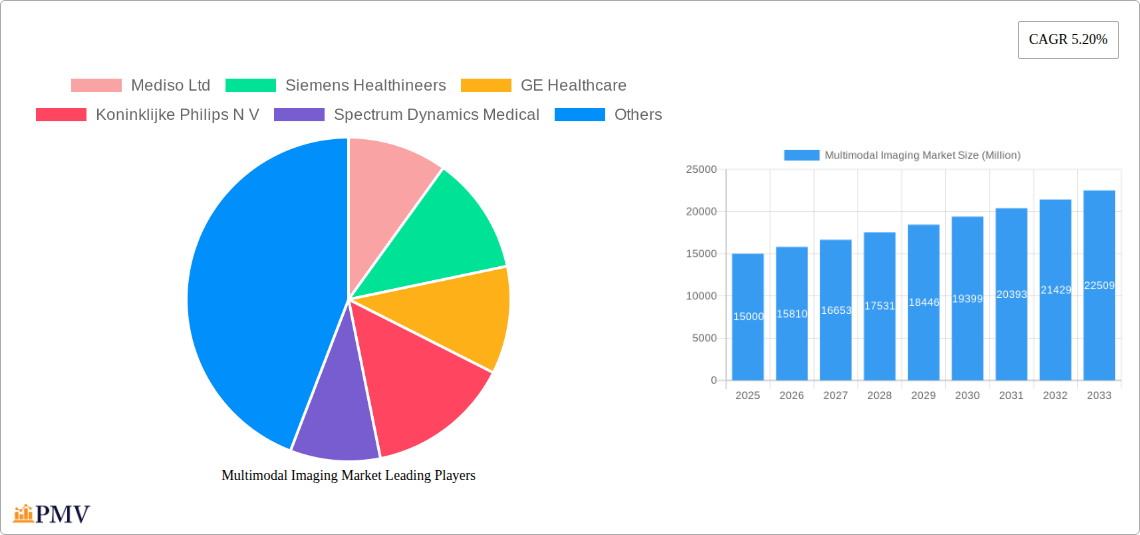
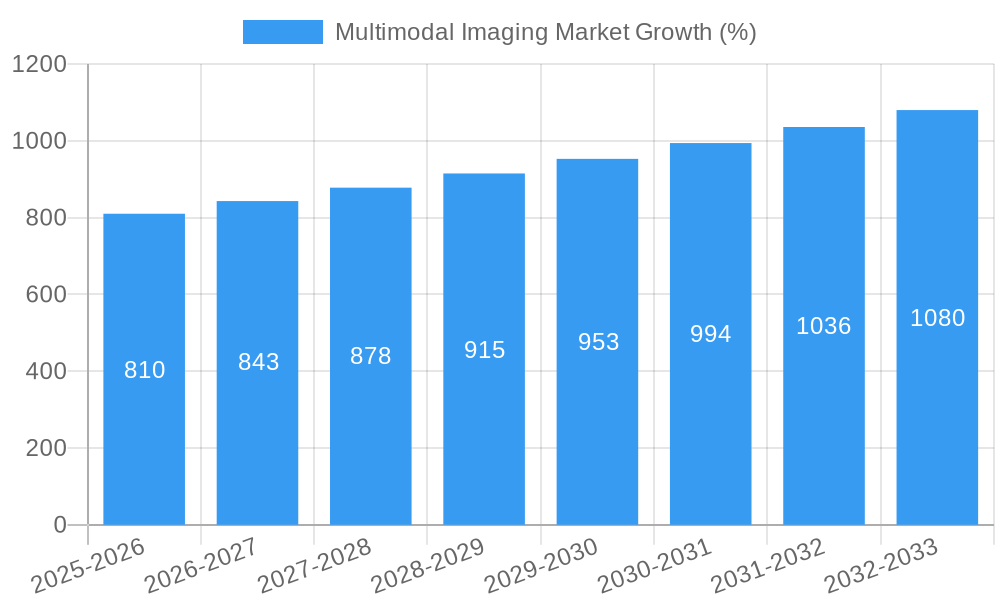
The multimodal imaging market, encompassing technologies like PET/CT, SPECT/CT, and PET/MR systems, is experiencing robust growth, projected to reach a substantial size over the forecast period (2025-2033). A 5.20% CAGR indicates a consistently expanding market driven by several key factors. The increasing prevalence of chronic diseases like cancer, cardiovascular ailments, and neurological disorders necessitates advanced diagnostic tools, fueling demand for multimodal imaging. Technological advancements, such as improved image resolution, faster scan times, and enhanced software capabilities, further contribute to market expansion. The integration of artificial intelligence (AI) in image analysis is another significant driver, promising improved diagnostic accuracy and efficiency. Furthermore, the rising adoption of minimally invasive procedures, which often require precise pre- and post-operative imaging, supports market growth. However, the high cost of equipment and procedures, coupled with stringent regulatory approvals, presents challenges to market expansion.
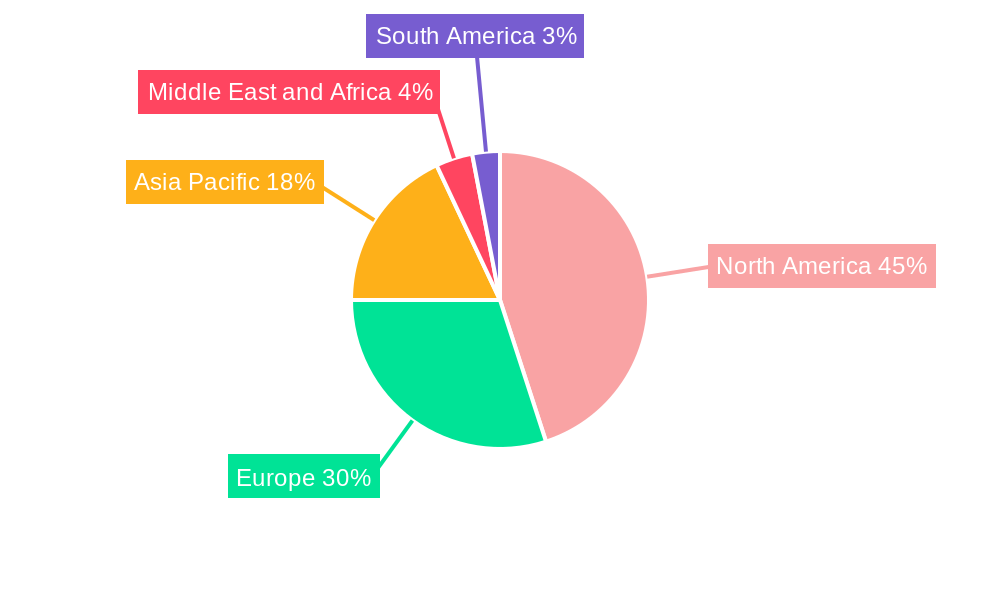
Market segmentation reveals oncology as the dominant application area, followed by cardiology and ophthalmology. Hospitals and diagnostic centers constitute the largest end-users. While North America currently holds a significant market share due to advanced healthcare infrastructure and high adoption rates, regions like Asia Pacific are demonstrating rapid growth potential, driven by increasing healthcare expenditure and rising awareness of advanced imaging technologies. Major players in the market, including Siemens Healthineers, GE Healthcare, and Philips, are continuously investing in research and development to maintain their competitive edge and cater to the evolving needs of healthcare professionals. The competitive landscape is characterized by intense innovation and strategic collaborations, further shaping the market's trajectory. The forecast period suggests continued growth, driven by technological advancements and an increasing need for accurate and efficient diagnostic tools across various healthcare specialties.
Multimodal Imaging Market: A Comprehensive Report (2019-2033)
This detailed report provides a comprehensive analysis of the global multimodal imaging market, covering the period from 2019 to 2033. It offers actionable insights into market dynamics, competitive landscapes, and future growth projections, making it an invaluable resource for industry stakeholders, investors, and researchers. The report segments the market by technology (PET/CT Systems, SPECT/CT Systems, PET/MR Systems, Others), application (Oncology, Ophthalmology, Cardiology, Others), and end-user (Hospitals, Diagnostic Centers, Others). The estimated market size in 2025 is valued at xx Million, with a projected CAGR of xx% during the forecast period (2025-2033).
Multimodal Imaging Market Market Structure & Competitive Dynamics
The multimodal imaging market exhibits a moderately consolidated structure, with key players holding significant market share. The market concentration is driven by factors including substantial R&D investments, stringent regulatory approvals, and high barriers to entry for new competitors. Innovation ecosystems are vibrant, with ongoing advancements in imaging technologies and data analytics driving market growth. Regulatory frameworks, particularly those concerning medical device approvals, play a significant role in shaping market dynamics. Product substitutes, such as advanced ultrasound and MRI technologies, exert competitive pressure. End-user trends, such as increasing preference for minimally invasive procedures and personalized medicine, are fueling demand for multimodal imaging systems. M&A activities have played a considerable role in shaping the market landscape, with deal values reaching xx Million in recent years. Key mergers and acquisitions are expected to continue shaping the sector's competitive dynamics, particularly among the top players listed below. Some key metrics include:
- Market Share: Siemens Healthineers, GE Healthcare, and Koninklijke Philips N V hold a combined market share of approximately xx%, while other players like Mediso Ltd, Spectrum Dynamics Medical, Neusoft Medical Systems Co Ltd, MILabs B V, and Bruker Corporation collectively account for approximately xx%.
- M&A Activity: Over the past five years, the average annual value of M&A deals in the multimodal imaging sector has been approximately xx Million.
Multimodal Imaging Market Industry Trends & Insights
The multimodal imaging market is experiencing robust growth, primarily driven by the rising prevalence of chronic diseases, technological advancements, and increasing demand for accurate and early diagnosis. Technological disruptions, including the integration of artificial intelligence (AI) and machine learning (ML) algorithms for image analysis and improved diagnostic accuracy, are significantly impacting market dynamics. Consumer preferences are shifting towards non-invasive and minimally invasive imaging modalities, which is driving demand for hybrid systems like PET/MR and SPECT/CT. Competitive dynamics are characterized by intense rivalry among established players and the emergence of innovative companies offering specialized solutions. The increasing adoption of advanced imaging technologies in various healthcare settings fuels the CAGR of xx%. The market penetration for multimodal imaging systems in developed regions is relatively high (xx%), while developing regions present significant growth opportunities. The market growth is also supported by favorable reimbursement policies and increasing healthcare expenditure globally.
Dominant Markets & Segments in Multimodal Imaging Market
The oncology segment holds the largest market share within the multimodal imaging application area, driven by the increasing prevalence of cancer and the need for precise diagnosis and treatment planning. The PET/CT segment dominates the technology landscape due to its established efficacy in cancer detection and staging. Hospitals and diagnostic centers account for the majority of end-user spending. Geographically, North America and Europe currently lead the market, fueled by strong healthcare infrastructure and high adoption rates. Key drivers for market dominance in these regions include:
- North America: High healthcare expenditure, strong technological infrastructure, and robust regulatory support.
- Europe: Significant investment in healthcare infrastructure, increasing prevalence of chronic diseases, and growing adoption of advanced imaging techniques.
- Asia-Pacific: Rapidly expanding healthcare infrastructure, rising disposable incomes, and increasing awareness of the benefits of early diagnosis.
Dominant Segments:
- By Technology: PET/CT Systems
- By Application: Oncology
- By End-User: Hospitals
Multimodal Imaging Market Product Innovations
Recent product innovations focus on enhancing image quality, reducing scan times, and improving diagnostic accuracy. The integration of AI and ML for automated image analysis and improved diagnostic workflow efficiency is a key trend. Miniaturization and improved portability are also gaining traction, making multimodal imaging systems more accessible in diverse settings. These advancements offer improved patient comfort and reduced healthcare costs while maintaining high diagnostic efficacy.
Report Segmentation & Scope
This report comprehensively segments the multimodal imaging market by technology, application, and end-user, providing detailed analysis of each segment's growth potential and market dynamics.
By Technology: The report analyzes PET/CT, SPECT/CT, PET/MR, and other imaging technologies, projecting their individual market sizes and growth trajectories. Competitive landscapes within each segment are also assessed.
By Application: The report examines the market across oncology, cardiology, ophthalmology, and other applications, identifying key growth drivers and challenges. Market size projections and competitive analysis are included for each application area.
By End-User: The report segments the market by hospitals, diagnostic centers, and other end-users, analyzing their unique needs and purchasing behaviors. Growth forecasts and market share data are provided for each segment.
Key Drivers of Multimodal Imaging Market Growth
The multimodal imaging market is experiencing robust growth driven by several factors, including:
- Technological Advancements: Integration of AI and ML for improved image analysis, miniaturization of systems, and development of novel imaging modalities.
- Rising Prevalence of Chronic Diseases: The increasing incidence of cancer, cardiovascular diseases, and other chronic conditions is driving demand for accurate and timely diagnosis.
- Favorable Reimbursement Policies: Government initiatives and favorable insurance coverage policies are encouraging the adoption of multimodal imaging systems.
Challenges in the Multimodal Imaging Market Sector
Despite the promising growth outlook, the multimodal imaging market faces certain challenges, including:
- High Initial Investment Costs: The substantial capital investment required to acquire and maintain multimodal imaging systems can be a barrier to adoption, especially for smaller healthcare providers.
- Stringent Regulatory Approvals: The complex regulatory landscape and lengthy approval processes for new imaging technologies can hinder market entry and expansion.
- Competition from Alternative Imaging Modalities: Advances in other imaging technologies, such as advanced ultrasound and MRI, pose a competitive threat to multimodal imaging systems.
Leading Players in the Multimodal Imaging Market Market
- Mediso Ltd
- Siemens Healthineers
- GE Healthcare
- Koninklijke Philips N V
- Spectrum Dynamics Medical
- Neusoft Medical Systems Co Ltd
- MILabs B V
- Bruker Corporation
Key Developments in Multimodal Imaging Market Sector
- 2023: Siemens Healthineers launched its new PET/CT scanner with advanced AI capabilities.
- 2022: GE Healthcare announced a strategic partnership to develop a novel PET/MR system with enhanced image resolution.
- 2021: Philips acquired a smaller imaging technology company to expand its product portfolio.
(Further detailed developments would be included in the full report)
Strategic Multimodal Imaging Market Market Outlook
The future of the multimodal imaging market looks promising, driven by ongoing technological advancements, the increasing prevalence of chronic diseases, and the growing demand for accurate and timely diagnosis. Strategic opportunities exist for companies focusing on developing innovative imaging technologies, integrating AI and ML for improved image analysis, and offering comprehensive diagnostic solutions. Expanding into emerging markets, particularly in developing countries, also presents significant growth potential. The focus will continue to be on improving diagnostic accuracy, patient comfort, and cost-effectiveness.
Multimodal Imaging Market Segmentation
-
1. Technology
- 1.1. PET/CT Systems
- 1.2. SPECT/CT Systems
- 1.3. PET/MR Systems
- 1.4. Others
-
2. Application
- 2.1. Oncology
- 2.2. Ophthalmology
- 2.3. Cardiology
- 2.4. Others
-
3. End-User
- 3.1. Hospitals
- 3.2. Diagnostic Centers
- 3.3. Others
Multimodal Imaging Market Segmentation By Geography
-
1. North America
- 1.1. United States
- 1.2. Canada
- 1.3. Mexico
-
2. Europe
- 2.1. Germany
- 2.2. United Kingdom
- 2.3. France
- 2.4. Italy
- 2.5. Spain
- 2.6. Rest of Europe
-
3. Asia Pacific
- 3.1. China
- 3.2. Japan
- 3.3. India
- 3.4. Australia
- 3.5. South Korea
- 3.6. Rest of Asia Pacific
-
4. Middle East and Africa
- 4.1. GCC
- 4.2. South Africa
- 4.3. Rest of Middle East and Africa
-
5. South America
- 5.1. Brazil
- 5.2. Argentina
- 5.3. Rest of South America
Multimodal Imaging Market REPORT HIGHLIGHTS
| Aspects | Details |
|---|---|
| Study Period | 2019-2033 |
| Base Year | 2024 |
| Estimated Year | 2025 |
| Forecast Period | 2025-2033 |
| Historical Period | 2019-2024 |
| Growth Rate | CAGR of 5.20% from 2019-2033 |
| Segmentation |
|
Table of Contents
- 1. Introduction
- 1.1. Research Scope
- 1.2. Market Segmentation
- 1.3. Research Methodology
- 1.4. Definitions and Assumptions
- 2. Executive Summary
- 2.1. Introduction
- 3. Market Dynamics
- 3.1. Introduction
- 3.2. Market Drivers
- 3.2.1. ; Growing Prevalence of Chronic Illness; Technological Advancements in Diagnostic Imaging Modalities
- 3.3. Market Restrains
- 3.3.1. ; High Cost of Multimodal Imaging Systems; Shortage of Adequate Healthcare Infrastructure
- 3.4. Market Trends
- 3.4.1. PET/CT Systems Segment is Expected to be the Fastest Growing Segment During the Forecast Period
- 4. Market Factor Analysis
- 4.1. Porters Five Forces
- 4.2. Supply/Value Chain
- 4.3. PESTEL analysis
- 4.4. Market Entropy
- 4.5. Patent/Trademark Analysis
- 5. Global Multimodal Imaging Market Analysis, Insights and Forecast, 2019-2031
- 5.1. Market Analysis, Insights and Forecast - by Technology
- 5.1.1. PET/CT Systems
- 5.1.2. SPECT/CT Systems
- 5.1.3. PET/MR Systems
- 5.1.4. Others
- 5.2. Market Analysis, Insights and Forecast - by Application
- 5.2.1. Oncology
- 5.2.2. Ophthalmology
- 5.2.3. Cardiology
- 5.2.4. Others
- 5.3. Market Analysis, Insights and Forecast - by End-User
- 5.3.1. Hospitals
- 5.3.2. Diagnostic Centers
- 5.3.3. Others
- 5.4. Market Analysis, Insights and Forecast - by Region
- 5.4.1. North America
- 5.4.2. Europe
- 5.4.3. Asia Pacific
- 5.4.4. Middle East and Africa
- 5.4.5. South America
- 5.1. Market Analysis, Insights and Forecast - by Technology
- 6. North America Multimodal Imaging Market Analysis, Insights and Forecast, 2019-2031
- 6.1. Market Analysis, Insights and Forecast - by Technology
- 6.1.1. PET/CT Systems
- 6.1.2. SPECT/CT Systems
- 6.1.3. PET/MR Systems
- 6.1.4. Others
- 6.2. Market Analysis, Insights and Forecast - by Application
- 6.2.1. Oncology
- 6.2.2. Ophthalmology
- 6.2.3. Cardiology
- 6.2.4. Others
- 6.3. Market Analysis, Insights and Forecast - by End-User
- 6.3.1. Hospitals
- 6.3.2. Diagnostic Centers
- 6.3.3. Others
- 6.1. Market Analysis, Insights and Forecast - by Technology
- 7. Europe Multimodal Imaging Market Analysis, Insights and Forecast, 2019-2031
- 7.1. Market Analysis, Insights and Forecast - by Technology
- 7.1.1. PET/CT Systems
- 7.1.2. SPECT/CT Systems
- 7.1.3. PET/MR Systems
- 7.1.4. Others
- 7.2. Market Analysis, Insights and Forecast - by Application
- 7.2.1. Oncology
- 7.2.2. Ophthalmology
- 7.2.3. Cardiology
- 7.2.4. Others
- 7.3. Market Analysis, Insights and Forecast - by End-User
- 7.3.1. Hospitals
- 7.3.2. Diagnostic Centers
- 7.3.3. Others
- 7.1. Market Analysis, Insights and Forecast - by Technology
- 8. Asia Pacific Multimodal Imaging Market Analysis, Insights and Forecast, 2019-2031
- 8.1. Market Analysis, Insights and Forecast - by Technology
- 8.1.1. PET/CT Systems
- 8.1.2. SPECT/CT Systems
- 8.1.3. PET/MR Systems
- 8.1.4. Others
- 8.2. Market Analysis, Insights and Forecast - by Application
- 8.2.1. Oncology
- 8.2.2. Ophthalmology
- 8.2.3. Cardiology
- 8.2.4. Others
- 8.3. Market Analysis, Insights and Forecast - by End-User
- 8.3.1. Hospitals
- 8.3.2. Diagnostic Centers
- 8.3.3. Others
- 8.1. Market Analysis, Insights and Forecast - by Technology
- 9. Middle East and Africa Multimodal Imaging Market Analysis, Insights and Forecast, 2019-2031
- 9.1. Market Analysis, Insights and Forecast - by Technology
- 9.1.1. PET/CT Systems
- 9.1.2. SPECT/CT Systems
- 9.1.3. PET/MR Systems
- 9.1.4. Others
- 9.2. Market Analysis, Insights and Forecast - by Application
- 9.2.1. Oncology
- 9.2.2. Ophthalmology
- 9.2.3. Cardiology
- 9.2.4. Others
- 9.3. Market Analysis, Insights and Forecast - by End-User
- 9.3.1. Hospitals
- 9.3.2. Diagnostic Centers
- 9.3.3. Others
- 9.1. Market Analysis, Insights and Forecast - by Technology
- 10. South America Multimodal Imaging Market Analysis, Insights and Forecast, 2019-2031
- 10.1. Market Analysis, Insights and Forecast - by Technology
- 10.1.1. PET/CT Systems
- 10.1.2. SPECT/CT Systems
- 10.1.3. PET/MR Systems
- 10.1.4. Others
- 10.2. Market Analysis, Insights and Forecast - by Application
- 10.2.1. Oncology
- 10.2.2. Ophthalmology
- 10.2.3. Cardiology
- 10.2.4. Others
- 10.3. Market Analysis, Insights and Forecast - by End-User
- 10.3.1. Hospitals
- 10.3.2. Diagnostic Centers
- 10.3.3. Others
- 10.1. Market Analysis, Insights and Forecast - by Technology
- 11. North America Multimodal Imaging Market Analysis, Insights and Forecast, 2019-2031
- 11.1. Market Analysis, Insights and Forecast - By Country/Sub-region
- 11.1.1 United States
- 11.1.2 Canada
- 11.1.3 Mexico
- 12. Europe Multimodal Imaging Market Analysis, Insights and Forecast, 2019-2031
- 12.1. Market Analysis, Insights and Forecast - By Country/Sub-region
- 12.1.1 Germany
- 12.1.2 United Kingdom
- 12.1.3 France
- 12.1.4 Italy
- 12.1.5 Spain
- 12.1.6 Rest of Europe
- 13. Asia Pacific Multimodal Imaging Market Analysis, Insights and Forecast, 2019-2031
- 13.1. Market Analysis, Insights and Forecast - By Country/Sub-region
- 13.1.1 China
- 13.1.2 Japan
- 13.1.3 India
- 13.1.4 Australia
- 13.1.5 South Korea
- 13.1.6 Rest of Asia Pacific
- 14. Middle East and Africa Multimodal Imaging Market Analysis, Insights and Forecast, 2019-2031
- 14.1. Market Analysis, Insights and Forecast - By Country/Sub-region
- 14.1.1 GCC
- 14.1.2 South Africa
- 14.1.3 Rest of Middle East and Africa
- 15. South America Multimodal Imaging Market Analysis, Insights and Forecast, 2019-2031
- 15.1. Market Analysis, Insights and Forecast - By Country/Sub-region
- 15.1.1 Brazil
- 15.1.2 Argentina
- 15.1.3 Rest of South America
- 16. Competitive Analysis
- 16.1. Global Market Share Analysis 2024
- 16.2. Company Profiles
- 16.2.1 Mediso Ltd
- 16.2.1.1. Overview
- 16.2.1.2. Products
- 16.2.1.3. SWOT Analysis
- 16.2.1.4. Recent Developments
- 16.2.1.5. Financials (Based on Availability)
- 16.2.2 Siemens Healthineers
- 16.2.2.1. Overview
- 16.2.2.2. Products
- 16.2.2.3. SWOT Analysis
- 16.2.2.4. Recent Developments
- 16.2.2.5. Financials (Based on Availability)
- 16.2.3 GE Healthcare
- 16.2.3.1. Overview
- 16.2.3.2. Products
- 16.2.3.3. SWOT Analysis
- 16.2.3.4. Recent Developments
- 16.2.3.5. Financials (Based on Availability)
- 16.2.4 Koninklijke Philips N V
- 16.2.4.1. Overview
- 16.2.4.2. Products
- 16.2.4.3. SWOT Analysis
- 16.2.4.4. Recent Developments
- 16.2.4.5. Financials (Based on Availability)
- 16.2.5 Spectrum Dynamics Medical
- 16.2.5.1. Overview
- 16.2.5.2. Products
- 16.2.5.3. SWOT Analysis
- 16.2.5.4. Recent Developments
- 16.2.5.5. Financials (Based on Availability)
- 16.2.6 Neusoft Medical Systems Co Ltd
- 16.2.6.1. Overview
- 16.2.6.2. Products
- 16.2.6.3. SWOT Analysis
- 16.2.6.4. Recent Developments
- 16.2.6.5. Financials (Based on Availability)
- 16.2.7 MILabs B V
- 16.2.7.1. Overview
- 16.2.7.2. Products
- 16.2.7.3. SWOT Analysis
- 16.2.7.4. Recent Developments
- 16.2.7.5. Financials (Based on Availability)
- 16.2.8 Bruker Corporation*List Not Exhaustive
- 16.2.8.1. Overview
- 16.2.8.2. Products
- 16.2.8.3. SWOT Analysis
- 16.2.8.4. Recent Developments
- 16.2.8.5. Financials (Based on Availability)
- 16.2.1 Mediso Ltd
List of Figures
- Figure 1: Global Multimodal Imaging Market Revenue Breakdown (Million, %) by Region 2024 & 2032
- Figure 2: North America Multimodal Imaging Market Revenue (Million), by Country 2024 & 2032
- Figure 3: North America Multimodal Imaging Market Revenue Share (%), by Country 2024 & 2032
- Figure 4: Europe Multimodal Imaging Market Revenue (Million), by Country 2024 & 2032
- Figure 5: Europe Multimodal Imaging Market Revenue Share (%), by Country 2024 & 2032
- Figure 6: Asia Pacific Multimodal Imaging Market Revenue (Million), by Country 2024 & 2032
- Figure 7: Asia Pacific Multimodal Imaging Market Revenue Share (%), by Country 2024 & 2032
- Figure 8: Middle East and Africa Multimodal Imaging Market Revenue (Million), by Country 2024 & 2032
- Figure 9: Middle East and Africa Multimodal Imaging Market Revenue Share (%), by Country 2024 & 2032
- Figure 10: South America Multimodal Imaging Market Revenue (Million), by Country 2024 & 2032
- Figure 11: South America Multimodal Imaging Market Revenue Share (%), by Country 2024 & 2032
- Figure 12: North America Multimodal Imaging Market Revenue (Million), by Technology 2024 & 2032
- Figure 13: North America Multimodal Imaging Market Revenue Share (%), by Technology 2024 & 2032
- Figure 14: North America Multimodal Imaging Market Revenue (Million), by Application 2024 & 2032
- Figure 15: North America Multimodal Imaging Market Revenue Share (%), by Application 2024 & 2032
- Figure 16: North America Multimodal Imaging Market Revenue (Million), by End-User 2024 & 2032
- Figure 17: North America Multimodal Imaging Market Revenue Share (%), by End-User 2024 & 2032
- Figure 18: North America Multimodal Imaging Market Revenue (Million), by Country 2024 & 2032
- Figure 19: North America Multimodal Imaging Market Revenue Share (%), by Country 2024 & 2032
- Figure 20: Europe Multimodal Imaging Market Revenue (Million), by Technology 2024 & 2032
- Figure 21: Europe Multimodal Imaging Market Revenue Share (%), by Technology 2024 & 2032
- Figure 22: Europe Multimodal Imaging Market Revenue (Million), by Application 2024 & 2032
- Figure 23: Europe Multimodal Imaging Market Revenue Share (%), by Application 2024 & 2032
- Figure 24: Europe Multimodal Imaging Market Revenue (Million), by End-User 2024 & 2032
- Figure 25: Europe Multimodal Imaging Market Revenue Share (%), by End-User 2024 & 2032
- Figure 26: Europe Multimodal Imaging Market Revenue (Million), by Country 2024 & 2032
- Figure 27: Europe Multimodal Imaging Market Revenue Share (%), by Country 2024 & 2032
- Figure 28: Asia Pacific Multimodal Imaging Market Revenue (Million), by Technology 2024 & 2032
- Figure 29: Asia Pacific Multimodal Imaging Market Revenue Share (%), by Technology 2024 & 2032
- Figure 30: Asia Pacific Multimodal Imaging Market Revenue (Million), by Application 2024 & 2032
- Figure 31: Asia Pacific Multimodal Imaging Market Revenue Share (%), by Application 2024 & 2032
- Figure 32: Asia Pacific Multimodal Imaging Market Revenue (Million), by End-User 2024 & 2032
- Figure 33: Asia Pacific Multimodal Imaging Market Revenue Share (%), by End-User 2024 & 2032
- Figure 34: Asia Pacific Multimodal Imaging Market Revenue (Million), by Country 2024 & 2032
- Figure 35: Asia Pacific Multimodal Imaging Market Revenue Share (%), by Country 2024 & 2032
- Figure 36: Middle East and Africa Multimodal Imaging Market Revenue (Million), by Technology 2024 & 2032
- Figure 37: Middle East and Africa Multimodal Imaging Market Revenue Share (%), by Technology 2024 & 2032
- Figure 38: Middle East and Africa Multimodal Imaging Market Revenue (Million), by Application 2024 & 2032
- Figure 39: Middle East and Africa Multimodal Imaging Market Revenue Share (%), by Application 2024 & 2032
- Figure 40: Middle East and Africa Multimodal Imaging Market Revenue (Million), by End-User 2024 & 2032
- Figure 41: Middle East and Africa Multimodal Imaging Market Revenue Share (%), by End-User 2024 & 2032
- Figure 42: Middle East and Africa Multimodal Imaging Market Revenue (Million), by Country 2024 & 2032
- Figure 43: Middle East and Africa Multimodal Imaging Market Revenue Share (%), by Country 2024 & 2032
- Figure 44: South America Multimodal Imaging Market Revenue (Million), by Technology 2024 & 2032
- Figure 45: South America Multimodal Imaging Market Revenue Share (%), by Technology 2024 & 2032
- Figure 46: South America Multimodal Imaging Market Revenue (Million), by Application 2024 & 2032
- Figure 47: South America Multimodal Imaging Market Revenue Share (%), by Application 2024 & 2032
- Figure 48: South America Multimodal Imaging Market Revenue (Million), by End-User 2024 & 2032
- Figure 49: South America Multimodal Imaging Market Revenue Share (%), by End-User 2024 & 2032
- Figure 50: South America Multimodal Imaging Market Revenue (Million), by Country 2024 & 2032
- Figure 51: South America Multimodal Imaging Market Revenue Share (%), by Country 2024 & 2032
List of Tables
- Table 1: Global Multimodal Imaging Market Revenue Million Forecast, by Region 2019 & 2032
- Table 2: Global Multimodal Imaging Market Revenue Million Forecast, by Technology 2019 & 2032
- Table 3: Global Multimodal Imaging Market Revenue Million Forecast, by Application 2019 & 2032
- Table 4: Global Multimodal Imaging Market Revenue Million Forecast, by End-User 2019 & 2032
- Table 5: Global Multimodal Imaging Market Revenue Million Forecast, by Region 2019 & 2032
- Table 6: Global Multimodal Imaging Market Revenue Million Forecast, by Country 2019 & 2032
- Table 7: United States Multimodal Imaging Market Revenue (Million) Forecast, by Application 2019 & 2032
- Table 8: Canada Multimodal Imaging Market Revenue (Million) Forecast, by Application 2019 & 2032
- Table 9: Mexico Multimodal Imaging Market Revenue (Million) Forecast, by Application 2019 & 2032
- Table 10: Global Multimodal Imaging Market Revenue Million Forecast, by Country 2019 & 2032
- Table 11: Germany Multimodal Imaging Market Revenue (Million) Forecast, by Application 2019 & 2032
- Table 12: United Kingdom Multimodal Imaging Market Revenue (Million) Forecast, by Application 2019 & 2032
- Table 13: France Multimodal Imaging Market Revenue (Million) Forecast, by Application 2019 & 2032
- Table 14: Italy Multimodal Imaging Market Revenue (Million) Forecast, by Application 2019 & 2032
- Table 15: Spain Multimodal Imaging Market Revenue (Million) Forecast, by Application 2019 & 2032
- Table 16: Rest of Europe Multimodal Imaging Market Revenue (Million) Forecast, by Application 2019 & 2032
- Table 17: Global Multimodal Imaging Market Revenue Million Forecast, by Country 2019 & 2032
- Table 18: China Multimodal Imaging Market Revenue (Million) Forecast, by Application 2019 & 2032
- Table 19: Japan Multimodal Imaging Market Revenue (Million) Forecast, by Application 2019 & 2032
- Table 20: India Multimodal Imaging Market Revenue (Million) Forecast, by Application 2019 & 2032
- Table 21: Australia Multimodal Imaging Market Revenue (Million) Forecast, by Application 2019 & 2032
- Table 22: South Korea Multimodal Imaging Market Revenue (Million) Forecast, by Application 2019 & 2032
- Table 23: Rest of Asia Pacific Multimodal Imaging Market Revenue (Million) Forecast, by Application 2019 & 2032
- Table 24: Global Multimodal Imaging Market Revenue Million Forecast, by Country 2019 & 2032
- Table 25: GCC Multimodal Imaging Market Revenue (Million) Forecast, by Application 2019 & 2032
- Table 26: South Africa Multimodal Imaging Market Revenue (Million) Forecast, by Application 2019 & 2032
- Table 27: Rest of Middle East and Africa Multimodal Imaging Market Revenue (Million) Forecast, by Application 2019 & 2032
- Table 28: Global Multimodal Imaging Market Revenue Million Forecast, by Country 2019 & 2032
- Table 29: Brazil Multimodal Imaging Market Revenue (Million) Forecast, by Application 2019 & 2032
- Table 30: Argentina Multimodal Imaging Market Revenue (Million) Forecast, by Application 2019 & 2032
- Table 31: Rest of South America Multimodal Imaging Market Revenue (Million) Forecast, by Application 2019 & 2032
- Table 32: Global Multimodal Imaging Market Revenue Million Forecast, by Technology 2019 & 2032
- Table 33: Global Multimodal Imaging Market Revenue Million Forecast, by Application 2019 & 2032
- Table 34: Global Multimodal Imaging Market Revenue Million Forecast, by End-User 2019 & 2032
- Table 35: Global Multimodal Imaging Market Revenue Million Forecast, by Country 2019 & 2032
- Table 36: United States Multimodal Imaging Market Revenue (Million) Forecast, by Application 2019 & 2032
- Table 37: Canada Multimodal Imaging Market Revenue (Million) Forecast, by Application 2019 & 2032
- Table 38: Mexico Multimodal Imaging Market Revenue (Million) Forecast, by Application 2019 & 2032
- Table 39: Global Multimodal Imaging Market Revenue Million Forecast, by Technology 2019 & 2032
- Table 40: Global Multimodal Imaging Market Revenue Million Forecast, by Application 2019 & 2032
- Table 41: Global Multimodal Imaging Market Revenue Million Forecast, by End-User 2019 & 2032
- Table 42: Global Multimodal Imaging Market Revenue Million Forecast, by Country 2019 & 2032
- Table 43: Germany Multimodal Imaging Market Revenue (Million) Forecast, by Application 2019 & 2032
- Table 44: United Kingdom Multimodal Imaging Market Revenue (Million) Forecast, by Application 2019 & 2032
- Table 45: France Multimodal Imaging Market Revenue (Million) Forecast, by Application 2019 & 2032
- Table 46: Italy Multimodal Imaging Market Revenue (Million) Forecast, by Application 2019 & 2032
- Table 47: Spain Multimodal Imaging Market Revenue (Million) Forecast, by Application 2019 & 2032
- Table 48: Rest of Europe Multimodal Imaging Market Revenue (Million) Forecast, by Application 2019 & 2032
- Table 49: Global Multimodal Imaging Market Revenue Million Forecast, by Technology 2019 & 2032
- Table 50: Global Multimodal Imaging Market Revenue Million Forecast, by Application 2019 & 2032
- Table 51: Global Multimodal Imaging Market Revenue Million Forecast, by End-User 2019 & 2032
- Table 52: Global Multimodal Imaging Market Revenue Million Forecast, by Country 2019 & 2032
- Table 53: China Multimodal Imaging Market Revenue (Million) Forecast, by Application 2019 & 2032
- Table 54: Japan Multimodal Imaging Market Revenue (Million) Forecast, by Application 2019 & 2032
- Table 55: India Multimodal Imaging Market Revenue (Million) Forecast, by Application 2019 & 2032
- Table 56: Australia Multimodal Imaging Market Revenue (Million) Forecast, by Application 2019 & 2032
- Table 57: South Korea Multimodal Imaging Market Revenue (Million) Forecast, by Application 2019 & 2032
- Table 58: Rest of Asia Pacific Multimodal Imaging Market Revenue (Million) Forecast, by Application 2019 & 2032
- Table 59: Global Multimodal Imaging Market Revenue Million Forecast, by Technology 2019 & 2032
- Table 60: Global Multimodal Imaging Market Revenue Million Forecast, by Application 2019 & 2032
- Table 61: Global Multimodal Imaging Market Revenue Million Forecast, by End-User 2019 & 2032
- Table 62: Global Multimodal Imaging Market Revenue Million Forecast, by Country 2019 & 2032
- Table 63: GCC Multimodal Imaging Market Revenue (Million) Forecast, by Application 2019 & 2032
- Table 64: South Africa Multimodal Imaging Market Revenue (Million) Forecast, by Application 2019 & 2032
- Table 65: Rest of Middle East and Africa Multimodal Imaging Market Revenue (Million) Forecast, by Application 2019 & 2032
- Table 66: Global Multimodal Imaging Market Revenue Million Forecast, by Technology 2019 & 2032
- Table 67: Global Multimodal Imaging Market Revenue Million Forecast, by Application 2019 & 2032
- Table 68: Global Multimodal Imaging Market Revenue Million Forecast, by End-User 2019 & 2032
- Table 69: Global Multimodal Imaging Market Revenue Million Forecast, by Country 2019 & 2032
- Table 70: Brazil Multimodal Imaging Market Revenue (Million) Forecast, by Application 2019 & 2032
- Table 71: Argentina Multimodal Imaging Market Revenue (Million) Forecast, by Application 2019 & 2032
- Table 72: Rest of South America Multimodal Imaging Market Revenue (Million) Forecast, by Application 2019 & 2032
Frequently Asked Questions
1. What is the projected Compound Annual Growth Rate (CAGR) of the Multimodal Imaging Market?
The projected CAGR is approximately 5.20%.
2. Which companies are prominent players in the Multimodal Imaging Market?
Key companies in the market include Mediso Ltd, Siemens Healthineers, GE Healthcare, Koninklijke Philips N V, Spectrum Dynamics Medical, Neusoft Medical Systems Co Ltd, MILabs B V, Bruker Corporation*List Not Exhaustive.
3. What are the main segments of the Multimodal Imaging Market?
The market segments include Technology, Application, End-User.
4. Can you provide details about the market size?
The market size is estimated to be USD XX Million as of 2022.
5. What are some drivers contributing to market growth?
; Growing Prevalence of Chronic Illness; Technological Advancements in Diagnostic Imaging Modalities.
6. What are the notable trends driving market growth?
PET/CT Systems Segment is Expected to be the Fastest Growing Segment During the Forecast Period.
7. Are there any restraints impacting market growth?
; High Cost of Multimodal Imaging Systems; Shortage of Adequate Healthcare Infrastructure.
8. Can you provide examples of recent developments in the market?
N/A
9. What pricing options are available for accessing the report?
Pricing options include single-user, multi-user, and enterprise licenses priced at USD 4750, USD 5250, and USD 8750 respectively.
10. Is the market size provided in terms of value or volume?
The market size is provided in terms of value, measured in Million.
11. Are there any specific market keywords associated with the report?
Yes, the market keyword associated with the report is "Multimodal Imaging Market," which aids in identifying and referencing the specific market segment covered.
12. How do I determine which pricing option suits my needs best?
The pricing options vary based on user requirements and access needs. Individual users may opt for single-user licenses, while businesses requiring broader access may choose multi-user or enterprise licenses for cost-effective access to the report.
13. Are there any additional resources or data provided in the Multimodal Imaging Market report?
While the report offers comprehensive insights, it's advisable to review the specific contents or supplementary materials provided to ascertain if additional resources or data are available.
14. How can I stay updated on further developments or reports in the Multimodal Imaging Market?
To stay informed about further developments, trends, and reports in the Multimodal Imaging Market, consider subscribing to industry newsletters, following relevant companies and organizations, or regularly checking reputable industry news sources and publications.
Methodology
Step 1 - Identification of Relevant Samples Size from Population Database


Step 2 - Approaches for Defining Global Market Size (Value, Volume* & Price*)

Note*: In applicable scenarios
Step 3 - Data Sources
Primary Research
- Web Analytics
- Survey Reports
- Research Institute
- Latest Research Reports
- Opinion Leaders
Secondary Research
- Annual Reports
- White Paper
- Latest Press Release
- Industry Association
- Paid Database
- Investor Presentations

Step 4 - Data Triangulation
Involves using different sources of information in order to increase the validity of a study
These sources are likely to be stakeholders in a program - participants, other researchers, program staff, other community members, and so on.
Then we put all data in single framework & apply various statistical tools to find out the dynamic on the market.
During the analysis stage, feedback from the stakeholder groups would be compared to determine areas of agreement as well as areas of divergence


