
Key Insights
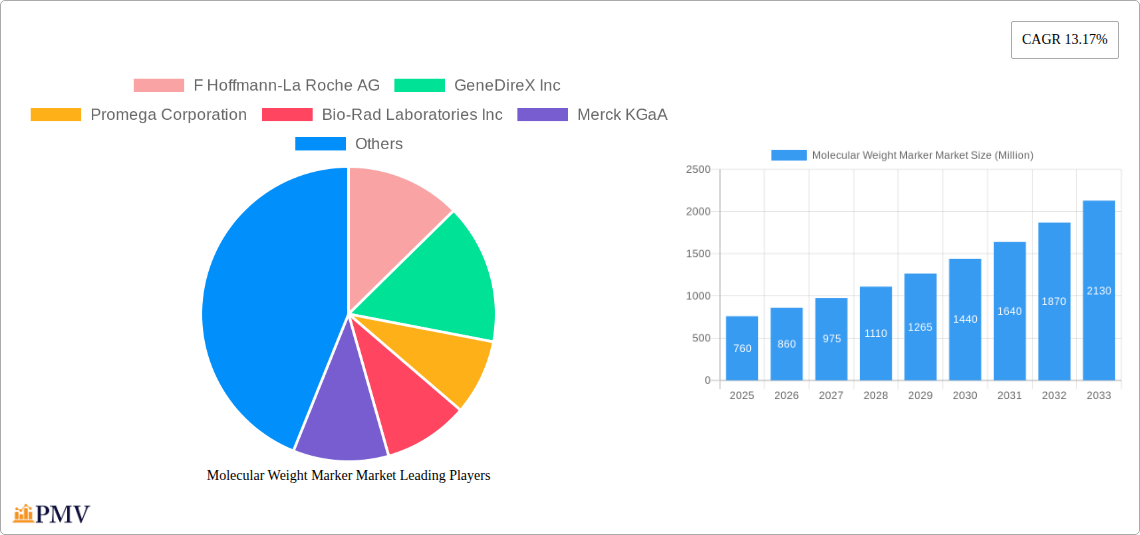
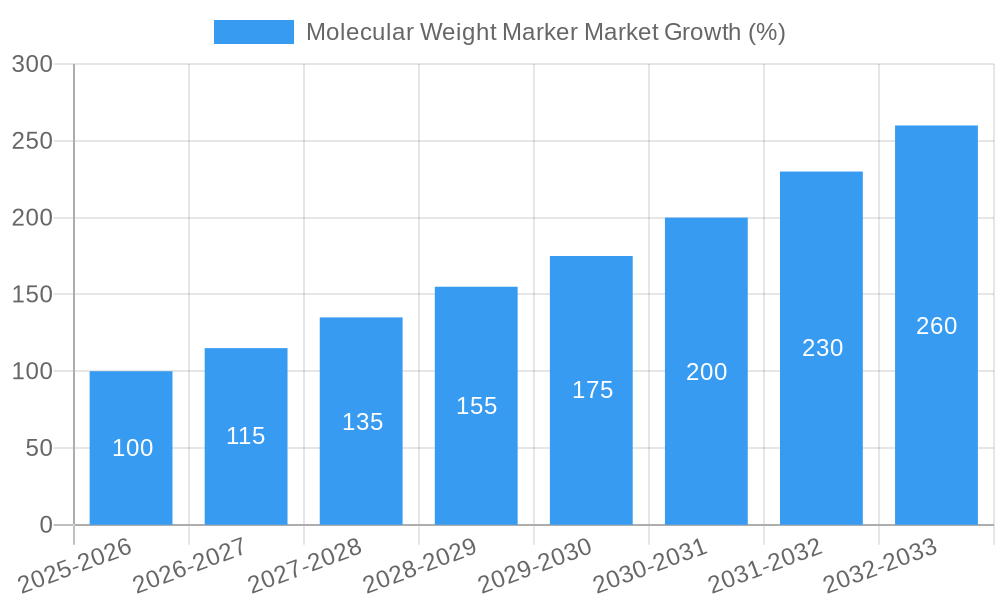
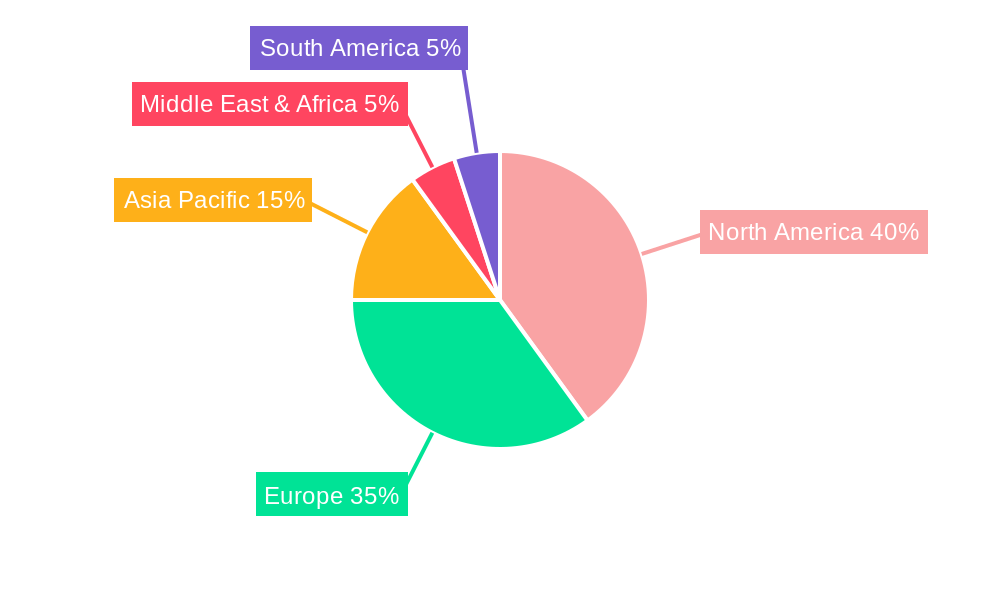
The global molecular weight marker market, valued at $0.76 billion in 2025, is projected to experience robust growth, driven by the increasing adoption of advanced molecular biology techniques across research and clinical diagnostics. A compound annual growth rate (CAGR) of 13.17% from 2025 to 2033 indicates a significant expansion, reaching an estimated market value exceeding $2.5 billion by 2033. This growth is fueled by several key factors. The rising prevalence of chronic diseases necessitates more sophisticated diagnostic tools, increasing the demand for accurate molecular weight markers in applications like Western blotting and PCR. Furthermore, advancements in genomics and proteomics research are pushing the development of more specialized and high-performance markers, broadening the market's applications. The market is segmented by product type (DNA, RNA, and protein markers), application (nucleic acid and proteomics applications), and type (prestained, unstained, and specialty markers). The Nucleic Acid Application segment currently holds the largest market share due to widespread use in PCR and other related techniques. Pre-stained markers are gaining popularity due to their ease of use and enhanced visualization. North America and Europe currently dominate the market, owing to well-established research infrastructure and higher healthcare spending. However, the Asia-Pacific region is expected to witness significant growth in the coming years, driven by expanding healthcare investments and increasing research activities. Competitive landscape is characterized by a mix of large multinational corporations and specialized smaller companies, resulting in continuous innovation and a diverse product portfolio.
The competitive intensity is expected to remain high, with companies focusing on strategic partnerships, acquisitions, and the development of novel marker technologies to maintain their market share. The market faces certain restraints, including the high cost of advanced markers and the need for specialized expertise for their utilization. However, the continued advancements in technology, coupled with the growing demand for precise and reliable molecular weight determination in various fields, are poised to overcome these limitations and drive substantial market expansion throughout the forecast period. The increasing availability of high-throughput screening technologies and the development of more user-friendly kits are expected to further stimulate market growth. Future growth will depend on continued technological improvements, expanded applications in emerging fields like personalized medicine, and increasing government funding for research and development in life sciences.
Molecular Weight Marker Market: A Comprehensive Report (2019-2033)
This in-depth report provides a comprehensive analysis of the Molecular Weight Marker market, offering valuable insights into market dynamics, competitive landscapes, and future growth prospects. Covering the period from 2019 to 2033, with a base year of 2025 and a forecast period from 2025 to 2033, this report is an essential resource for industry stakeholders seeking to understand and capitalize on the opportunities within this rapidly evolving sector. The report's detailed segmentation allows for a granular understanding of various market aspects, contributing to effective strategic decision-making. The global market size is projected to reach xx Million by 2033.
Molecular Weight Marker Market Structure & Competitive Dynamics
The molecular weight marker market is characterized by a moderately concentrated structure, with several key players holding significant market share. The market exhibits a dynamic competitive landscape driven by continuous innovation, strategic mergers and acquisitions (M&A), and evolving regulatory frameworks. Key players leverage their established brand recognition, extensive product portfolios, and strong distribution networks to maintain their competitive edge. The market's innovation ecosystem thrives on advancements in biotechnology and analytical techniques, leading to the development of novel markers with enhanced performance characteristics. Product substitution is limited due to the specific requirements of different applications, although cost-effective alternatives from smaller players occasionally emerge. End-user trends towards automation, higher throughput, and improved accuracy shape product development and market demand. Recent M&A activities reflect a strategic consolidation trend, with larger companies seeking to expand their product lines and geographical reach. For example, the August 2022 acquisition of Curiosity Diagnostics by Bio-Rad Laboratories, Inc. exemplifies this trend. This deal's value is estimated at xx Million. Market share analysis reveals that the top 5 players account for approximately xx% of the global market, highlighting the competitive intensity. The regulatory landscape varies across regions, influencing market access and product approvals.
- Market Concentration: Moderately concentrated, with top 5 players holding approximately xx% market share.
- Innovation Ecosystem: Driven by advancements in biotechnology and analytical techniques.
- Regulatory Frameworks: Vary across regions, impacting market access and product approvals.
- M&A Activities: Strategic consolidation, with deals valued at xx Million in recent years.
- Product Substitutes: Limited, due to application-specific requirements.
- End-user Trends: Automation, higher throughput, improved accuracy driving demand.
Molecular Weight Marker Market Industry Trends & Insights
The molecular weight marker market is experiencing robust growth, driven by the increasing adoption of molecular biology techniques across diverse research and clinical applications. The market's Compound Annual Growth Rate (CAGR) during the forecast period (2025-2033) is estimated at xx%. This growth is fueled by several factors: the expansion of genomics research, the rising prevalence of chronic diseases driving diagnostic testing needs, and the continuous technological advancements leading to the development of more efficient and accurate molecular weight markers. Technological disruptions, such as the development of next-generation sequencing technologies and advanced imaging techniques, are further expanding market opportunities. Consumer preferences are shifting towards convenient, high-throughput, and cost-effective markers. Competitive dynamics are marked by intense rivalry among established players and the emergence of innovative startups offering specialized solutions. Market penetration is highest in developed regions like North America and Europe, while emerging economies show significant growth potential. The increasing demand for personalized medicine and precision diagnostics is also bolstering market growth.
Dominant Markets & Segments in Molecular Weight Marker Market
The North American region currently dominates the molecular weight marker market, driven by factors such as robust research funding, advanced healthcare infrastructure, and the high adoption rate of molecular biology techniques. Within the market segments, DNA markers represent the largest share, followed by protein and RNA markers. Nucleic acid applications, particularly PCR and molecular cloning, account for a significant portion of overall market demand. Pre-stained markers are more popular due to their ease of use and convenience, while the specialty marker segment showcases the highest growth potential.
Key Drivers:
- North America: High research funding, advanced infrastructure, high adoption rate of molecular biology techniques.
- Europe: Strong research base, stringent regulatory environment.
- Asia-Pacific: Rapid growth due to expanding healthcare infrastructure and increasing research activity.
Dominant Segments:
- Product: DNA markers hold the largest market share, followed by protein and RNA markers.
- Application: Nucleic acid applications (PCR, Molecular Cloning) are most prevalent, with Proteomics applications (Western Blotting) showing significant growth.
- Type: Pre-stained markers are the dominant type, with specialty markers exhibiting the fastest growth rate.
Molecular Weight Marker Market Product Innovations
Recent innovations in molecular weight markers focus on enhancing accuracy, sensitivity, and ease of use. Developments include pre-stained markers with improved resolution and stability, as well as specialized markers designed for specific applications, such as next-generation sequencing. These innovations address the market's growing demand for high-throughput, reliable, and cost-effective solutions. The integration of advanced technologies, such as fluorescence labeling and improved gel electrophoresis techniques, further enhances the performance of molecular weight markers, improving market fit and creating a competitive advantage for manufacturers.
Report Segmentation & Scope
This report segments the molecular weight marker market based on product (DNA Marker, Protein Marker, RNA Marker), application (Nucleic Acid Application: PCR, Northern Blotting, Southern Blotting, Molecular Cloning, and Other Nucleic Acid Applications; Proteomics Application: Western Blotting, Gel Extraction, and Other Proteomics Applications), and type (Prestained Marker, Unstained Marker, Specialty Marker). Each segment's growth projection, market size, and competitive dynamics are analyzed in detail, providing a comprehensive understanding of the market's structure and evolution. For example, the DNA marker segment is projected to experience a CAGR of xx% during the forecast period, driven by the increasing demand for genomics research. Similarly, the prestained marker segment is expected to dominate due to its ease of use and time-saving features. The competitive dynamics within each segment vary based on factors such as technological advancements and the presence of established players.
Key Drivers of Molecular Weight Marker Market Growth
The molecular weight marker market's growth is primarily driven by the burgeoning life sciences research sector, rising prevalence of chronic diseases necessitating advanced diagnostic tools, and increased funding for genomics and proteomics research. Furthermore, technological advancements leading to improved marker accuracy, sensitivity, and ease-of-use significantly contribute to the market’s expansion. Stringent regulatory frameworks in certain regions, while posing challenges, also drive the need for high-quality, validated markers. The rising adoption of automated techniques in laboratories further fuels market growth.
Challenges in the Molecular Weight Marker Market Sector
The molecular weight marker market faces challenges including stringent regulatory approvals, fluctuating raw material prices impacting production costs, and intense competition among existing players. These factors can lead to price pressure and impact profitability. Supply chain disruptions can also affect product availability and delivery timelines, especially during periods of high demand. The need for continuous innovation to meet evolving research and diagnostic needs is a constant pressure. The overall impact of these challenges is estimated to reduce market growth by approximately xx% during the forecast period.
Leading Players in the Molecular Weight Marker Market
- F Hoffmann-La Roche AG
- GeneDireX Inc
- Promega Corporation
- Bio-Rad Laboratories Inc
- Merck KGaA
- Thermo Fisher Scientific Inc
- New England Biolabs
- VWR International
- Takara Bio Inc
- QIAGEN N V
- Agilent Technologies Inc
- HiMedia Laboratories
Key Developments in Molecular Weight Marker Market Sector
- November 2022: Creative Enzymes launched a new line of highly efficient and cost-effective DNA markers and ladders, enhancing market competitiveness.
- August 2022: Bio-Rad Laboratories, Inc. acquired Curiosity Diagnostics, strengthening its position in molecular diagnostics and expanding its product portfolio.
Strategic Molecular Weight Marker Market Outlook
The molecular weight marker market is poised for continued growth, driven by ongoing advancements in molecular biology and the increasing demand for sophisticated diagnostic tools. Strategic opportunities lie in developing innovative markers with enhanced performance characteristics, catering to emerging applications like next-generation sequencing and personalized medicine. Expanding into emerging markets with high growth potential and forging strategic partnerships to enhance market reach and distribution are also crucial for success. Focusing on cost-effectiveness and user-friendliness will remain crucial for capturing market share in a highly competitive environment.
Molecular Weight Marker Market Segmentation
-
1. Product
- 1.1. DNA Marker
- 1.2. Protein Marker
- 1.3. RNA Marker
-
2. Application
- 2.1. Nucleic
- 2.2. Proteomi
-
3. Type
- 3.1. Prestained Marker
- 3.2. Unstained Marker
- 3.3. Specialty Marker
Molecular Weight Marker Market Segmentation By Geography
-
1. North America
- 1.1. United States
- 1.2. Canada
- 1.3. Mexico
-
2. Europe
- 2.1. Germany
- 2.2. United Kingdom
- 2.3. France
- 2.4. Italy
- 2.5. Spain
- 2.6. Rest of Europe
-
3. Asia Pacific
- 3.1. China
- 3.2. Japan
- 3.3. India
- 3.4. Australia
- 3.5. South korea
- 3.6. Rest of Asia Pacific
-
4. Middle East and Africa
- 4.1. GCC
- 4.2. South Africa
- 4.3. Rest of Middle East and Africa
-
5. South America
- 5.1. Brazil
- 5.2. Argentina
- 5.3. Rest of South America
Molecular Weight Marker Market REPORT HIGHLIGHTS
| Aspects | Details |
|---|---|
| Study Period | 2019-2033 |
| Base Year | 2024 |
| Estimated Year | 2025 |
| Forecast Period | 2025-2033 |
| Historical Period | 2019-2024 |
| Growth Rate | CAGR of 13.17% from 2019-2033 |
| Segmentation |
|
Table of Contents
- 1. Introduction
- 1.1. Research Scope
- 1.2. Market Segmentation
- 1.3. Research Methodology
- 1.4. Definitions and Assumptions
- 2. Executive Summary
- 2.1. Introduction
- 3. Market Dynamics
- 3.1. Introduction
- 3.2. Market Drivers
- 3.2.1. Increasing Investment on R&D; Growing Focus on Proteomics and Genomics Technologies Research
- 3.3. Market Restrains
- 3.3.1. Lack of Skilled Healthcare Professionals; Strict Government Regulations
- 3.4. Market Trends
- 3.4.1. RNA Marker Segment is Expected to Show Significant Growth Over the Forecast Period
- 4. Market Factor Analysis
- 4.1. Porters Five Forces
- 4.2. Supply/Value Chain
- 4.3. PESTEL analysis
- 4.4. Market Entropy
- 4.5. Patent/Trademark Analysis
- 5. Global Molecular Weight Marker Market Analysis, Insights and Forecast, 2019-2031
- 5.1. Market Analysis, Insights and Forecast - by Product
- 5.1.1. DNA Marker
- 5.1.2. Protein Marker
- 5.1.3. RNA Marker
- 5.2. Market Analysis, Insights and Forecast - by Application
- 5.2.1. Nucleic
- 5.2.2. Proteomi
- 5.3. Market Analysis, Insights and Forecast - by Type
- 5.3.1. Prestained Marker
- 5.3.2. Unstained Marker
- 5.3.3. Specialty Marker
- 5.4. Market Analysis, Insights and Forecast - by Region
- 5.4.1. North America
- 5.4.2. Europe
- 5.4.3. Asia Pacific
- 5.4.4. Middle East and Africa
- 5.4.5. South America
- 5.1. Market Analysis, Insights and Forecast - by Product
- 6. North America Molecular Weight Marker Market Analysis, Insights and Forecast, 2019-2031
- 6.1. Market Analysis, Insights and Forecast - by Product
- 6.1.1. DNA Marker
- 6.1.2. Protein Marker
- 6.1.3. RNA Marker
- 6.2. Market Analysis, Insights and Forecast - by Application
- 6.2.1. Nucleic
- 6.2.2. Proteomi
- 6.3. Market Analysis, Insights and Forecast - by Type
- 6.3.1. Prestained Marker
- 6.3.2. Unstained Marker
- 6.3.3. Specialty Marker
- 6.1. Market Analysis, Insights and Forecast - by Product
- 7. Europe Molecular Weight Marker Market Analysis, Insights and Forecast, 2019-2031
- 7.1. Market Analysis, Insights and Forecast - by Product
- 7.1.1. DNA Marker
- 7.1.2. Protein Marker
- 7.1.3. RNA Marker
- 7.2. Market Analysis, Insights and Forecast - by Application
- 7.2.1. Nucleic
- 7.2.2. Proteomi
- 7.3. Market Analysis, Insights and Forecast - by Type
- 7.3.1. Prestained Marker
- 7.3.2. Unstained Marker
- 7.3.3. Specialty Marker
- 7.1. Market Analysis, Insights and Forecast - by Product
- 8. Asia Pacific Molecular Weight Marker Market Analysis, Insights and Forecast, 2019-2031
- 8.1. Market Analysis, Insights and Forecast - by Product
- 8.1.1. DNA Marker
- 8.1.2. Protein Marker
- 8.1.3. RNA Marker
- 8.2. Market Analysis, Insights and Forecast - by Application
- 8.2.1. Nucleic
- 8.2.2. Proteomi
- 8.3. Market Analysis, Insights and Forecast - by Type
- 8.3.1. Prestained Marker
- 8.3.2. Unstained Marker
- 8.3.3. Specialty Marker
- 8.1. Market Analysis, Insights and Forecast - by Product
- 9. Middle East and Africa Molecular Weight Marker Market Analysis, Insights and Forecast, 2019-2031
- 9.1. Market Analysis, Insights and Forecast - by Product
- 9.1.1. DNA Marker
- 9.1.2. Protein Marker
- 9.1.3. RNA Marker
- 9.2. Market Analysis, Insights and Forecast - by Application
- 9.2.1. Nucleic
- 9.2.2. Proteomi
- 9.3. Market Analysis, Insights and Forecast - by Type
- 9.3.1. Prestained Marker
- 9.3.2. Unstained Marker
- 9.3.3. Specialty Marker
- 9.1. Market Analysis, Insights and Forecast - by Product
- 10. South America Molecular Weight Marker Market Analysis, Insights and Forecast, 2019-2031
- 10.1. Market Analysis, Insights and Forecast - by Product
- 10.1.1. DNA Marker
- 10.1.2. Protein Marker
- 10.1.3. RNA Marker
- 10.2. Market Analysis, Insights and Forecast - by Application
- 10.2.1. Nucleic
- 10.2.2. Proteomi
- 10.3. Market Analysis, Insights and Forecast - by Type
- 10.3.1. Prestained Marker
- 10.3.2. Unstained Marker
- 10.3.3. Specialty Marker
- 10.1. Market Analysis, Insights and Forecast - by Product
- 11. North America Molecular Weight Marker Market Analysis, Insights and Forecast, 2019-2031
- 11.1. Market Analysis, Insights and Forecast - By Country/Sub-region
- 11.1.1 United States
- 11.1.2 Canada
- 11.1.3 Mexico
- 12. Europe Molecular Weight Marker Market Analysis, Insights and Forecast, 2019-2031
- 12.1. Market Analysis, Insights and Forecast - By Country/Sub-region
- 12.1.1 Germany
- 12.1.2 United Kingdom
- 12.1.3 France
- 12.1.4 Italy
- 12.1.5 Spain
- 12.1.6 Rest of Europe
- 13. Asia Pacific Molecular Weight Marker Market Analysis, Insights and Forecast, 2019-2031
- 13.1. Market Analysis, Insights and Forecast - By Country/Sub-region
- 13.1.1 China
- 13.1.2 Japan
- 13.1.3 India
- 13.1.4 Australia
- 13.1.5 South korea
- 13.1.6 Rest of Asia Pacific
- 14. Middle East and Africa Molecular Weight Marker Market Analysis, Insights and Forecast, 2019-2031
- 14.1. Market Analysis, Insights and Forecast - By Country/Sub-region
- 14.1.1 GCC
- 14.1.2 South Africa
- 14.1.3 Rest of Middle East and Africa
- 15. South America Molecular Weight Marker Market Analysis, Insights and Forecast, 2019-2031
- 15.1. Market Analysis, Insights and Forecast - By Country/Sub-region
- 15.1.1 Brazil
- 15.1.2 Argentina
- 15.1.3 Rest of South America
- 16. Competitive Analysis
- 16.1. Global Market Share Analysis 2024
- 16.2. Company Profiles
- 16.2.1 F Hoffmann-La Roche AG
- 16.2.1.1. Overview
- 16.2.1.2. Products
- 16.2.1.3. SWOT Analysis
- 16.2.1.4. Recent Developments
- 16.2.1.5. Financials (Based on Availability)
- 16.2.2 GeneDireX Inc
- 16.2.2.1. Overview
- 16.2.2.2. Products
- 16.2.2.3. SWOT Analysis
- 16.2.2.4. Recent Developments
- 16.2.2.5. Financials (Based on Availability)
- 16.2.3 Promega Corporation
- 16.2.3.1. Overview
- 16.2.3.2. Products
- 16.2.3.3. SWOT Analysis
- 16.2.3.4. Recent Developments
- 16.2.3.5. Financials (Based on Availability)
- 16.2.4 Bio-Rad Laboratories Inc
- 16.2.4.1. Overview
- 16.2.4.2. Products
- 16.2.4.3. SWOT Analysis
- 16.2.4.4. Recent Developments
- 16.2.4.5. Financials (Based on Availability)
- 16.2.5 Merck KGaA
- 16.2.5.1. Overview
- 16.2.5.2. Products
- 16.2.5.3. SWOT Analysis
- 16.2.5.4. Recent Developments
- 16.2.5.5. Financials (Based on Availability)
- 16.2.6 Thermo Fisher Scientific Inc
- 16.2.6.1. Overview
- 16.2.6.2. Products
- 16.2.6.3. SWOT Analysis
- 16.2.6.4. Recent Developments
- 16.2.6.5. Financials (Based on Availability)
- 16.2.7 New England Biolabs
- 16.2.7.1. Overview
- 16.2.7.2. Products
- 16.2.7.3. SWOT Analysis
- 16.2.7.4. Recent Developments
- 16.2.7.5. Financials (Based on Availability)
- 16.2.8 VWR International
- 16.2.8.1. Overview
- 16.2.8.2. Products
- 16.2.8.3. SWOT Analysis
- 16.2.8.4. Recent Developments
- 16.2.8.5. Financials (Based on Availability)
- 16.2.9 Takara Bio Inc
- 16.2.9.1. Overview
- 16.2.9.2. Products
- 16.2.9.3. SWOT Analysis
- 16.2.9.4. Recent Developments
- 16.2.9.5. Financials (Based on Availability)
- 16.2.10 QIAGEN N V
- 16.2.10.1. Overview
- 16.2.10.2. Products
- 16.2.10.3. SWOT Analysis
- 16.2.10.4. Recent Developments
- 16.2.10.5. Financials (Based on Availability)
- 16.2.11 Agilent Technologies Inc
- 16.2.11.1. Overview
- 16.2.11.2. Products
- 16.2.11.3. SWOT Analysis
- 16.2.11.4. Recent Developments
- 16.2.11.5. Financials (Based on Availability)
- 16.2.12 HiMedia Laboratories
- 16.2.12.1. Overview
- 16.2.12.2. Products
- 16.2.12.3. SWOT Analysis
- 16.2.12.4. Recent Developments
- 16.2.12.5. Financials (Based on Availability)
- 16.2.1 F Hoffmann-La Roche AG
List of Figures
- Figure 1: Global Molecular Weight Marker Market Revenue Breakdown (Million, %) by Region 2024 & 2032
- Figure 2: Global Molecular Weight Marker Market Volume Breakdown (K Unit, %) by Region 2024 & 2032
- Figure 3: North America Molecular Weight Marker Market Revenue (Million), by Country 2024 & 2032
- Figure 4: North America Molecular Weight Marker Market Volume (K Unit), by Country 2024 & 2032
- Figure 5: North America Molecular Weight Marker Market Revenue Share (%), by Country 2024 & 2032
- Figure 6: North America Molecular Weight Marker Market Volume Share (%), by Country 2024 & 2032
- Figure 7: Europe Molecular Weight Marker Market Revenue (Million), by Country 2024 & 2032
- Figure 8: Europe Molecular Weight Marker Market Volume (K Unit), by Country 2024 & 2032
- Figure 9: Europe Molecular Weight Marker Market Revenue Share (%), by Country 2024 & 2032
- Figure 10: Europe Molecular Weight Marker Market Volume Share (%), by Country 2024 & 2032
- Figure 11: Asia Pacific Molecular Weight Marker Market Revenue (Million), by Country 2024 & 2032
- Figure 12: Asia Pacific Molecular Weight Marker Market Volume (K Unit), by Country 2024 & 2032
- Figure 13: Asia Pacific Molecular Weight Marker Market Revenue Share (%), by Country 2024 & 2032
- Figure 14: Asia Pacific Molecular Weight Marker Market Volume Share (%), by Country 2024 & 2032
- Figure 15: Middle East and Africa Molecular Weight Marker Market Revenue (Million), by Country 2024 & 2032
- Figure 16: Middle East and Africa Molecular Weight Marker Market Volume (K Unit), by Country 2024 & 2032
- Figure 17: Middle East and Africa Molecular Weight Marker Market Revenue Share (%), by Country 2024 & 2032
- Figure 18: Middle East and Africa Molecular Weight Marker Market Volume Share (%), by Country 2024 & 2032
- Figure 19: South America Molecular Weight Marker Market Revenue (Million), by Country 2024 & 2032
- Figure 20: South America Molecular Weight Marker Market Volume (K Unit), by Country 2024 & 2032
- Figure 21: South America Molecular Weight Marker Market Revenue Share (%), by Country 2024 & 2032
- Figure 22: South America Molecular Weight Marker Market Volume Share (%), by Country 2024 & 2032
- Figure 23: North America Molecular Weight Marker Market Revenue (Million), by Product 2024 & 2032
- Figure 24: North America Molecular Weight Marker Market Volume (K Unit), by Product 2024 & 2032
- Figure 25: North America Molecular Weight Marker Market Revenue Share (%), by Product 2024 & 2032
- Figure 26: North America Molecular Weight Marker Market Volume Share (%), by Product 2024 & 2032
- Figure 27: North America Molecular Weight Marker Market Revenue (Million), by Application 2024 & 2032
- Figure 28: North America Molecular Weight Marker Market Volume (K Unit), by Application 2024 & 2032
- Figure 29: North America Molecular Weight Marker Market Revenue Share (%), by Application 2024 & 2032
- Figure 30: North America Molecular Weight Marker Market Volume Share (%), by Application 2024 & 2032
- Figure 31: North America Molecular Weight Marker Market Revenue (Million), by Type 2024 & 2032
- Figure 32: North America Molecular Weight Marker Market Volume (K Unit), by Type 2024 & 2032
- Figure 33: North America Molecular Weight Marker Market Revenue Share (%), by Type 2024 & 2032
- Figure 34: North America Molecular Weight Marker Market Volume Share (%), by Type 2024 & 2032
- Figure 35: North America Molecular Weight Marker Market Revenue (Million), by Country 2024 & 2032
- Figure 36: North America Molecular Weight Marker Market Volume (K Unit), by Country 2024 & 2032
- Figure 37: North America Molecular Weight Marker Market Revenue Share (%), by Country 2024 & 2032
- Figure 38: North America Molecular Weight Marker Market Volume Share (%), by Country 2024 & 2032
- Figure 39: Europe Molecular Weight Marker Market Revenue (Million), by Product 2024 & 2032
- Figure 40: Europe Molecular Weight Marker Market Volume (K Unit), by Product 2024 & 2032
- Figure 41: Europe Molecular Weight Marker Market Revenue Share (%), by Product 2024 & 2032
- Figure 42: Europe Molecular Weight Marker Market Volume Share (%), by Product 2024 & 2032
- Figure 43: Europe Molecular Weight Marker Market Revenue (Million), by Application 2024 & 2032
- Figure 44: Europe Molecular Weight Marker Market Volume (K Unit), by Application 2024 & 2032
- Figure 45: Europe Molecular Weight Marker Market Revenue Share (%), by Application 2024 & 2032
- Figure 46: Europe Molecular Weight Marker Market Volume Share (%), by Application 2024 & 2032
- Figure 47: Europe Molecular Weight Marker Market Revenue (Million), by Type 2024 & 2032
- Figure 48: Europe Molecular Weight Marker Market Volume (K Unit), by Type 2024 & 2032
- Figure 49: Europe Molecular Weight Marker Market Revenue Share (%), by Type 2024 & 2032
- Figure 50: Europe Molecular Weight Marker Market Volume Share (%), by Type 2024 & 2032
- Figure 51: Europe Molecular Weight Marker Market Revenue (Million), by Country 2024 & 2032
- Figure 52: Europe Molecular Weight Marker Market Volume (K Unit), by Country 2024 & 2032
- Figure 53: Europe Molecular Weight Marker Market Revenue Share (%), by Country 2024 & 2032
- Figure 54: Europe Molecular Weight Marker Market Volume Share (%), by Country 2024 & 2032
- Figure 55: Asia Pacific Molecular Weight Marker Market Revenue (Million), by Product 2024 & 2032
- Figure 56: Asia Pacific Molecular Weight Marker Market Volume (K Unit), by Product 2024 & 2032
- Figure 57: Asia Pacific Molecular Weight Marker Market Revenue Share (%), by Product 2024 & 2032
- Figure 58: Asia Pacific Molecular Weight Marker Market Volume Share (%), by Product 2024 & 2032
- Figure 59: Asia Pacific Molecular Weight Marker Market Revenue (Million), by Application 2024 & 2032
- Figure 60: Asia Pacific Molecular Weight Marker Market Volume (K Unit), by Application 2024 & 2032
- Figure 61: Asia Pacific Molecular Weight Marker Market Revenue Share (%), by Application 2024 & 2032
- Figure 62: Asia Pacific Molecular Weight Marker Market Volume Share (%), by Application 2024 & 2032
- Figure 63: Asia Pacific Molecular Weight Marker Market Revenue (Million), by Type 2024 & 2032
- Figure 64: Asia Pacific Molecular Weight Marker Market Volume (K Unit), by Type 2024 & 2032
- Figure 65: Asia Pacific Molecular Weight Marker Market Revenue Share (%), by Type 2024 & 2032
- Figure 66: Asia Pacific Molecular Weight Marker Market Volume Share (%), by Type 2024 & 2032
- Figure 67: Asia Pacific Molecular Weight Marker Market Revenue (Million), by Country 2024 & 2032
- Figure 68: Asia Pacific Molecular Weight Marker Market Volume (K Unit), by Country 2024 & 2032
- Figure 69: Asia Pacific Molecular Weight Marker Market Revenue Share (%), by Country 2024 & 2032
- Figure 70: Asia Pacific Molecular Weight Marker Market Volume Share (%), by Country 2024 & 2032
- Figure 71: Middle East and Africa Molecular Weight Marker Market Revenue (Million), by Product 2024 & 2032
- Figure 72: Middle East and Africa Molecular Weight Marker Market Volume (K Unit), by Product 2024 & 2032
- Figure 73: Middle East and Africa Molecular Weight Marker Market Revenue Share (%), by Product 2024 & 2032
- Figure 74: Middle East and Africa Molecular Weight Marker Market Volume Share (%), by Product 2024 & 2032
- Figure 75: Middle East and Africa Molecular Weight Marker Market Revenue (Million), by Application 2024 & 2032
- Figure 76: Middle East and Africa Molecular Weight Marker Market Volume (K Unit), by Application 2024 & 2032
- Figure 77: Middle East and Africa Molecular Weight Marker Market Revenue Share (%), by Application 2024 & 2032
- Figure 78: Middle East and Africa Molecular Weight Marker Market Volume Share (%), by Application 2024 & 2032
- Figure 79: Middle East and Africa Molecular Weight Marker Market Revenue (Million), by Type 2024 & 2032
- Figure 80: Middle East and Africa Molecular Weight Marker Market Volume (K Unit), by Type 2024 & 2032
- Figure 81: Middle East and Africa Molecular Weight Marker Market Revenue Share (%), by Type 2024 & 2032
- Figure 82: Middle East and Africa Molecular Weight Marker Market Volume Share (%), by Type 2024 & 2032
- Figure 83: Middle East and Africa Molecular Weight Marker Market Revenue (Million), by Country 2024 & 2032
- Figure 84: Middle East and Africa Molecular Weight Marker Market Volume (K Unit), by Country 2024 & 2032
- Figure 85: Middle East and Africa Molecular Weight Marker Market Revenue Share (%), by Country 2024 & 2032
- Figure 86: Middle East and Africa Molecular Weight Marker Market Volume Share (%), by Country 2024 & 2032
- Figure 87: South America Molecular Weight Marker Market Revenue (Million), by Product 2024 & 2032
- Figure 88: South America Molecular Weight Marker Market Volume (K Unit), by Product 2024 & 2032
- Figure 89: South America Molecular Weight Marker Market Revenue Share (%), by Product 2024 & 2032
- Figure 90: South America Molecular Weight Marker Market Volume Share (%), by Product 2024 & 2032
- Figure 91: South America Molecular Weight Marker Market Revenue (Million), by Application 2024 & 2032
- Figure 92: South America Molecular Weight Marker Market Volume (K Unit), by Application 2024 & 2032
- Figure 93: South America Molecular Weight Marker Market Revenue Share (%), by Application 2024 & 2032
- Figure 94: South America Molecular Weight Marker Market Volume Share (%), by Application 2024 & 2032
- Figure 95: South America Molecular Weight Marker Market Revenue (Million), by Type 2024 & 2032
- Figure 96: South America Molecular Weight Marker Market Volume (K Unit), by Type 2024 & 2032
- Figure 97: South America Molecular Weight Marker Market Revenue Share (%), by Type 2024 & 2032
- Figure 98: South America Molecular Weight Marker Market Volume Share (%), by Type 2024 & 2032
- Figure 99: South America Molecular Weight Marker Market Revenue (Million), by Country 2024 & 2032
- Figure 100: South America Molecular Weight Marker Market Volume (K Unit), by Country 2024 & 2032
- Figure 101: South America Molecular Weight Marker Market Revenue Share (%), by Country 2024 & 2032
- Figure 102: South America Molecular Weight Marker Market Volume Share (%), by Country 2024 & 2032
List of Tables
- Table 1: Global Molecular Weight Marker Market Revenue Million Forecast, by Region 2019 & 2032
- Table 2: Global Molecular Weight Marker Market Volume K Unit Forecast, by Region 2019 & 2032
- Table 3: Global Molecular Weight Marker Market Revenue Million Forecast, by Product 2019 & 2032
- Table 4: Global Molecular Weight Marker Market Volume K Unit Forecast, by Product 2019 & 2032
- Table 5: Global Molecular Weight Marker Market Revenue Million Forecast, by Application 2019 & 2032
- Table 6: Global Molecular Weight Marker Market Volume K Unit Forecast, by Application 2019 & 2032
- Table 7: Global Molecular Weight Marker Market Revenue Million Forecast, by Type 2019 & 2032
- Table 8: Global Molecular Weight Marker Market Volume K Unit Forecast, by Type 2019 & 2032
- Table 9: Global Molecular Weight Marker Market Revenue Million Forecast, by Region 2019 & 2032
- Table 10: Global Molecular Weight Marker Market Volume K Unit Forecast, by Region 2019 & 2032
- Table 11: Global Molecular Weight Marker Market Revenue Million Forecast, by Country 2019 & 2032
- Table 12: Global Molecular Weight Marker Market Volume K Unit Forecast, by Country 2019 & 2032
- Table 13: United States Molecular Weight Marker Market Revenue (Million) Forecast, by Application 2019 & 2032
- Table 14: United States Molecular Weight Marker Market Volume (K Unit) Forecast, by Application 2019 & 2032
- Table 15: Canada Molecular Weight Marker Market Revenue (Million) Forecast, by Application 2019 & 2032
- Table 16: Canada Molecular Weight Marker Market Volume (K Unit) Forecast, by Application 2019 & 2032
- Table 17: Mexico Molecular Weight Marker Market Revenue (Million) Forecast, by Application 2019 & 2032
- Table 18: Mexico Molecular Weight Marker Market Volume (K Unit) Forecast, by Application 2019 & 2032
- Table 19: Global Molecular Weight Marker Market Revenue Million Forecast, by Country 2019 & 2032
- Table 20: Global Molecular Weight Marker Market Volume K Unit Forecast, by Country 2019 & 2032
- Table 21: Germany Molecular Weight Marker Market Revenue (Million) Forecast, by Application 2019 & 2032
- Table 22: Germany Molecular Weight Marker Market Volume (K Unit) Forecast, by Application 2019 & 2032
- Table 23: United Kingdom Molecular Weight Marker Market Revenue (Million) Forecast, by Application 2019 & 2032
- Table 24: United Kingdom Molecular Weight Marker Market Volume (K Unit) Forecast, by Application 2019 & 2032
- Table 25: France Molecular Weight Marker Market Revenue (Million) Forecast, by Application 2019 & 2032
- Table 26: France Molecular Weight Marker Market Volume (K Unit) Forecast, by Application 2019 & 2032
- Table 27: Italy Molecular Weight Marker Market Revenue (Million) Forecast, by Application 2019 & 2032
- Table 28: Italy Molecular Weight Marker Market Volume (K Unit) Forecast, by Application 2019 & 2032
- Table 29: Spain Molecular Weight Marker Market Revenue (Million) Forecast, by Application 2019 & 2032
- Table 30: Spain Molecular Weight Marker Market Volume (K Unit) Forecast, by Application 2019 & 2032
- Table 31: Rest of Europe Molecular Weight Marker Market Revenue (Million) Forecast, by Application 2019 & 2032
- Table 32: Rest of Europe Molecular Weight Marker Market Volume (K Unit) Forecast, by Application 2019 & 2032
- Table 33: Global Molecular Weight Marker Market Revenue Million Forecast, by Country 2019 & 2032
- Table 34: Global Molecular Weight Marker Market Volume K Unit Forecast, by Country 2019 & 2032
- Table 35: China Molecular Weight Marker Market Revenue (Million) Forecast, by Application 2019 & 2032
- Table 36: China Molecular Weight Marker Market Volume (K Unit) Forecast, by Application 2019 & 2032
- Table 37: Japan Molecular Weight Marker Market Revenue (Million) Forecast, by Application 2019 & 2032
- Table 38: Japan Molecular Weight Marker Market Volume (K Unit) Forecast, by Application 2019 & 2032
- Table 39: India Molecular Weight Marker Market Revenue (Million) Forecast, by Application 2019 & 2032
- Table 40: India Molecular Weight Marker Market Volume (K Unit) Forecast, by Application 2019 & 2032
- Table 41: Australia Molecular Weight Marker Market Revenue (Million) Forecast, by Application 2019 & 2032
- Table 42: Australia Molecular Weight Marker Market Volume (K Unit) Forecast, by Application 2019 & 2032
- Table 43: South korea Molecular Weight Marker Market Revenue (Million) Forecast, by Application 2019 & 2032
- Table 44: South korea Molecular Weight Marker Market Volume (K Unit) Forecast, by Application 2019 & 2032
- Table 45: Rest of Asia Pacific Molecular Weight Marker Market Revenue (Million) Forecast, by Application 2019 & 2032
- Table 46: Rest of Asia Pacific Molecular Weight Marker Market Volume (K Unit) Forecast, by Application 2019 & 2032
- Table 47: Global Molecular Weight Marker Market Revenue Million Forecast, by Country 2019 & 2032
- Table 48: Global Molecular Weight Marker Market Volume K Unit Forecast, by Country 2019 & 2032
- Table 49: GCC Molecular Weight Marker Market Revenue (Million) Forecast, by Application 2019 & 2032
- Table 50: GCC Molecular Weight Marker Market Volume (K Unit) Forecast, by Application 2019 & 2032
- Table 51: South Africa Molecular Weight Marker Market Revenue (Million) Forecast, by Application 2019 & 2032
- Table 52: South Africa Molecular Weight Marker Market Volume (K Unit) Forecast, by Application 2019 & 2032
- Table 53: Rest of Middle East and Africa Molecular Weight Marker Market Revenue (Million) Forecast, by Application 2019 & 2032
- Table 54: Rest of Middle East and Africa Molecular Weight Marker Market Volume (K Unit) Forecast, by Application 2019 & 2032
- Table 55: Global Molecular Weight Marker Market Revenue Million Forecast, by Country 2019 & 2032
- Table 56: Global Molecular Weight Marker Market Volume K Unit Forecast, by Country 2019 & 2032
- Table 57: Brazil Molecular Weight Marker Market Revenue (Million) Forecast, by Application 2019 & 2032
- Table 58: Brazil Molecular Weight Marker Market Volume (K Unit) Forecast, by Application 2019 & 2032
- Table 59: Argentina Molecular Weight Marker Market Revenue (Million) Forecast, by Application 2019 & 2032
- Table 60: Argentina Molecular Weight Marker Market Volume (K Unit) Forecast, by Application 2019 & 2032
- Table 61: Rest of South America Molecular Weight Marker Market Revenue (Million) Forecast, by Application 2019 & 2032
- Table 62: Rest of South America Molecular Weight Marker Market Volume (K Unit) Forecast, by Application 2019 & 2032
- Table 63: Global Molecular Weight Marker Market Revenue Million Forecast, by Product 2019 & 2032
- Table 64: Global Molecular Weight Marker Market Volume K Unit Forecast, by Product 2019 & 2032
- Table 65: Global Molecular Weight Marker Market Revenue Million Forecast, by Application 2019 & 2032
- Table 66: Global Molecular Weight Marker Market Volume K Unit Forecast, by Application 2019 & 2032
- Table 67: Global Molecular Weight Marker Market Revenue Million Forecast, by Type 2019 & 2032
- Table 68: Global Molecular Weight Marker Market Volume K Unit Forecast, by Type 2019 & 2032
- Table 69: Global Molecular Weight Marker Market Revenue Million Forecast, by Country 2019 & 2032
- Table 70: Global Molecular Weight Marker Market Volume K Unit Forecast, by Country 2019 & 2032
- Table 71: United States Molecular Weight Marker Market Revenue (Million) Forecast, by Application 2019 & 2032
- Table 72: United States Molecular Weight Marker Market Volume (K Unit) Forecast, by Application 2019 & 2032
- Table 73: Canada Molecular Weight Marker Market Revenue (Million) Forecast, by Application 2019 & 2032
- Table 74: Canada Molecular Weight Marker Market Volume (K Unit) Forecast, by Application 2019 & 2032
- Table 75: Mexico Molecular Weight Marker Market Revenue (Million) Forecast, by Application 2019 & 2032
- Table 76: Mexico Molecular Weight Marker Market Volume (K Unit) Forecast, by Application 2019 & 2032
- Table 77: Global Molecular Weight Marker Market Revenue Million Forecast, by Product 2019 & 2032
- Table 78: Global Molecular Weight Marker Market Volume K Unit Forecast, by Product 2019 & 2032
- Table 79: Global Molecular Weight Marker Market Revenue Million Forecast, by Application 2019 & 2032
- Table 80: Global Molecular Weight Marker Market Volume K Unit Forecast, by Application 2019 & 2032
- Table 81: Global Molecular Weight Marker Market Revenue Million Forecast, by Type 2019 & 2032
- Table 82: Global Molecular Weight Marker Market Volume K Unit Forecast, by Type 2019 & 2032
- Table 83: Global Molecular Weight Marker Market Revenue Million Forecast, by Country 2019 & 2032
- Table 84: Global Molecular Weight Marker Market Volume K Unit Forecast, by Country 2019 & 2032
- Table 85: Germany Molecular Weight Marker Market Revenue (Million) Forecast, by Application 2019 & 2032
- Table 86: Germany Molecular Weight Marker Market Volume (K Unit) Forecast, by Application 2019 & 2032
- Table 87: United Kingdom Molecular Weight Marker Market Revenue (Million) Forecast, by Application 2019 & 2032
- Table 88: United Kingdom Molecular Weight Marker Market Volume (K Unit) Forecast, by Application 2019 & 2032
- Table 89: France Molecular Weight Marker Market Revenue (Million) Forecast, by Application 2019 & 2032
- Table 90: France Molecular Weight Marker Market Volume (K Unit) Forecast, by Application 2019 & 2032
- Table 91: Italy Molecular Weight Marker Market Revenue (Million) Forecast, by Application 2019 & 2032
- Table 92: Italy Molecular Weight Marker Market Volume (K Unit) Forecast, by Application 2019 & 2032
- Table 93: Spain Molecular Weight Marker Market Revenue (Million) Forecast, by Application 2019 & 2032
- Table 94: Spain Molecular Weight Marker Market Volume (K Unit) Forecast, by Application 2019 & 2032
- Table 95: Rest of Europe Molecular Weight Marker Market Revenue (Million) Forecast, by Application 2019 & 2032
- Table 96: Rest of Europe Molecular Weight Marker Market Volume (K Unit) Forecast, by Application 2019 & 2032
- Table 97: Global Molecular Weight Marker Market Revenue Million Forecast, by Product 2019 & 2032
- Table 98: Global Molecular Weight Marker Market Volume K Unit Forecast, by Product 2019 & 2032
- Table 99: Global Molecular Weight Marker Market Revenue Million Forecast, by Application 2019 & 2032
- Table 100: Global Molecular Weight Marker Market Volume K Unit Forecast, by Application 2019 & 2032
- Table 101: Global Molecular Weight Marker Market Revenue Million Forecast, by Type 2019 & 2032
- Table 102: Global Molecular Weight Marker Market Volume K Unit Forecast, by Type 2019 & 2032
- Table 103: Global Molecular Weight Marker Market Revenue Million Forecast, by Country 2019 & 2032
- Table 104: Global Molecular Weight Marker Market Volume K Unit Forecast, by Country 2019 & 2032
- Table 105: China Molecular Weight Marker Market Revenue (Million) Forecast, by Application 2019 & 2032
- Table 106: China Molecular Weight Marker Market Volume (K Unit) Forecast, by Application 2019 & 2032
- Table 107: Japan Molecular Weight Marker Market Revenue (Million) Forecast, by Application 2019 & 2032
- Table 108: Japan Molecular Weight Marker Market Volume (K Unit) Forecast, by Application 2019 & 2032
- Table 109: India Molecular Weight Marker Market Revenue (Million) Forecast, by Application 2019 & 2032
- Table 110: India Molecular Weight Marker Market Volume (K Unit) Forecast, by Application 2019 & 2032
- Table 111: Australia Molecular Weight Marker Market Revenue (Million) Forecast, by Application 2019 & 2032
- Table 112: Australia Molecular Weight Marker Market Volume (K Unit) Forecast, by Application 2019 & 2032
- Table 113: South korea Molecular Weight Marker Market Revenue (Million) Forecast, by Application 2019 & 2032
- Table 114: South korea Molecular Weight Marker Market Volume (K Unit) Forecast, by Application 2019 & 2032
- Table 115: Rest of Asia Pacific Molecular Weight Marker Market Revenue (Million) Forecast, by Application 2019 & 2032
- Table 116: Rest of Asia Pacific Molecular Weight Marker Market Volume (K Unit) Forecast, by Application 2019 & 2032
- Table 117: Global Molecular Weight Marker Market Revenue Million Forecast, by Product 2019 & 2032
- Table 118: Global Molecular Weight Marker Market Volume K Unit Forecast, by Product 2019 & 2032
- Table 119: Global Molecular Weight Marker Market Revenue Million Forecast, by Application 2019 & 2032
- Table 120: Global Molecular Weight Marker Market Volume K Unit Forecast, by Application 2019 & 2032
- Table 121: Global Molecular Weight Marker Market Revenue Million Forecast, by Type 2019 & 2032
- Table 122: Global Molecular Weight Marker Market Volume K Unit Forecast, by Type 2019 & 2032
- Table 123: Global Molecular Weight Marker Market Revenue Million Forecast, by Country 2019 & 2032
- Table 124: Global Molecular Weight Marker Market Volume K Unit Forecast, by Country 2019 & 2032
- Table 125: GCC Molecular Weight Marker Market Revenue (Million) Forecast, by Application 2019 & 2032
- Table 126: GCC Molecular Weight Marker Market Volume (K Unit) Forecast, by Application 2019 & 2032
- Table 127: South Africa Molecular Weight Marker Market Revenue (Million) Forecast, by Application 2019 & 2032
- Table 128: South Africa Molecular Weight Marker Market Volume (K Unit) Forecast, by Application 2019 & 2032
- Table 129: Rest of Middle East and Africa Molecular Weight Marker Market Revenue (Million) Forecast, by Application 2019 & 2032
- Table 130: Rest of Middle East and Africa Molecular Weight Marker Market Volume (K Unit) Forecast, by Application 2019 & 2032
- Table 131: Global Molecular Weight Marker Market Revenue Million Forecast, by Product 2019 & 2032
- Table 132: Global Molecular Weight Marker Market Volume K Unit Forecast, by Product 2019 & 2032
- Table 133: Global Molecular Weight Marker Market Revenue Million Forecast, by Application 2019 & 2032
- Table 134: Global Molecular Weight Marker Market Volume K Unit Forecast, by Application 2019 & 2032
- Table 135: Global Molecular Weight Marker Market Revenue Million Forecast, by Type 2019 & 2032
- Table 136: Global Molecular Weight Marker Market Volume K Unit Forecast, by Type 2019 & 2032
- Table 137: Global Molecular Weight Marker Market Revenue Million Forecast, by Country 2019 & 2032
- Table 138: Global Molecular Weight Marker Market Volume K Unit Forecast, by Country 2019 & 2032
- Table 139: Brazil Molecular Weight Marker Market Revenue (Million) Forecast, by Application 2019 & 2032
- Table 140: Brazil Molecular Weight Marker Market Volume (K Unit) Forecast, by Application 2019 & 2032
- Table 141: Argentina Molecular Weight Marker Market Revenue (Million) Forecast, by Application 2019 & 2032
- Table 142: Argentina Molecular Weight Marker Market Volume (K Unit) Forecast, by Application 2019 & 2032
- Table 143: Rest of South America Molecular Weight Marker Market Revenue (Million) Forecast, by Application 2019 & 2032
- Table 144: Rest of South America Molecular Weight Marker Market Volume (K Unit) Forecast, by Application 2019 & 2032
Frequently Asked Questions
1. What is the projected Compound Annual Growth Rate (CAGR) of the Molecular Weight Marker Market?
The projected CAGR is approximately 13.17%.
2. Which companies are prominent players in the Molecular Weight Marker Market?
Key companies in the market include F Hoffmann-La Roche AG, GeneDireX Inc , Promega Corporation, Bio-Rad Laboratories Inc, Merck KGaA, Thermo Fisher Scientific Inc, New England Biolabs, VWR International, Takara Bio Inc, QIAGEN N V, Agilent Technologies Inc, HiMedia Laboratories.
3. What are the main segments of the Molecular Weight Marker Market?
The market segments include Product, Application, Type.
4. Can you provide details about the market size?
The market size is estimated to be USD 0.76 Million as of 2022.
5. What are some drivers contributing to market growth?
Increasing Investment on R&D; Growing Focus on Proteomics and Genomics Technologies Research.
6. What are the notable trends driving market growth?
RNA Marker Segment is Expected to Show Significant Growth Over the Forecast Period.
7. Are there any restraints impacting market growth?
Lack of Skilled Healthcare Professionals; Strict Government Regulations.
8. Can you provide examples of recent developments in the market?
November 2022: Creative Enzymes announced the release of their new line of highly efficient and cost-effective DNA markers and ladders, which quickly gained popularity in the research market.
9. What pricing options are available for accessing the report?
Pricing options include single-user, multi-user, and enterprise licenses priced at USD 4750, USD 5250, and USD 8750 respectively.
10. Is the market size provided in terms of value or volume?
The market size is provided in terms of value, measured in Million and volume, measured in K Unit.
11. Are there any specific market keywords associated with the report?
Yes, the market keyword associated with the report is "Molecular Weight Marker Market," which aids in identifying and referencing the specific market segment covered.
12. How do I determine which pricing option suits my needs best?
The pricing options vary based on user requirements and access needs. Individual users may opt for single-user licenses, while businesses requiring broader access may choose multi-user or enterprise licenses for cost-effective access to the report.
13. Are there any additional resources or data provided in the Molecular Weight Marker Market report?
While the report offers comprehensive insights, it's advisable to review the specific contents or supplementary materials provided to ascertain if additional resources or data are available.
14. How can I stay updated on further developments or reports in the Molecular Weight Marker Market?
To stay informed about further developments, trends, and reports in the Molecular Weight Marker Market, consider subscribing to industry newsletters, following relevant companies and organizations, or regularly checking reputable industry news sources and publications.
Methodology
Step 1 - Identification of Relevant Samples Size from Population Database


Step 2 - Approaches for Defining Global Market Size (Value, Volume* & Price*)

Note*: In applicable scenarios
Step 3 - Data Sources
Primary Research
- Web Analytics
- Survey Reports
- Research Institute
- Latest Research Reports
- Opinion Leaders
Secondary Research
- Annual Reports
- White Paper
- Latest Press Release
- Industry Association
- Paid Database
- Investor Presentations

Step 4 - Data Triangulation
Involves using different sources of information in order to increase the validity of a study
These sources are likely to be stakeholders in a program - participants, other researchers, program staff, other community members, and so on.
Then we put all data in single framework & apply various statistical tools to find out the dynamic on the market.
During the analysis stage, feedback from the stakeholder groups would be compared to determine areas of agreement as well as areas of divergence


