
Key Insights
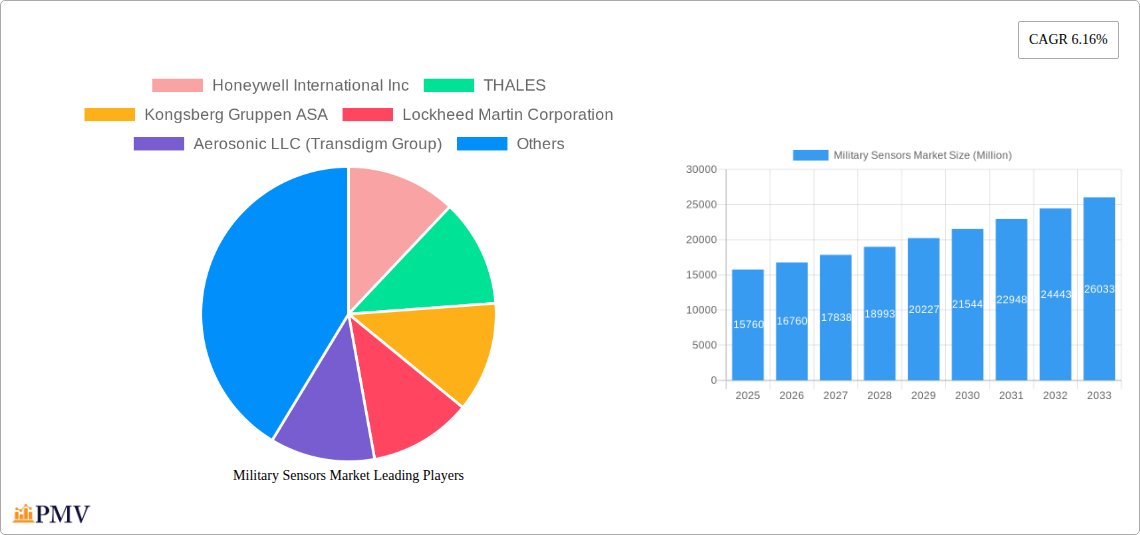
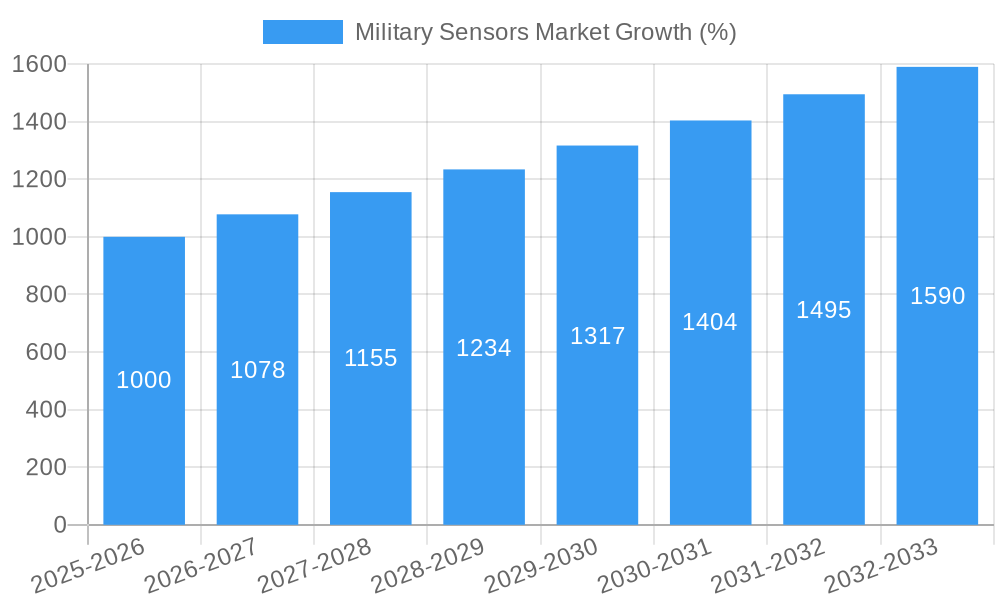
The Military Sensors market, valued at $15.76 billion in 2025, is projected to experience robust growth, driven by escalating geopolitical tensions, modernization of defense systems, and increasing demand for advanced surveillance and reconnaissance capabilities. The Compound Annual Growth Rate (CAGR) of 6.16% from 2025 to 2033 signifies a substantial market expansion, reaching an estimated $26.5 billion by 2033. Key drivers include the integration of Artificial Intelligence (AI) and Machine Learning (ML) for enhanced situational awareness, the rising adoption of Unmanned Aerial Vehicles (UAVs) necessitating sophisticated sensor technologies, and the continuous development of more precise and reliable sensor systems for both offensive and defensive applications. Market segmentation reveals strong growth across various application areas, notably Intelligence, Surveillance, and Reconnaissance (ISR), Electronic Warfare, and Target Recognition. Airborne platforms currently dominate the market share, but terrestrial and naval segments are expected to witness significant growth fueled by increasing investments in land-based defense systems and naval modernization programs. Leading players like Honeywell, Thales, and Lockheed Martin are actively investing in R&D and strategic partnerships to maintain their market leadership.
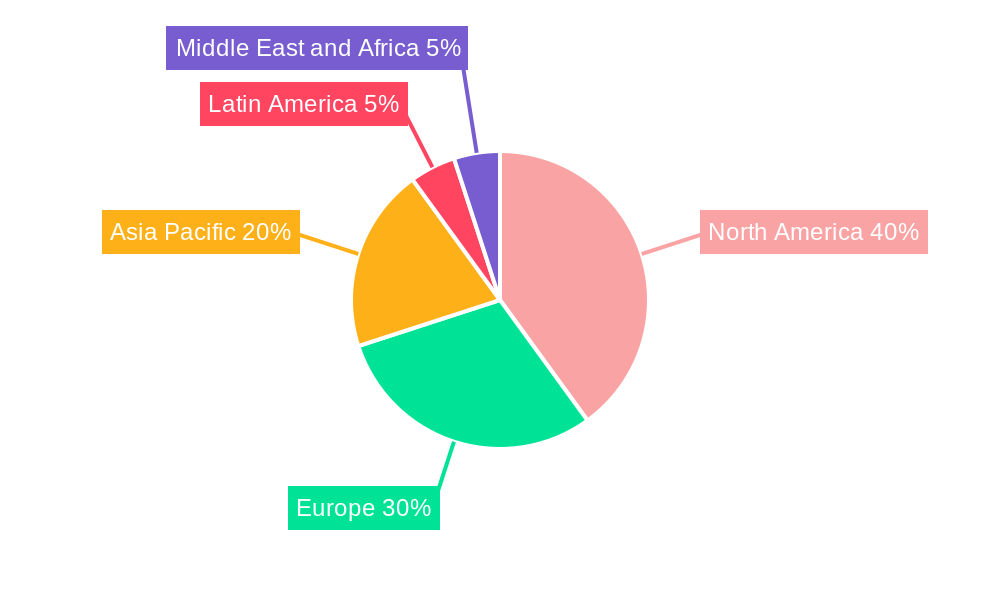
Significant restraints include the high cost of advanced sensor technologies and the complex integration processes involved. However, government funding for defense modernization, coupled with technological advancements leading to miniaturization and cost reduction, is expected to mitigate these challenges. Regional analysis reveals that North America holds a considerable market share due to substantial defense budgets and technological advancements. However, Asia-Pacific is expected to exhibit the fastest growth rate, driven by increasing defense expenditures in countries like China and India. The market’s future growth is contingent upon continued technological innovation, government policies, and the evolving geopolitical landscape. The development of more energy-efficient, smaller, and lighter sensors will play a key role in shaping market dynamics.
Military Sensors Market: A Comprehensive Report (2019-2033)
This in-depth report provides a comprehensive analysis of the Military Sensors Market, offering valuable insights into market dynamics, competitive landscape, and future growth projections. Covering the period from 2019 to 2033, with 2025 as the base and estimated year, this report is an essential resource for industry professionals, investors, and strategic decision-makers. The study meticulously examines various market segments, including application and platform, offering granular data for informed strategic planning.
Military Sensors Market Market Structure & Competitive Dynamics
The Military Sensors Market exhibits a moderately concentrated structure, with a few key players holding significant market share. The market is characterized by intense competition driven by continuous technological advancements and the need for sophisticated sensor systems in modern warfare. Innovation ecosystems are robust, with significant R&D investments from both established players and emerging startups. Stringent regulatory frameworks govern the development and deployment of military technologies, impacting market entry and operations. Product substitutes, while limited, exist in niche applications. End-user trends toward miniaturization, enhanced precision, and multi-sensor integration are reshaping market demands. Mergers and acquisitions (M&A) activity is notable, with deal values exceeding xx Million in the past five years, leading to increased market consolidation.
- Market Concentration: Top 5 players account for approximately xx% of the market share.
- M&A Activity: Significant M&A activity observed in the past five years, with an average deal value of xx Million. Notable deals include [Insert details of significant M&A activities if available].
- Regulatory Framework: Stringent export controls and security clearances significantly influence market dynamics.
- Innovation Ecosystem: Strong collaboration between defense contractors, research institutions, and government agencies drives innovation.
Military Sensors Market Industry Trends & Insights
The Military Sensors Market is experiencing robust growth, driven by increasing defense budgets globally, modernization of military infrastructure, and the growing adoption of advanced technologies. The Compound Annual Growth Rate (CAGR) during the forecast period (2025-2033) is projected to be xx%, significantly influenced by technological disruptions such as the integration of AI and machine learning in sensor systems and the rising demand for autonomous and unmanned platforms. Consumer preferences (in this context, military end-users) are shifting towards more versatile, networked sensors offering superior situational awareness and improved data processing capabilities. The competitive landscape remains highly dynamic, with continuous product innovation and strategic partnerships shaping market trajectories. Market penetration of advanced sensor technologies, such as hyperspectral imaging and LiDAR, is steadily increasing.
Dominant Markets & Segments in Military Sensors Market
The North American region currently holds a dominant position in the Military Sensors Market, driven by substantial defense spending and a robust domestic industry. Within the application segments, Intelligence, Surveillance, and Reconnaissance (ISR) holds the largest market share, followed by Communication and Navigation. The Airborne platform segment dominates due to its crucial role in various military operations.
Key Drivers for North American Dominance:
- High defense expenditure.
- Advanced technological capabilities.
- Strong domestic manufacturing base.
Dominant Application Segment: ISR
- High demand for enhanced situational awareness.
- Growing adoption of advanced sensor technologies.
Dominant Platform Segment: Airborne
- Increased deployment of UAVs and manned aircraft.
- Significant investments in airborne sensor systems.
Military Sensors Market Product Innovations
Recent years have witnessed significant advancements in military sensor technologies, including the integration of AI for improved target recognition and autonomous operation, miniaturization of sensors for enhanced mobility and deployment, and the development of multi-spectral and hyperspectral sensors for superior target detection and identification. These innovations are enhancing the capabilities of military platforms and improving overall operational efficiency, leading to greater market penetration and competitive advantage.
Report Segmentation & Scope
This report segments the Military Sensors Market by application (Intelligence, Surveillance, and Reconnaissance (ISR), Communication and Navigation, Target Recognition, Electronic Warfare, Command and Control) and platform (Airborne, Terrestrial, Naval). Each segment's market size, growth projections, and competitive dynamics are analyzed in detail. The forecast period extends from 2025 to 2033, providing a comprehensive outlook on market evolution. The report also incorporates a historical analysis covering the period from 2019 to 2024. Each segment is projected to witness substantial growth driven by specific factors within its domain.
Key Drivers of Military Sensors Market Growth
The Military Sensors Market is propelled by several key growth drivers: increasing defense budgets globally, technological advancements, modernization of military forces, and the growing demand for enhanced situational awareness in modern warfare. The rising adoption of unmanned aerial vehicles (UAVs) and the need for improved target acquisition and tracking capabilities further fuel market expansion. Stringent security concerns and geopolitical instability contribute significantly to the increased demand for advanced sensor systems.
Challenges in the Military Sensors Market Sector
The Military Sensors Market faces several challenges: stringent regulatory frameworks, supply chain disruptions, the high cost of advanced sensor technologies, and intense competition from both established and emerging players. These factors can impact production timelines, increase development costs, and limit market access for some companies. The need to balance cost-effectiveness with technological advancements presents a continuous challenge for manufacturers.
Leading Players in the Military Sensors Market Market
- Honeywell International Inc
- THALES
- Kongsberg Gruppen ASA
- Lockheed Martin Corporation
- Aerosonic LLC (Transdigm Group)
- Ultra Electronics Holdings Limited
- Imperx Inc
- RTX Corporation
- TE Connectivity Ltd
- BAE Systems plc
- General Electric Company
- Viooa Imaging Technology Inc
- Vectornav Technologies LLC
Key Developments in Military Sensors Market Sector
- January 2023: Honeywell announces a new generation of miniature infrared sensors.
- March 2022: Thales launches advanced radar system for airborne applications.
- [Insert further developments with year/month and brief description of impact]: Add further developments as available.
Strategic Military Sensors Market Market Outlook
The Military Sensors Market presents significant growth opportunities driven by sustained investment in defense modernization, technological innovations, and the increasing demand for enhanced military capabilities. Strategic partnerships, focused R&D investments, and the expansion into emerging markets will be crucial for companies seeking to capitalize on future market potential. The integration of AI and machine learning is expected to drive further innovation and shape the future of military sensor technologies.
Military Sensors Market Segmentation
-
1. Application
- 1.1. Intellig
- 1.2. Communication and Navigation
- 1.3. Target Recognition
- 1.4. Electronic Warfare
- 1.5. Command and Control
-
2. Platform
- 2.1. Airborne
- 2.2. Terrestrial
- 2.3. Naval
Military Sensors Market Segmentation By Geography
-
1. North America
- 1.1. United States
- 1.2. Canada
-
2. Europe
- 2.1. United Kingdom
- 2.2. France
- 2.3. Italy
- 2.4. Russia
- 2.5. Germany
- 2.6. Rest of Europe
-
3. Asia Pacific
- 3.1. China
- 3.2. Japan
- 3.3. India
- 3.4. South Korea
- 3.5. Rest of Asia Pacific
-
4. Latin America
- 4.1. Brazil
- 4.2. Mexico
- 4.3. Rest of Latin America
-
5. Middle East and Africa
- 5.1. Saudi Arabia
- 5.2. United Arab Emirates
- 5.3. South Africa
- 5.4. Rest of Middle East and Africa
Military Sensors Market REPORT HIGHLIGHTS
| Aspects | Details |
|---|---|
| Study Period | 2019-2033 |
| Base Year | 2024 |
| Estimated Year | 2025 |
| Forecast Period | 2025-2033 |
| Historical Period | 2019-2024 |
| Growth Rate | CAGR of 6.16% from 2019-2033 |
| Segmentation |
|
Table of Contents
- 1. Introduction
- 1.1. Research Scope
- 1.2. Market Segmentation
- 1.3. Research Methodology
- 1.4. Definitions and Assumptions
- 2. Executive Summary
- 2.1. Introduction
- 3. Market Dynamics
- 3.1. Introduction
- 3.2. Market Drivers
- 3.3. Market Restrains
- 3.4. Market Trends
- 3.4.1. Airborne Segment Expected to Register the Highest CAGR During the Forecast Period
- 4. Market Factor Analysis
- 4.1. Porters Five Forces
- 4.2. Supply/Value Chain
- 4.3. PESTEL analysis
- 4.4. Market Entropy
- 4.5. Patent/Trademark Analysis
- 5. Global Military Sensors Market Analysis, Insights and Forecast, 2019-2031
- 5.1. Market Analysis, Insights and Forecast - by Application
- 5.1.1. Intellig
- 5.1.2. Communication and Navigation
- 5.1.3. Target Recognition
- 5.1.4. Electronic Warfare
- 5.1.5. Command and Control
- 5.2. Market Analysis, Insights and Forecast - by Platform
- 5.2.1. Airborne
- 5.2.2. Terrestrial
- 5.2.3. Naval
- 5.3. Market Analysis, Insights and Forecast - by Region
- 5.3.1. North America
- 5.3.2. Europe
- 5.3.3. Asia Pacific
- 5.3.4. Latin America
- 5.3.5. Middle East and Africa
- 5.1. Market Analysis, Insights and Forecast - by Application
- 6. North America Military Sensors Market Analysis, Insights and Forecast, 2019-2031
- 6.1. Market Analysis, Insights and Forecast - by Application
- 6.1.1. Intellig
- 6.1.2. Communication and Navigation
- 6.1.3. Target Recognition
- 6.1.4. Electronic Warfare
- 6.1.5. Command and Control
- 6.2. Market Analysis, Insights and Forecast - by Platform
- 6.2.1. Airborne
- 6.2.2. Terrestrial
- 6.2.3. Naval
- 6.1. Market Analysis, Insights and Forecast - by Application
- 7. Europe Military Sensors Market Analysis, Insights and Forecast, 2019-2031
- 7.1. Market Analysis, Insights and Forecast - by Application
- 7.1.1. Intellig
- 7.1.2. Communication and Navigation
- 7.1.3. Target Recognition
- 7.1.4. Electronic Warfare
- 7.1.5. Command and Control
- 7.2. Market Analysis, Insights and Forecast - by Platform
- 7.2.1. Airborne
- 7.2.2. Terrestrial
- 7.2.3. Naval
- 7.1. Market Analysis, Insights and Forecast - by Application
- 8. Asia Pacific Military Sensors Market Analysis, Insights and Forecast, 2019-2031
- 8.1. Market Analysis, Insights and Forecast - by Application
- 8.1.1. Intellig
- 8.1.2. Communication and Navigation
- 8.1.3. Target Recognition
- 8.1.4. Electronic Warfare
- 8.1.5. Command and Control
- 8.2. Market Analysis, Insights and Forecast - by Platform
- 8.2.1. Airborne
- 8.2.2. Terrestrial
- 8.2.3. Naval
- 8.1. Market Analysis, Insights and Forecast - by Application
- 9. Latin America Military Sensors Market Analysis, Insights and Forecast, 2019-2031
- 9.1. Market Analysis, Insights and Forecast - by Application
- 9.1.1. Intellig
- 9.1.2. Communication and Navigation
- 9.1.3. Target Recognition
- 9.1.4. Electronic Warfare
- 9.1.5. Command and Control
- 9.2. Market Analysis, Insights and Forecast - by Platform
- 9.2.1. Airborne
- 9.2.2. Terrestrial
- 9.2.3. Naval
- 9.1. Market Analysis, Insights and Forecast - by Application
- 10. Middle East and Africa Military Sensors Market Analysis, Insights and Forecast, 2019-2031
- 10.1. Market Analysis, Insights and Forecast - by Application
- 10.1.1. Intellig
- 10.1.2. Communication and Navigation
- 10.1.3. Target Recognition
- 10.1.4. Electronic Warfare
- 10.1.5. Command and Control
- 10.2. Market Analysis, Insights and Forecast - by Platform
- 10.2.1. Airborne
- 10.2.2. Terrestrial
- 10.2.3. Naval
- 10.1. Market Analysis, Insights and Forecast - by Application
- 11. North America Military Sensors Market Analysis, Insights and Forecast, 2019-2031
- 11.1. Market Analysis, Insights and Forecast - By Country/Sub-region
- 11.1.1 United States
- 11.1.2 Canada
- 12. Europe Military Sensors Market Analysis, Insights and Forecast, 2019-2031
- 12.1. Market Analysis, Insights and Forecast - By Country/Sub-region
- 12.1.1 United Kingdom
- 12.1.2 France
- 12.1.3 Italy
- 12.1.4 Russia
- 12.1.5 Germany
- 12.1.6 Rest of Europe
- 13. Asia Pacific Military Sensors Market Analysis, Insights and Forecast, 2019-2031
- 13.1. Market Analysis, Insights and Forecast - By Country/Sub-region
- 13.1.1 China
- 13.1.2 Japan
- 13.1.3 India
- 13.1.4 South Korea
- 13.1.5 Rest of Asia Pacific
- 14. Latin America Military Sensors Market Analysis, Insights and Forecast, 2019-2031
- 14.1. Market Analysis, Insights and Forecast - By Country/Sub-region
- 14.1.1 Brazil
- 14.1.2 Mexico
- 14.1.3 Rest of Latin America
- 15. Middle East and Africa Military Sensors Market Analysis, Insights and Forecast, 2019-2031
- 15.1. Market Analysis, Insights and Forecast - By Country/Sub-region
- 15.1.1 Saudi Arabia
- 15.1.2 United Arab Emirates
- 15.1.3 South Africa
- 15.1.4 Rest of Middle East and Africa
- 16. Competitive Analysis
- 16.1. Global Market Share Analysis 2024
- 16.2. Company Profiles
- 16.2.1 Honeywell International Inc
- 16.2.1.1. Overview
- 16.2.1.2. Products
- 16.2.1.3. SWOT Analysis
- 16.2.1.4. Recent Developments
- 16.2.1.5. Financials (Based on Availability)
- 16.2.2 THALES
- 16.2.2.1. Overview
- 16.2.2.2. Products
- 16.2.2.3. SWOT Analysis
- 16.2.2.4. Recent Developments
- 16.2.2.5. Financials (Based on Availability)
- 16.2.3 Kongsberg Gruppen ASA
- 16.2.3.1. Overview
- 16.2.3.2. Products
- 16.2.3.3. SWOT Analysis
- 16.2.3.4. Recent Developments
- 16.2.3.5. Financials (Based on Availability)
- 16.2.4 Lockheed Martin Corporation
- 16.2.4.1. Overview
- 16.2.4.2. Products
- 16.2.4.3. SWOT Analysis
- 16.2.4.4. Recent Developments
- 16.2.4.5. Financials (Based on Availability)
- 16.2.5 Aerosonic LLC (Transdigm Group)
- 16.2.5.1. Overview
- 16.2.5.2. Products
- 16.2.5.3. SWOT Analysis
- 16.2.5.4. Recent Developments
- 16.2.5.5. Financials (Based on Availability)
- 16.2.6 Ultra Electronics Holdings Limited
- 16.2.6.1. Overview
- 16.2.6.2. Products
- 16.2.6.3. SWOT Analysis
- 16.2.6.4. Recent Developments
- 16.2.6.5. Financials (Based on Availability)
- 16.2.7 Imperx Inc
- 16.2.7.1. Overview
- 16.2.7.2. Products
- 16.2.7.3. SWOT Analysis
- 16.2.7.4. Recent Developments
- 16.2.7.5. Financials (Based on Availability)
- 16.2.8 RTX Corporation
- 16.2.8.1. Overview
- 16.2.8.2. Products
- 16.2.8.3. SWOT Analysis
- 16.2.8.4. Recent Developments
- 16.2.8.5. Financials (Based on Availability)
- 16.2.9 TE Connectivity Ltd
- 16.2.9.1. Overview
- 16.2.9.2. Products
- 16.2.9.3. SWOT Analysis
- 16.2.9.4. Recent Developments
- 16.2.9.5. Financials (Based on Availability)
- 16.2.10 BAE Systems plc
- 16.2.10.1. Overview
- 16.2.10.2. Products
- 16.2.10.3. SWOT Analysis
- 16.2.10.4. Recent Developments
- 16.2.10.5. Financials (Based on Availability)
- 16.2.11 General Electric Company
- 16.2.11.1. Overview
- 16.2.11.2. Products
- 16.2.11.3. SWOT Analysis
- 16.2.11.4. Recent Developments
- 16.2.11.5. Financials (Based on Availability)
- 16.2.12 Viooa Imaging Technology Inc
- 16.2.12.1. Overview
- 16.2.12.2. Products
- 16.2.12.3. SWOT Analysis
- 16.2.12.4. Recent Developments
- 16.2.12.5. Financials (Based on Availability)
- 16.2.13 Vectornav Technologies LLC
- 16.2.13.1. Overview
- 16.2.13.2. Products
- 16.2.13.3. SWOT Analysis
- 16.2.13.4. Recent Developments
- 16.2.13.5. Financials (Based on Availability)
- 16.2.1 Honeywell International Inc
List of Figures
- Figure 1: Global Military Sensors Market Revenue Breakdown (Million, %) by Region 2024 & 2032
- Figure 2: North America Military Sensors Market Revenue (Million), by Country 2024 & 2032
- Figure 3: North America Military Sensors Market Revenue Share (%), by Country 2024 & 2032
- Figure 4: Europe Military Sensors Market Revenue (Million), by Country 2024 & 2032
- Figure 5: Europe Military Sensors Market Revenue Share (%), by Country 2024 & 2032
- Figure 6: Asia Pacific Military Sensors Market Revenue (Million), by Country 2024 & 2032
- Figure 7: Asia Pacific Military Sensors Market Revenue Share (%), by Country 2024 & 2032
- Figure 8: Latin America Military Sensors Market Revenue (Million), by Country 2024 & 2032
- Figure 9: Latin America Military Sensors Market Revenue Share (%), by Country 2024 & 2032
- Figure 10: Middle East and Africa Military Sensors Market Revenue (Million), by Country 2024 & 2032
- Figure 11: Middle East and Africa Military Sensors Market Revenue Share (%), by Country 2024 & 2032
- Figure 12: North America Military Sensors Market Revenue (Million), by Application 2024 & 2032
- Figure 13: North America Military Sensors Market Revenue Share (%), by Application 2024 & 2032
- Figure 14: North America Military Sensors Market Revenue (Million), by Platform 2024 & 2032
- Figure 15: North America Military Sensors Market Revenue Share (%), by Platform 2024 & 2032
- Figure 16: North America Military Sensors Market Revenue (Million), by Country 2024 & 2032
- Figure 17: North America Military Sensors Market Revenue Share (%), by Country 2024 & 2032
- Figure 18: Europe Military Sensors Market Revenue (Million), by Application 2024 & 2032
- Figure 19: Europe Military Sensors Market Revenue Share (%), by Application 2024 & 2032
- Figure 20: Europe Military Sensors Market Revenue (Million), by Platform 2024 & 2032
- Figure 21: Europe Military Sensors Market Revenue Share (%), by Platform 2024 & 2032
- Figure 22: Europe Military Sensors Market Revenue (Million), by Country 2024 & 2032
- Figure 23: Europe Military Sensors Market Revenue Share (%), by Country 2024 & 2032
- Figure 24: Asia Pacific Military Sensors Market Revenue (Million), by Application 2024 & 2032
- Figure 25: Asia Pacific Military Sensors Market Revenue Share (%), by Application 2024 & 2032
- Figure 26: Asia Pacific Military Sensors Market Revenue (Million), by Platform 2024 & 2032
- Figure 27: Asia Pacific Military Sensors Market Revenue Share (%), by Platform 2024 & 2032
- Figure 28: Asia Pacific Military Sensors Market Revenue (Million), by Country 2024 & 2032
- Figure 29: Asia Pacific Military Sensors Market Revenue Share (%), by Country 2024 & 2032
- Figure 30: Latin America Military Sensors Market Revenue (Million), by Application 2024 & 2032
- Figure 31: Latin America Military Sensors Market Revenue Share (%), by Application 2024 & 2032
- Figure 32: Latin America Military Sensors Market Revenue (Million), by Platform 2024 & 2032
- Figure 33: Latin America Military Sensors Market Revenue Share (%), by Platform 2024 & 2032
- Figure 34: Latin America Military Sensors Market Revenue (Million), by Country 2024 & 2032
- Figure 35: Latin America Military Sensors Market Revenue Share (%), by Country 2024 & 2032
- Figure 36: Middle East and Africa Military Sensors Market Revenue (Million), by Application 2024 & 2032
- Figure 37: Middle East and Africa Military Sensors Market Revenue Share (%), by Application 2024 & 2032
- Figure 38: Middle East and Africa Military Sensors Market Revenue (Million), by Platform 2024 & 2032
- Figure 39: Middle East and Africa Military Sensors Market Revenue Share (%), by Platform 2024 & 2032
- Figure 40: Middle East and Africa Military Sensors Market Revenue (Million), by Country 2024 & 2032
- Figure 41: Middle East and Africa Military Sensors Market Revenue Share (%), by Country 2024 & 2032
List of Tables
- Table 1: Global Military Sensors Market Revenue Million Forecast, by Region 2019 & 2032
- Table 2: Global Military Sensors Market Revenue Million Forecast, by Application 2019 & 2032
- Table 3: Global Military Sensors Market Revenue Million Forecast, by Platform 2019 & 2032
- Table 4: Global Military Sensors Market Revenue Million Forecast, by Region 2019 & 2032
- Table 5: Global Military Sensors Market Revenue Million Forecast, by Country 2019 & 2032
- Table 6: United States Military Sensors Market Revenue (Million) Forecast, by Application 2019 & 2032
- Table 7: Canada Military Sensors Market Revenue (Million) Forecast, by Application 2019 & 2032
- Table 8: Global Military Sensors Market Revenue Million Forecast, by Country 2019 & 2032
- Table 9: United Kingdom Military Sensors Market Revenue (Million) Forecast, by Application 2019 & 2032
- Table 10: France Military Sensors Market Revenue (Million) Forecast, by Application 2019 & 2032
- Table 11: Italy Military Sensors Market Revenue (Million) Forecast, by Application 2019 & 2032
- Table 12: Russia Military Sensors Market Revenue (Million) Forecast, by Application 2019 & 2032
- Table 13: Germany Military Sensors Market Revenue (Million) Forecast, by Application 2019 & 2032
- Table 14: Rest of Europe Military Sensors Market Revenue (Million) Forecast, by Application 2019 & 2032
- Table 15: Global Military Sensors Market Revenue Million Forecast, by Country 2019 & 2032
- Table 16: China Military Sensors Market Revenue (Million) Forecast, by Application 2019 & 2032
- Table 17: Japan Military Sensors Market Revenue (Million) Forecast, by Application 2019 & 2032
- Table 18: India Military Sensors Market Revenue (Million) Forecast, by Application 2019 & 2032
- Table 19: South Korea Military Sensors Market Revenue (Million) Forecast, by Application 2019 & 2032
- Table 20: Rest of Asia Pacific Military Sensors Market Revenue (Million) Forecast, by Application 2019 & 2032
- Table 21: Global Military Sensors Market Revenue Million Forecast, by Country 2019 & 2032
- Table 22: Brazil Military Sensors Market Revenue (Million) Forecast, by Application 2019 & 2032
- Table 23: Mexico Military Sensors Market Revenue (Million) Forecast, by Application 2019 & 2032
- Table 24: Rest of Latin America Military Sensors Market Revenue (Million) Forecast, by Application 2019 & 2032
- Table 25: Global Military Sensors Market Revenue Million Forecast, by Country 2019 & 2032
- Table 26: Saudi Arabia Military Sensors Market Revenue (Million) Forecast, by Application 2019 & 2032
- Table 27: United Arab Emirates Military Sensors Market Revenue (Million) Forecast, by Application 2019 & 2032
- Table 28: South Africa Military Sensors Market Revenue (Million) Forecast, by Application 2019 & 2032
- Table 29: Rest of Middle East and Africa Military Sensors Market Revenue (Million) Forecast, by Application 2019 & 2032
- Table 30: Global Military Sensors Market Revenue Million Forecast, by Application 2019 & 2032
- Table 31: Global Military Sensors Market Revenue Million Forecast, by Platform 2019 & 2032
- Table 32: Global Military Sensors Market Revenue Million Forecast, by Country 2019 & 2032
- Table 33: United States Military Sensors Market Revenue (Million) Forecast, by Application 2019 & 2032
- Table 34: Canada Military Sensors Market Revenue (Million) Forecast, by Application 2019 & 2032
- Table 35: Global Military Sensors Market Revenue Million Forecast, by Application 2019 & 2032
- Table 36: Global Military Sensors Market Revenue Million Forecast, by Platform 2019 & 2032
- Table 37: Global Military Sensors Market Revenue Million Forecast, by Country 2019 & 2032
- Table 38: United Kingdom Military Sensors Market Revenue (Million) Forecast, by Application 2019 & 2032
- Table 39: France Military Sensors Market Revenue (Million) Forecast, by Application 2019 & 2032
- Table 40: Italy Military Sensors Market Revenue (Million) Forecast, by Application 2019 & 2032
- Table 41: Russia Military Sensors Market Revenue (Million) Forecast, by Application 2019 & 2032
- Table 42: Germany Military Sensors Market Revenue (Million) Forecast, by Application 2019 & 2032
- Table 43: Rest of Europe Military Sensors Market Revenue (Million) Forecast, by Application 2019 & 2032
- Table 44: Global Military Sensors Market Revenue Million Forecast, by Application 2019 & 2032
- Table 45: Global Military Sensors Market Revenue Million Forecast, by Platform 2019 & 2032
- Table 46: Global Military Sensors Market Revenue Million Forecast, by Country 2019 & 2032
- Table 47: China Military Sensors Market Revenue (Million) Forecast, by Application 2019 & 2032
- Table 48: Japan Military Sensors Market Revenue (Million) Forecast, by Application 2019 & 2032
- Table 49: India Military Sensors Market Revenue (Million) Forecast, by Application 2019 & 2032
- Table 50: South Korea Military Sensors Market Revenue (Million) Forecast, by Application 2019 & 2032
- Table 51: Rest of Asia Pacific Military Sensors Market Revenue (Million) Forecast, by Application 2019 & 2032
- Table 52: Global Military Sensors Market Revenue Million Forecast, by Application 2019 & 2032
- Table 53: Global Military Sensors Market Revenue Million Forecast, by Platform 2019 & 2032
- Table 54: Global Military Sensors Market Revenue Million Forecast, by Country 2019 & 2032
- Table 55: Brazil Military Sensors Market Revenue (Million) Forecast, by Application 2019 & 2032
- Table 56: Mexico Military Sensors Market Revenue (Million) Forecast, by Application 2019 & 2032
- Table 57: Rest of Latin America Military Sensors Market Revenue (Million) Forecast, by Application 2019 & 2032
- Table 58: Global Military Sensors Market Revenue Million Forecast, by Application 2019 & 2032
- Table 59: Global Military Sensors Market Revenue Million Forecast, by Platform 2019 & 2032
- Table 60: Global Military Sensors Market Revenue Million Forecast, by Country 2019 & 2032
- Table 61: Saudi Arabia Military Sensors Market Revenue (Million) Forecast, by Application 2019 & 2032
- Table 62: United Arab Emirates Military Sensors Market Revenue (Million) Forecast, by Application 2019 & 2032
- Table 63: South Africa Military Sensors Market Revenue (Million) Forecast, by Application 2019 & 2032
- Table 64: Rest of Middle East and Africa Military Sensors Market Revenue (Million) Forecast, by Application 2019 & 2032
Frequently Asked Questions
1. What is the projected Compound Annual Growth Rate (CAGR) of the Military Sensors Market?
The projected CAGR is approximately 6.16%.
2. Which companies are prominent players in the Military Sensors Market?
Key companies in the market include Honeywell International Inc, THALES, Kongsberg Gruppen ASA, Lockheed Martin Corporation, Aerosonic LLC (Transdigm Group), Ultra Electronics Holdings Limited, Imperx Inc, RTX Corporation, TE Connectivity Ltd, BAE Systems plc, General Electric Company, Viooa Imaging Technology Inc, Vectornav Technologies LLC.
3. What are the main segments of the Military Sensors Market?
The market segments include Application, Platform.
4. Can you provide details about the market size?
The market size is estimated to be USD 15.76 Million as of 2022.
5. What are some drivers contributing to market growth?
N/A
6. What are the notable trends driving market growth?
Airborne Segment Expected to Register the Highest CAGR During the Forecast Period.
7. Are there any restraints impacting market growth?
N/A
8. Can you provide examples of recent developments in the market?
N/A
9. What pricing options are available for accessing the report?
Pricing options include single-user, multi-user, and enterprise licenses priced at USD 4750, USD 5250, and USD 8750 respectively.
10. Is the market size provided in terms of value or volume?
The market size is provided in terms of value, measured in Million.
11. Are there any specific market keywords associated with the report?
Yes, the market keyword associated with the report is "Military Sensors Market," which aids in identifying and referencing the specific market segment covered.
12. How do I determine which pricing option suits my needs best?
The pricing options vary based on user requirements and access needs. Individual users may opt for single-user licenses, while businesses requiring broader access may choose multi-user or enterprise licenses for cost-effective access to the report.
13. Are there any additional resources or data provided in the Military Sensors Market report?
While the report offers comprehensive insights, it's advisable to review the specific contents or supplementary materials provided to ascertain if additional resources or data are available.
14. How can I stay updated on further developments or reports in the Military Sensors Market?
To stay informed about further developments, trends, and reports in the Military Sensors Market, consider subscribing to industry newsletters, following relevant companies and organizations, or regularly checking reputable industry news sources and publications.
Methodology
Step 1 - Identification of Relevant Samples Size from Population Database


Step 2 - Approaches for Defining Global Market Size (Value, Volume* & Price*)

Note*: In applicable scenarios
Step 3 - Data Sources
Primary Research
- Web Analytics
- Survey Reports
- Research Institute
- Latest Research Reports
- Opinion Leaders
Secondary Research
- Annual Reports
- White Paper
- Latest Press Release
- Industry Association
- Paid Database
- Investor Presentations

Step 4 - Data Triangulation
Involves using different sources of information in order to increase the validity of a study
These sources are likely to be stakeholders in a program - participants, other researchers, program staff, other community members, and so on.
Then we put all data in single framework & apply various statistical tools to find out the dynamic on the market.
During the analysis stage, feedback from the stakeholder groups would be compared to determine areas of agreement as well as areas of divergence


