Strategic Insights for Military Robots Industry Market Expansion

Military Robots Industry by Production Analysis, by Consumption Analysis, by Import Market Analysis (Value & Volume), by Export Market Analysis (Value & Volume), by Price Trend Analysis, by North America (United States, Canada, Mexico), by South America (Brazil, Argentina, Rest of South America), by Europe (United Kingdom, Germany, France, Italy, Spain, Russia, Benelux, Nordics, Rest of Europe), by Middle East & Africa (Turkey, Israel, GCC, North Africa, South Africa, Rest of Middle East & Africa), by Asia Pacific (China, India, Japan, South Korea, ASEAN, Oceania, Rest of Asia Pacific) Forecast 2025-2033

Jun 29 2025
Base Year: 2024

234 Pages
Main Logo

Strategic Insights for Military Robots Industry Market Expansion


Home
Industries
Aerospace & Defense
sponsor image
sponsor image
sponsor image
sponsor image

Tailored for you

  • In-depth Analysis Tailored to Specified Regions or Segments
  • Company Profiles Customized to User Preferences
  • Comprehensive Insights Focused on Specific Segments or Regions
  • Customized Evaluation of Competitive Landscape to Meet Your Needs
  • Tailored Customization to Address Other Specific Requirements
Ask for customization


Key Insights

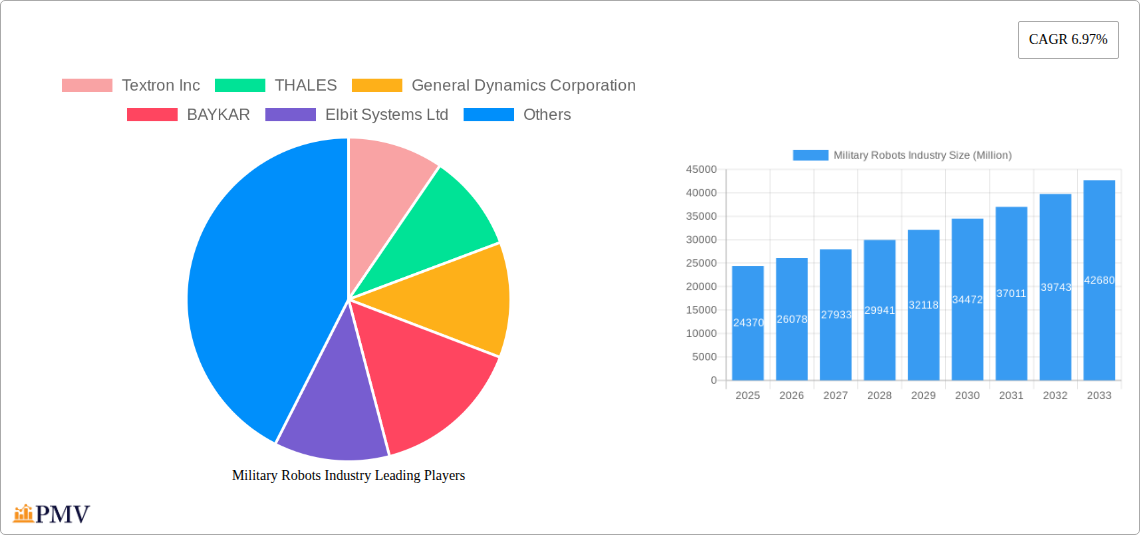
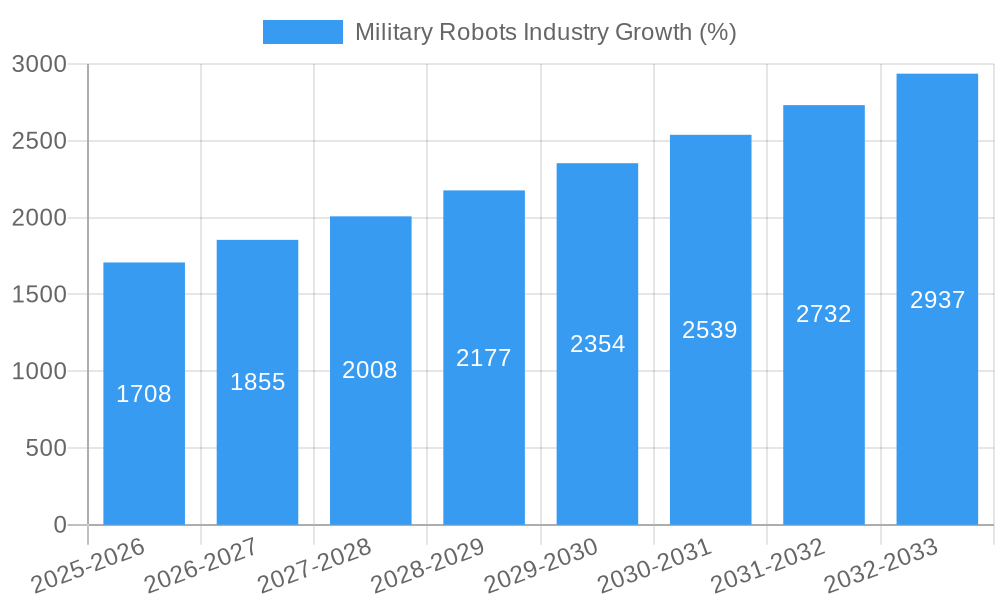
The global military robots market, valued at $24.37 billion in 2025, is projected to experience robust growth, driven by increasing defense budgets worldwide, advancements in artificial intelligence (AI) and robotics technologies, and the rising demand for unmanned systems to reduce human casualties in warfare. The market's Compound Annual Growth Rate (CAGR) of 6.97% from 2025 to 2033 signifies a significant expansion, with autonomous systems expected to dominate market share due to their enhanced capabilities in surveillance, reconnaissance, and combat. Key technological advancements, such as improved sensors, enhanced navigation systems, and more sophisticated AI algorithms, are fueling this growth. Furthermore, the increasing adoption of these systems across various platforms—land, sea, and air—indicates a broader integration into military operations. The market is segmented by platform type (land, marine, airborne) and mode of operation (human-operated, autonomous), offering diverse applications catering to various military needs. Major players like Textron, Thales, General Dynamics, and Lockheed Martin are driving innovation and competition within the sector. Geopolitically, North America and Europe are currently leading the market, yet significant growth is anticipated from the Asia-Pacific region, driven by increasing defense spending in countries like China and India. The integration of AI and machine learning will likely continue to shape the future of military robots, leading to more sophisticated and autonomous systems.

The restraints on market growth primarily include the high initial investment costs associated with the development and deployment of military robots, concerns regarding ethical implications and autonomous weapon systems, and the need for robust cybersecurity measures to prevent system vulnerabilities. However, ongoing technological advancements and increasing government support for research and development are expected to mitigate these challenges. The market is characterized by intense competition among leading defense contractors, which fosters innovation and drives down costs over time. The focus on developing lighter, more agile, and versatile robots will continue to shape the future landscape of this rapidly evolving market. The convergence of AI, robotics, and autonomous systems will significantly contribute to the continued expansion of the military robots market throughout the forecast period.

Military Robots Industry: A Comprehensive Market Report (2019-2033)

This in-depth report provides a comprehensive analysis of the Military Robots Industry, offering actionable insights for stakeholders across the value chain. The study period spans 2019-2033, with a base year of 2025 and a forecast period of 2025-2033. The report covers a market estimated at xx Million in 2025 and projects significant growth through 2033. This report is invaluable for investors, manufacturers, government agencies, and researchers seeking a detailed understanding of this dynamic sector.

Military Robots Industry Research Report - Market Size, Growth & Forecast

Military Robots Industry Market Structure & Competitive Dynamics

The Military Robots Industry is characterized by a moderately concentrated market structure, with several large multinational corporations holding significant market share. The competitive landscape is intensely innovative, driven by continuous advancements in robotics, AI, and sensor technologies. Stringent regulatory frameworks govern the development, deployment, and export of military robots, influencing market dynamics. Substitutes for military robots are limited, primarily encompassing traditional manned systems and surveillance technologies. End-user trends show an increasing preference for autonomous and semi-autonomous systems to enhance operational efficiency and reduce human risk. Mergers and acquisitions (M&A) are relatively frequent, with significant deal values reflecting consolidation and the acquisition of specialized technologies. For example, recent M&A activity has involved deals valued at approximately xx Million, consolidating market power and driving innovation.

  • Market Concentration: Moderate, with top 5 players holding approximately xx% of the market share (2025).
  • Innovation Ecosystem: Highly active, driven by government funding, private investment, and academic research.
  • Regulatory Frameworks: Stringent and evolving, impacting product development and deployment.
  • M&A Activity: Significant, with deals valued at xx Million observed in recent years.

Military Robots Industry Industry Trends & Insights

The Military Robots Industry is experiencing robust growth, driven by increasing defense budgets globally, technological advancements, and the growing demand for unmanned platforms. The Compound Annual Growth Rate (CAGR) is projected to be xx% from 2025 to 2033. Technological disruptions, including advancements in AI, machine learning, and sensor technology, are fundamentally changing the capabilities and applications of military robots. Consumer preference is shifting towards highly autonomous systems capable of performing complex tasks with minimal human intervention. Market penetration continues to rise, particularly within advanced military forces. Competitive dynamics remain intense, with companies focusing on developing advanced capabilities, forging strategic partnerships, and investing in R&D to gain a competitive edge.

Military Robots Industry Growth

Dominant Markets & Segments in Military Robots Industry

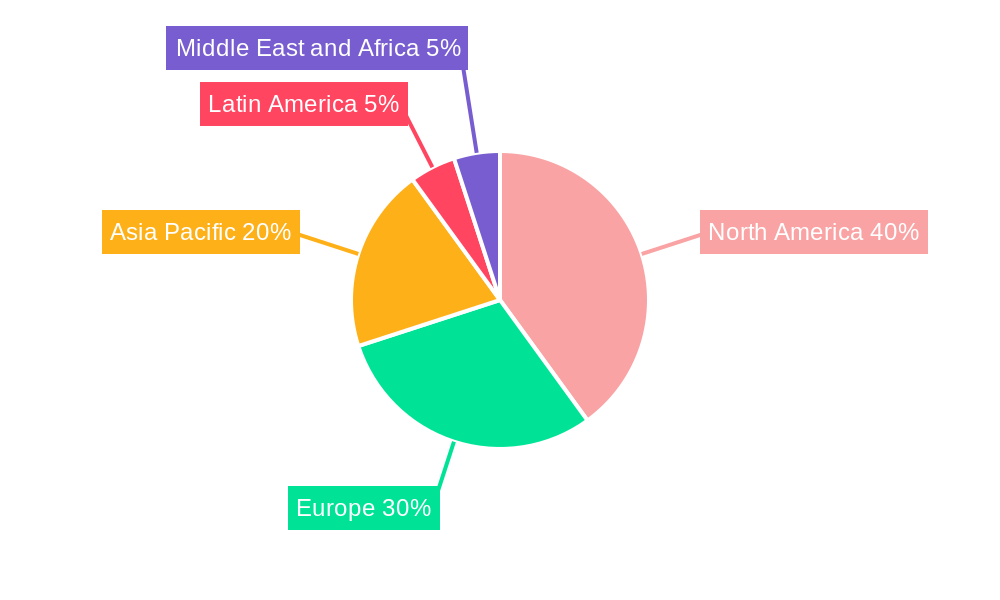
The North American market currently holds the dominant position in the Military Robots Industry. This dominance stems from high defense spending, robust technological capabilities, and the early adoption of robotic systems for military applications. The Land segment currently holds the largest share within platform type, driven by substantial demand for unmanned ground vehicles (UGVs) for reconnaissance, logistics, and combat operations. Autonomous systems are rapidly gaining popularity across various platforms. Key drivers contributing to this dominance include:

  • Strong Defense Budgets: Significant investments in defense modernization.
  • Technological Innovation: Active R&D efforts and advanced technological infrastructure.
  • Favorable Regulatory Environment: Supportive policies facilitating the development and deployment of military robots.

Dominant Segments:

  • Platform: Land
  • Mode of Operation: Autonomous (growing rapidly)

Military Robots Industry Product Innovations

Recent product innovations have focused on enhancing autonomy, improving sensor capabilities, and integrating advanced AI functionalities in military robots. Miniaturization and improved power efficiency are also key trends. New applications include swarm robotics, enhanced situational awareness, and increased lethality. These innovations are driving greater market penetration and providing significant competitive advantages for leading players.

Report Segmentation & Scope

This report segments the Military Robots Industry based on:

  • Platform: Land, Marine, Airborne. The Land segment is currently the largest, but Airborne and Marine segments are exhibiting significant growth potential. Market sizes and competitive dynamics vary across these platforms.

  • Mode of Operation: Human Operated and Autonomous. The Autonomous segment is expected to experience the highest growth rate due to advancements in AI and the demand for increased operational efficiency and reduced human risk.

Key Drivers of Military Robots Industry Growth

Several factors are driving the growth of the Military Robots Industry. These include:

  • Technological Advancements: Rapid progress in AI, robotics, and sensor technologies enables the development of more capable and versatile military robots.
  • Increased Defense Spending: Rising global defense budgets allocate significant funds for military modernization, including the procurement of advanced robotic systems.
  • Operational Requirements: The need for enhanced situational awareness, reduced casualties, and improved operational effectiveness drives the adoption of military robots.

Challenges in the Military Robots Industry Sector

Challenges facing the Military Robots Industry include:

  • Regulatory Hurdles: Strict regulations and ethical concerns surrounding the use of autonomous weapons systems create barriers to entry and deployment.
  • Supply Chain Issues: Dependencies on specialized components and materials can disrupt production and increase costs.
  • High Development Costs: Research, development, and testing of military robots require substantial financial investment.

Leading Players in the Military Robots Industry Market

  • Textron Inc
  • THALES
  • General Dynamics Corporation
  • BAYKAR
  • Elbit Systems Ltd
  • Lockheed Martin Corporation
  • QinetiQ Group PLC
  • Cobham Ltd
  • AeroVironment Inc
  • IAI
  • Aeronautics Ltd
  • BAE Systems plc
  • Northrop Grumman Corporation
  • Saab AB
  • Teledyne FLIR LLC

Key Developments in Military Robots Industry Sector

  • October 2023: The US Army is developing integrated formations of robots and human operators, emphasizing improved battlefield coordination.
  • July 2022: Teledyne FLIR Defense secured a USD 62.1 Million contract for 500 Centaur multi-mission robots.
  • January 2022: China unveiled a large electrically powered quadruped robot for military logistics and reconnaissance.

Strategic Military Robots Industry Market Outlook

The Military Robots Industry is poised for substantial growth, driven by continuous technological innovation and increasing defense budgets globally. Strategic opportunities exist in the development of autonomous systems, advanced AI capabilities, and specialized robotic platforms for niche military applications. Companies that invest in R&D, forge strategic partnerships, and effectively navigate regulatory hurdles are well-positioned to capture significant market share in the years to come.

Military Robots Industry Segmentation

  • 1. Production Analysis
  • 2. Consumption Analysis
  • 3. Import Market Analysis (Value & Volume)
  • 4. Export Market Analysis (Value & Volume)
  • 5. Price Trend Analysis

Military Robots Industry Segmentation By Geography

  • 1. North America
    • 1.1. United States
    • 1.2. Canada
    • 1.3. Mexico
  • 2. South America
    • 2.1. Brazil
    • 2.2. Argentina
    • 2.3. Rest of South America
  • 3. Europe
    • 3.1. United Kingdom
    • 3.2. Germany
    • 3.3. France
    • 3.4. Italy
    • 3.5. Spain
    • 3.6. Russia
    • 3.7. Benelux
    • 3.8. Nordics
    • 3.9. Rest of Europe
  • 4. Middle East & Africa
    • 4.1. Turkey
    • 4.2. Israel
    • 4.3. GCC
    • 4.4. North Africa
    • 4.5. South Africa
    • 4.6. Rest of Middle East & Africa
  • 5. Asia Pacific
    • 5.1. China
    • 5.2. India
    • 5.3. Japan
    • 5.4. South Korea
    • 5.5. ASEAN
    • 5.6. Oceania
    • 5.7. Rest of Asia Pacific
Military Robots Industry Regional Share


Military Robots Industry REPORT HIGHLIGHTS

AspectsDetails
Study Period 2019-2033
Base Year 2024
Estimated Year 2025
Forecast Period2025-2033
Historical Period2019-2024
Growth RateCAGR of 6.97% from 2019-2033
Segmentation
    • By Production Analysis
    • By Consumption Analysis
    • By Import Market Analysis (Value & Volume)
    • By Export Market Analysis (Value & Volume)
    • By Price Trend Analysis
  • By Geography
    • North America
      • United States
      • Canada
      • Mexico
    • South America
      • Brazil
      • Argentina
      • Rest of South America
    • Europe
      • United Kingdom
      • Germany
      • France
      • Italy
      • Spain
      • Russia
      • Benelux
      • Nordics
      • Rest of Europe
    • Middle East & Africa
      • Turkey
      • Israel
      • GCC
      • North Africa
      • South Africa
      • Rest of Middle East & Africa
    • Asia Pacific
      • China
      • India
      • Japan
      • South Korea
      • ASEAN
      • Oceania
      • Rest of Asia Pacific


Table of Contents

  1. 1. Introduction
    • 1.1. Research Scope
    • 1.2. Market Segmentation
    • 1.3. Research Methodology
    • 1.4. Definitions and Assumptions
  2. 2. Executive Summary
    • 2.1. Introduction
  3. 3. Market Dynamics
    • 3.1. Introduction
      • 3.2. Market Drivers
        • 3.2.1. ; Increasing Number Of Air Passengers; Use Of Portable Electronic Devices
      • 3.3. Market Restrains
        • 3.3.1. ; High Cost Of Connectivity Equipments
      • 3.4. Market Trends
        • 3.4.1. Land Segment Anticipated to Generate Highest Growth During the Forecast Period
  4. 4. Market Factor Analysis
    • 4.1. Porters Five Forces
    • 4.2. Supply/Value Chain
    • 4.3. PESTEL analysis
    • 4.4. Market Entropy
    • 4.5. Patent/Trademark Analysis
  5. 5. Global Military Robots Industry Analysis, Insights and Forecast, 2019-2031
    • 5.1. Market Analysis, Insights and Forecast - by Production Analysis
      • 5.2. Market Analysis, Insights and Forecast - by Consumption Analysis
        • 5.3. Market Analysis, Insights and Forecast - by Import Market Analysis (Value & Volume)
          • 5.4. Market Analysis, Insights and Forecast - by Export Market Analysis (Value & Volume)
            • 5.5. Market Analysis, Insights and Forecast - by Price Trend Analysis
              • 5.6. Market Analysis, Insights and Forecast - by Region
                • 5.6.1. North America
                • 5.6.2. South America
                • 5.6.3. Europe
                • 5.6.4. Middle East & Africa
                • 5.6.5. Asia Pacific
            • 6. North America Military Robots Industry Analysis, Insights and Forecast, 2019-2031
              • 6.1. Market Analysis, Insights and Forecast - by Production Analysis
                • 6.2. Market Analysis, Insights and Forecast - by Consumption Analysis
                  • 6.3. Market Analysis, Insights and Forecast - by Import Market Analysis (Value & Volume)
                    • 6.4. Market Analysis, Insights and Forecast - by Export Market Analysis (Value & Volume)
                      • 6.5. Market Analysis, Insights and Forecast - by Price Trend Analysis
                      • 7. South America Military Robots Industry Analysis, Insights and Forecast, 2019-2031
                        • 7.1. Market Analysis, Insights and Forecast - by Production Analysis
                          • 7.2. Market Analysis, Insights and Forecast - by Consumption Analysis
                            • 7.3. Market Analysis, Insights and Forecast - by Import Market Analysis (Value & Volume)
                              • 7.4. Market Analysis, Insights and Forecast - by Export Market Analysis (Value & Volume)
                                • 7.5. Market Analysis, Insights and Forecast - by Price Trend Analysis
                                • 8. Europe Military Robots Industry Analysis, Insights and Forecast, 2019-2031
                                  • 8.1. Market Analysis, Insights and Forecast - by Production Analysis
                                    • 8.2. Market Analysis, Insights and Forecast - by Consumption Analysis
                                      • 8.3. Market Analysis, Insights and Forecast - by Import Market Analysis (Value & Volume)
                                        • 8.4. Market Analysis, Insights and Forecast - by Export Market Analysis (Value & Volume)
                                          • 8.5. Market Analysis, Insights and Forecast - by Price Trend Analysis
                                          • 9. Middle East & Africa Military Robots Industry Analysis, Insights and Forecast, 2019-2031
                                            • 9.1. Market Analysis, Insights and Forecast - by Production Analysis
                                              • 9.2. Market Analysis, Insights and Forecast - by Consumption Analysis
                                                • 9.3. Market Analysis, Insights and Forecast - by Import Market Analysis (Value & Volume)
                                                  • 9.4. Market Analysis, Insights and Forecast - by Export Market Analysis (Value & Volume)
                                                    • 9.5. Market Analysis, Insights and Forecast - by Price Trend Analysis
                                                    • 10. Asia Pacific Military Robots Industry Analysis, Insights and Forecast, 2019-2031
                                                      • 10.1. Market Analysis, Insights and Forecast - by Production Analysis
                                                        • 10.2. Market Analysis, Insights and Forecast - by Consumption Analysis
                                                          • 10.3. Market Analysis, Insights and Forecast - by Import Market Analysis (Value & Volume)
                                                            • 10.4. Market Analysis, Insights and Forecast - by Export Market Analysis (Value & Volume)
                                                              • 10.5. Market Analysis, Insights and Forecast - by Price Trend Analysis
                                                              • 11. North America Military Robots Industry Analysis, Insights and Forecast, 2019-2031
                                                                  • 11.1. Market Analysis, Insights and Forecast - By Country/Sub-region
                                                                    • 11.1.1 United States
                                                                    • 11.1.2 Canada
                                                              • 12. Europe Military Robots Industry Analysis, Insights and Forecast, 2019-2031
                                                                  • 12.1. Market Analysis, Insights and Forecast - By Country/Sub-region
                                                                    • 12.1.1 United Kingdom
                                                                    • 12.1.2 France
                                                                    • 12.1.3 Germany
                                                                    • 12.1.4 Russia
                                                                    • 12.1.5 Rest of Europe
                                                              • 13. Asia Pacific Military Robots Industry Analysis, Insights and Forecast, 2019-2031
                                                                  • 13.1. Market Analysis, Insights and Forecast - By Country/Sub-region
                                                                    • 13.1.1 China
                                                                    • 13.1.2 India
                                                                    • 13.1.3 Japan
                                                                    • 13.1.4 South Korea
                                                                    • 13.1.5 Rest of Asia Pacific
                                                              • 14. Latin America Military Robots Industry Analysis, Insights and Forecast, 2019-2031
                                                                  • 14.1. Market Analysis, Insights and Forecast - By Country/Sub-region
                                                                    • 14.1.1 Brazil
                                                                    • 14.1.2 Rest of Latin America
                                                              • 15. Middle East and Africa Military Robots Industry Analysis, Insights and Forecast, 2019-2031
                                                                  • 15.1. Market Analysis, Insights and Forecast - By Country/Sub-region
                                                                    • 15.1.1 Saudi Arabia
                                                                    • 15.1.2 United Arab Emirates
                                                                    • 15.1.3 Israel
                                                                    • 15.1.4 Turkey
                                                                    • 15.1.5 Rest of Middle East and Africa
                                                              • 16. Competitive Analysis
                                                                • 16.1. Global Market Share Analysis 2024
                                                                  • 16.2. Company Profiles
                                                                    • 16.2.1 Textron Inc
                                                                      • 16.2.1.1. Overview
                                                                      • 16.2.1.2. Products
                                                                      • 16.2.1.3. SWOT Analysis
                                                                      • 16.2.1.4. Recent Developments
                                                                      • 16.2.1.5. Financials (Based on Availability)
                                                                    • 16.2.2 THALES
                                                                      • 16.2.2.1. Overview
                                                                      • 16.2.2.2. Products
                                                                      • 16.2.2.3. SWOT Analysis
                                                                      • 16.2.2.4. Recent Developments
                                                                      • 16.2.2.5. Financials (Based on Availability)
                                                                    • 16.2.3 General Dynamics Corporation
                                                                      • 16.2.3.1. Overview
                                                                      • 16.2.3.2. Products
                                                                      • 16.2.3.3. SWOT Analysis
                                                                      • 16.2.3.4. Recent Developments
                                                                      • 16.2.3.5. Financials (Based on Availability)
                                                                    • 16.2.4 BAYKAR
                                                                      • 16.2.4.1. Overview
                                                                      • 16.2.4.2. Products
                                                                      • 16.2.4.3. SWOT Analysis
                                                                      • 16.2.4.4. Recent Developments
                                                                      • 16.2.4.5. Financials (Based on Availability)
                                                                    • 16.2.5 Elbit Systems Ltd
                                                                      • 16.2.5.1. Overview
                                                                      • 16.2.5.2. Products
                                                                      • 16.2.5.3. SWOT Analysis
                                                                      • 16.2.5.4. Recent Developments
                                                                      • 16.2.5.5. Financials (Based on Availability)
                                                                    • 16.2.6 Lockheed Martin Corporation
                                                                      • 16.2.6.1. Overview
                                                                      • 16.2.6.2. Products
                                                                      • 16.2.6.3. SWOT Analysis
                                                                      • 16.2.6.4. Recent Developments
                                                                      • 16.2.6.5. Financials (Based on Availability)
                                                                    • 16.2.7 QinetiQ Group PLC
                                                                      • 16.2.7.1. Overview
                                                                      • 16.2.7.2. Products
                                                                      • 16.2.7.3. SWOT Analysis
                                                                      • 16.2.7.4. Recent Developments
                                                                      • 16.2.7.5. Financials (Based on Availability)
                                                                    • 16.2.8 Cobham Ltd
                                                                      • 16.2.8.1. Overview
                                                                      • 16.2.8.2. Products
                                                                      • 16.2.8.3. SWOT Analysis
                                                                      • 16.2.8.4. Recent Developments
                                                                      • 16.2.8.5. Financials (Based on Availability)
                                                                    • 16.2.9 AeroVironment Inc
                                                                      • 16.2.9.1. Overview
                                                                      • 16.2.9.2. Products
                                                                      • 16.2.9.3. SWOT Analysis
                                                                      • 16.2.9.4. Recent Developments
                                                                      • 16.2.9.5. Financials (Based on Availability)
                                                                    • 16.2.10 IAI
                                                                      • 16.2.10.1. Overview
                                                                      • 16.2.10.2. Products
                                                                      • 16.2.10.3. SWOT Analysis
                                                                      • 16.2.10.4. Recent Developments
                                                                      • 16.2.10.5. Financials (Based on Availability)
                                                                    • 16.2.11 Aeronautics Ltd
                                                                      • 16.2.11.1. Overview
                                                                      • 16.2.11.2. Products
                                                                      • 16.2.11.3. SWOT Analysis
                                                                      • 16.2.11.4. Recent Developments
                                                                      • 16.2.11.5. Financials (Based on Availability)
                                                                    • 16.2.12 BAE Systems plc
                                                                      • 16.2.12.1. Overview
                                                                      • 16.2.12.2. Products
                                                                      • 16.2.12.3. SWOT Analysis
                                                                      • 16.2.12.4. Recent Developments
                                                                      • 16.2.12.5. Financials (Based on Availability)
                                                                    • 16.2.13 Northrop Grumman Corporation
                                                                      • 16.2.13.1. Overview
                                                                      • 16.2.13.2. Products
                                                                      • 16.2.13.3. SWOT Analysis
                                                                      • 16.2.13.4. Recent Developments
                                                                      • 16.2.13.5. Financials (Based on Availability)
                                                                    • 16.2.14 Saab AB
                                                                      • 16.2.14.1. Overview
                                                                      • 16.2.14.2. Products
                                                                      • 16.2.14.3. SWOT Analysis
                                                                      • 16.2.14.4. Recent Developments
                                                                      • 16.2.14.5. Financials (Based on Availability)
                                                                    • 16.2.15 Teledyne FLIR LLC
                                                                      • 16.2.15.1. Overview
                                                                      • 16.2.15.2. Products
                                                                      • 16.2.15.3. SWOT Analysis
                                                                      • 16.2.15.4. Recent Developments
                                                                      • 16.2.15.5. Financials (Based on Availability)

                                                              List of Figures

                                                              1. Figure 1: Global Military Robots Industry Revenue Breakdown (Million, %) by Region 2024 & 2032
                                                              2. Figure 2: North America Military Robots Industry Revenue (Million), by Country 2024 & 2032
                                                              3. Figure 3: North America Military Robots Industry Revenue Share (%), by Country 2024 & 2032
                                                              4. Figure 4: Europe Military Robots Industry Revenue (Million), by Country 2024 & 2032
                                                              5. Figure 5: Europe Military Robots Industry Revenue Share (%), by Country 2024 & 2032
                                                              6. Figure 6: Asia Pacific Military Robots Industry Revenue (Million), by Country 2024 & 2032
                                                              7. Figure 7: Asia Pacific Military Robots Industry Revenue Share (%), by Country 2024 & 2032
                                                              8. Figure 8: Latin America Military Robots Industry Revenue (Million), by Country 2024 & 2032
                                                              9. Figure 9: Latin America Military Robots Industry Revenue Share (%), by Country 2024 & 2032
                                                              10. Figure 10: Middle East and Africa Military Robots Industry Revenue (Million), by Country 2024 & 2032
                                                              11. Figure 11: Middle East and Africa Military Robots Industry Revenue Share (%), by Country 2024 & 2032
                                                              12. Figure 12: North America Military Robots Industry Revenue (Million), by Production Analysis 2024 & 2032
                                                              13. Figure 13: North America Military Robots Industry Revenue Share (%), by Production Analysis 2024 & 2032
                                                              14. Figure 14: North America Military Robots Industry Revenue (Million), by Consumption Analysis 2024 & 2032
                                                              15. Figure 15: North America Military Robots Industry Revenue Share (%), by Consumption Analysis 2024 & 2032
                                                              16. Figure 16: North America Military Robots Industry Revenue (Million), by Import Market Analysis (Value & Volume) 2024 & 2032
                                                              17. Figure 17: North America Military Robots Industry Revenue Share (%), by Import Market Analysis (Value & Volume) 2024 & 2032
                                                              18. Figure 18: North America Military Robots Industry Revenue (Million), by Export Market Analysis (Value & Volume) 2024 & 2032
                                                              19. Figure 19: North America Military Robots Industry Revenue Share (%), by Export Market Analysis (Value & Volume) 2024 & 2032
                                                              20. Figure 20: North America Military Robots Industry Revenue (Million), by Price Trend Analysis 2024 & 2032
                                                              21. Figure 21: North America Military Robots Industry Revenue Share (%), by Price Trend Analysis 2024 & 2032
                                                              22. Figure 22: North America Military Robots Industry Revenue (Million), by Country 2024 & 2032
                                                              23. Figure 23: North America Military Robots Industry Revenue Share (%), by Country 2024 & 2032
                                                              24. Figure 24: South America Military Robots Industry Revenue (Million), by Production Analysis 2024 & 2032
                                                              25. Figure 25: South America Military Robots Industry Revenue Share (%), by Production Analysis 2024 & 2032
                                                              26. Figure 26: South America Military Robots Industry Revenue (Million), by Consumption Analysis 2024 & 2032
                                                              27. Figure 27: South America Military Robots Industry Revenue Share (%), by Consumption Analysis 2024 & 2032
                                                              28. Figure 28: South America Military Robots Industry Revenue (Million), by Import Market Analysis (Value & Volume) 2024 & 2032
                                                              29. Figure 29: South America Military Robots Industry Revenue Share (%), by Import Market Analysis (Value & Volume) 2024 & 2032
                                                              30. Figure 30: South America Military Robots Industry Revenue (Million), by Export Market Analysis (Value & Volume) 2024 & 2032
                                                              31. Figure 31: South America Military Robots Industry Revenue Share (%), by Export Market Analysis (Value & Volume) 2024 & 2032
                                                              32. Figure 32: South America Military Robots Industry Revenue (Million), by Price Trend Analysis 2024 & 2032
                                                              33. Figure 33: South America Military Robots Industry Revenue Share (%), by Price Trend Analysis 2024 & 2032
                                                              34. Figure 34: South America Military Robots Industry Revenue (Million), by Country 2024 & 2032
                                                              35. Figure 35: South America Military Robots Industry Revenue Share (%), by Country 2024 & 2032
                                                              36. Figure 36: Europe Military Robots Industry Revenue (Million), by Production Analysis 2024 & 2032
                                                              37. Figure 37: Europe Military Robots Industry Revenue Share (%), by Production Analysis 2024 & 2032
                                                              38. Figure 38: Europe Military Robots Industry Revenue (Million), by Consumption Analysis 2024 & 2032
                                                              39. Figure 39: Europe Military Robots Industry Revenue Share (%), by Consumption Analysis 2024 & 2032
                                                              40. Figure 40: Europe Military Robots Industry Revenue (Million), by Import Market Analysis (Value & Volume) 2024 & 2032
                                                              41. Figure 41: Europe Military Robots Industry Revenue Share (%), by Import Market Analysis (Value & Volume) 2024 & 2032
                                                              42. Figure 42: Europe Military Robots Industry Revenue (Million), by Export Market Analysis (Value & Volume) 2024 & 2032
                                                              43. Figure 43: Europe Military Robots Industry Revenue Share (%), by Export Market Analysis (Value & Volume) 2024 & 2032
                                                              44. Figure 44: Europe Military Robots Industry Revenue (Million), by Price Trend Analysis 2024 & 2032
                                                              45. Figure 45: Europe Military Robots Industry Revenue Share (%), by Price Trend Analysis 2024 & 2032
                                                              46. Figure 46: Europe Military Robots Industry Revenue (Million), by Country 2024 & 2032
                                                              47. Figure 47: Europe Military Robots Industry Revenue Share (%), by Country 2024 & 2032
                                                              48. Figure 48: Middle East & Africa Military Robots Industry Revenue (Million), by Production Analysis 2024 & 2032
                                                              49. Figure 49: Middle East & Africa Military Robots Industry Revenue Share (%), by Production Analysis 2024 & 2032
                                                              50. Figure 50: Middle East & Africa Military Robots Industry Revenue (Million), by Consumption Analysis 2024 & 2032
                                                              51. Figure 51: Middle East & Africa Military Robots Industry Revenue Share (%), by Consumption Analysis 2024 & 2032
                                                              52. Figure 52: Middle East & Africa Military Robots Industry Revenue (Million), by Import Market Analysis (Value & Volume) 2024 & 2032
                                                              53. Figure 53: Middle East & Africa Military Robots Industry Revenue Share (%), by Import Market Analysis (Value & Volume) 2024 & 2032
                                                              54. Figure 54: Middle East & Africa Military Robots Industry Revenue (Million), by Export Market Analysis (Value & Volume) 2024 & 2032
                                                              55. Figure 55: Middle East & Africa Military Robots Industry Revenue Share (%), by Export Market Analysis (Value & Volume) 2024 & 2032
                                                              56. Figure 56: Middle East & Africa Military Robots Industry Revenue (Million), by Price Trend Analysis 2024 & 2032
                                                              57. Figure 57: Middle East & Africa Military Robots Industry Revenue Share (%), by Price Trend Analysis 2024 & 2032
                                                              58. Figure 58: Middle East & Africa Military Robots Industry Revenue (Million), by Country 2024 & 2032
                                                              59. Figure 59: Middle East & Africa Military Robots Industry Revenue Share (%), by Country 2024 & 2032
                                                              60. Figure 60: Asia Pacific Military Robots Industry Revenue (Million), by Production Analysis 2024 & 2032
                                                              61. Figure 61: Asia Pacific Military Robots Industry Revenue Share (%), by Production Analysis 2024 & 2032
                                                              62. Figure 62: Asia Pacific Military Robots Industry Revenue (Million), by Consumption Analysis 2024 & 2032
                                                              63. Figure 63: Asia Pacific Military Robots Industry Revenue Share (%), by Consumption Analysis 2024 & 2032
                                                              64. Figure 64: Asia Pacific Military Robots Industry Revenue (Million), by Import Market Analysis (Value & Volume) 2024 & 2032
                                                              65. Figure 65: Asia Pacific Military Robots Industry Revenue Share (%), by Import Market Analysis (Value & Volume) 2024 & 2032
                                                              66. Figure 66: Asia Pacific Military Robots Industry Revenue (Million), by Export Market Analysis (Value & Volume) 2024 & 2032
                                                              67. Figure 67: Asia Pacific Military Robots Industry Revenue Share (%), by Export Market Analysis (Value & Volume) 2024 & 2032
                                                              68. Figure 68: Asia Pacific Military Robots Industry Revenue (Million), by Price Trend Analysis 2024 & 2032
                                                              69. Figure 69: Asia Pacific Military Robots Industry Revenue Share (%), by Price Trend Analysis 2024 & 2032
                                                              70. Figure 70: Asia Pacific Military Robots Industry Revenue (Million), by Country 2024 & 2032
                                                              71. Figure 71: Asia Pacific Military Robots Industry Revenue Share (%), by Country 2024 & 2032

                                                              List of Tables

                                                              1. Table 1: Global Military Robots Industry Revenue Million Forecast, by Region 2019 & 2032
                                                              2. Table 2: Global Military Robots Industry Revenue Million Forecast, by Production Analysis 2019 & 2032
                                                              3. Table 3: Global Military Robots Industry Revenue Million Forecast, by Consumption Analysis 2019 & 2032
                                                              4. Table 4: Global Military Robots Industry Revenue Million Forecast, by Import Market Analysis (Value & Volume) 2019 & 2032
                                                              5. Table 5: Global Military Robots Industry Revenue Million Forecast, by Export Market Analysis (Value & Volume) 2019 & 2032
                                                              6. Table 6: Global Military Robots Industry Revenue Million Forecast, by Price Trend Analysis 2019 & 2032
                                                              7. Table 7: Global Military Robots Industry Revenue Million Forecast, by Region 2019 & 2032
                                                              8. Table 8: Global Military Robots Industry Revenue Million Forecast, by Country 2019 & 2032
                                                              9. Table 9: United States Military Robots Industry Revenue (Million) Forecast, by Application 2019 & 2032
                                                              10. Table 10: Canada Military Robots Industry Revenue (Million) Forecast, by Application 2019 & 2032
                                                              11. Table 11: Global Military Robots Industry Revenue Million Forecast, by Country 2019 & 2032
                                                              12. Table 12: United Kingdom Military Robots Industry Revenue (Million) Forecast, by Application 2019 & 2032
                                                              13. Table 13: France Military Robots Industry Revenue (Million) Forecast, by Application 2019 & 2032
                                                              14. Table 14: Germany Military Robots Industry Revenue (Million) Forecast, by Application 2019 & 2032
                                                              15. Table 15: Russia Military Robots Industry Revenue (Million) Forecast, by Application 2019 & 2032
                                                              16. Table 16: Rest of Europe Military Robots Industry Revenue (Million) Forecast, by Application 2019 & 2032
                                                              17. Table 17: Global Military Robots Industry Revenue Million Forecast, by Country 2019 & 2032
                                                              18. Table 18: China Military Robots Industry Revenue (Million) Forecast, by Application 2019 & 2032
                                                              19. Table 19: India Military Robots Industry Revenue (Million) Forecast, by Application 2019 & 2032
                                                              20. Table 20: Japan Military Robots Industry Revenue (Million) Forecast, by Application 2019 & 2032
                                                              21. Table 21: South Korea Military Robots Industry Revenue (Million) Forecast, by Application 2019 & 2032
                                                              22. Table 22: Rest of Asia Pacific Military Robots Industry Revenue (Million) Forecast, by Application 2019 & 2032
                                                              23. Table 23: Global Military Robots Industry Revenue Million Forecast, by Country 2019 & 2032
                                                              24. Table 24: Brazil Military Robots Industry Revenue (Million) Forecast, by Application 2019 & 2032
                                                              25. Table 25: Rest of Latin America Military Robots Industry Revenue (Million) Forecast, by Application 2019 & 2032
                                                              26. Table 26: Global Military Robots Industry Revenue Million Forecast, by Country 2019 & 2032
                                                              27. Table 27: Saudi Arabia Military Robots Industry Revenue (Million) Forecast, by Application 2019 & 2032
                                                              28. Table 28: United Arab Emirates Military Robots Industry Revenue (Million) Forecast, by Application 2019 & 2032
                                                              29. Table 29: Israel Military Robots Industry Revenue (Million) Forecast, by Application 2019 & 2032
                                                              30. Table 30: Turkey Military Robots Industry Revenue (Million) Forecast, by Application 2019 & 2032
                                                              31. Table 31: Rest of Middle East and Africa Military Robots Industry Revenue (Million) Forecast, by Application 2019 & 2032
                                                              32. Table 32: Global Military Robots Industry Revenue Million Forecast, by Production Analysis 2019 & 2032
                                                              33. Table 33: Global Military Robots Industry Revenue Million Forecast, by Consumption Analysis 2019 & 2032
                                                              34. Table 34: Global Military Robots Industry Revenue Million Forecast, by Import Market Analysis (Value & Volume) 2019 & 2032
                                                              35. Table 35: Global Military Robots Industry Revenue Million Forecast, by Export Market Analysis (Value & Volume) 2019 & 2032
                                                              36. Table 36: Global Military Robots Industry Revenue Million Forecast, by Price Trend Analysis 2019 & 2032
                                                              37. Table 37: Global Military Robots Industry Revenue Million Forecast, by Country 2019 & 2032
                                                              38. Table 38: United States Military Robots Industry Revenue (Million) Forecast, by Application 2019 & 2032
                                                              39. Table 39: Canada Military Robots Industry Revenue (Million) Forecast, by Application 2019 & 2032
                                                              40. Table 40: Mexico Military Robots Industry Revenue (Million) Forecast, by Application 2019 & 2032
                                                              41. Table 41: Global Military Robots Industry Revenue Million Forecast, by Production Analysis 2019 & 2032
                                                              42. Table 42: Global Military Robots Industry Revenue Million Forecast, by Consumption Analysis 2019 & 2032
                                                              43. Table 43: Global Military Robots Industry Revenue Million Forecast, by Import Market Analysis (Value & Volume) 2019 & 2032
                                                              44. Table 44: Global Military Robots Industry Revenue Million Forecast, by Export Market Analysis (Value & Volume) 2019 & 2032
                                                              45. Table 45: Global Military Robots Industry Revenue Million Forecast, by Price Trend Analysis 2019 & 2032
                                                              46. Table 46: Global Military Robots Industry Revenue Million Forecast, by Country 2019 & 2032
                                                              47. Table 47: Brazil Military Robots Industry Revenue (Million) Forecast, by Application 2019 & 2032
                                                              48. Table 48: Argentina Military Robots Industry Revenue (Million) Forecast, by Application 2019 & 2032
                                                              49. Table 49: Rest of South America Military Robots Industry Revenue (Million) Forecast, by Application 2019 & 2032
                                                              50. Table 50: Global Military Robots Industry Revenue Million Forecast, by Production Analysis 2019 & 2032
                                                              51. Table 51: Global Military Robots Industry Revenue Million Forecast, by Consumption Analysis 2019 & 2032
                                                              52. Table 52: Global Military Robots Industry Revenue Million Forecast, by Import Market Analysis (Value & Volume) 2019 & 2032
                                                              53. Table 53: Global Military Robots Industry Revenue Million Forecast, by Export Market Analysis (Value & Volume) 2019 & 2032
                                                              54. Table 54: Global Military Robots Industry Revenue Million Forecast, by Price Trend Analysis 2019 & 2032
                                                              55. Table 55: Global Military Robots Industry Revenue Million Forecast, by Country 2019 & 2032
                                                              56. Table 56: United Kingdom Military Robots Industry Revenue (Million) Forecast, by Application 2019 & 2032
                                                              57. Table 57: Germany Military Robots Industry Revenue (Million) Forecast, by Application 2019 & 2032
                                                              58. Table 58: France Military Robots Industry Revenue (Million) Forecast, by Application 2019 & 2032
                                                              59. Table 59: Italy Military Robots Industry Revenue (Million) Forecast, by Application 2019 & 2032
                                                              60. Table 60: Spain Military Robots Industry Revenue (Million) Forecast, by Application 2019 & 2032
                                                              61. Table 61: Russia Military Robots Industry Revenue (Million) Forecast, by Application 2019 & 2032
                                                              62. Table 62: Benelux Military Robots Industry Revenue (Million) Forecast, by Application 2019 & 2032
                                                              63. Table 63: Nordics Military Robots Industry Revenue (Million) Forecast, by Application 2019 & 2032
                                                              64. Table 64: Rest of Europe Military Robots Industry Revenue (Million) Forecast, by Application 2019 & 2032
                                                              65. Table 65: Global Military Robots Industry Revenue Million Forecast, by Production Analysis 2019 & 2032
                                                              66. Table 66: Global Military Robots Industry Revenue Million Forecast, by Consumption Analysis 2019 & 2032
                                                              67. Table 67: Global Military Robots Industry Revenue Million Forecast, by Import Market Analysis (Value & Volume) 2019 & 2032
                                                              68. Table 68: Global Military Robots Industry Revenue Million Forecast, by Export Market Analysis (Value & Volume) 2019 & 2032
                                                              69. Table 69: Global Military Robots Industry Revenue Million Forecast, by Price Trend Analysis 2019 & 2032
                                                              70. Table 70: Global Military Robots Industry Revenue Million Forecast, by Country 2019 & 2032
                                                              71. Table 71: Turkey Military Robots Industry Revenue (Million) Forecast, by Application 2019 & 2032
                                                              72. Table 72: Israel Military Robots Industry Revenue (Million) Forecast, by Application 2019 & 2032
                                                              73. Table 73: GCC Military Robots Industry Revenue (Million) Forecast, by Application 2019 & 2032
                                                              74. Table 74: North Africa Military Robots Industry Revenue (Million) Forecast, by Application 2019 & 2032
                                                              75. Table 75: South Africa Military Robots Industry Revenue (Million) Forecast, by Application 2019 & 2032
                                                              76. Table 76: Rest of Middle East & Africa Military Robots Industry Revenue (Million) Forecast, by Application 2019 & 2032
                                                              77. Table 77: Global Military Robots Industry Revenue Million Forecast, by Production Analysis 2019 & 2032
                                                              78. Table 78: Global Military Robots Industry Revenue Million Forecast, by Consumption Analysis 2019 & 2032
                                                              79. Table 79: Global Military Robots Industry Revenue Million Forecast, by Import Market Analysis (Value & Volume) 2019 & 2032
                                                              80. Table 80: Global Military Robots Industry Revenue Million Forecast, by Export Market Analysis (Value & Volume) 2019 & 2032
                                                              81. Table 81: Global Military Robots Industry Revenue Million Forecast, by Price Trend Analysis 2019 & 2032
                                                              82. Table 82: Global Military Robots Industry Revenue Million Forecast, by Country 2019 & 2032
                                                              83. Table 83: China Military Robots Industry Revenue (Million) Forecast, by Application 2019 & 2032
                                                              84. Table 84: India Military Robots Industry Revenue (Million) Forecast, by Application 2019 & 2032
                                                              85. Table 85: Japan Military Robots Industry Revenue (Million) Forecast, by Application 2019 & 2032
                                                              86. Table 86: South Korea Military Robots Industry Revenue (Million) Forecast, by Application 2019 & 2032
                                                              87. Table 87: ASEAN Military Robots Industry Revenue (Million) Forecast, by Application 2019 & 2032
                                                              88. Table 88: Oceania Military Robots Industry Revenue (Million) Forecast, by Application 2019 & 2032
                                                              89. Table 89: Rest of Asia Pacific Military Robots Industry Revenue (Million) Forecast, by Application 2019 & 2032


                                                              Frequently Asked Questions

                                                              1. What is the projected Compound Annual Growth Rate (CAGR) of the Military Robots Industry?

                                                              The projected CAGR is approximately 6.97%.

                                                              2. Which companies are prominent players in the Military Robots Industry?

                                                              Key companies in the market include Textron Inc, THALES, General Dynamics Corporation, BAYKAR, Elbit Systems Ltd, Lockheed Martin Corporation, QinetiQ Group PLC, Cobham Ltd, AeroVironment Inc, IAI, Aeronautics Ltd, BAE Systems plc, Northrop Grumman Corporation, Saab AB, Teledyne FLIR LLC.

                                                              3. What are the main segments of the Military Robots Industry?

                                                              The market segments include Production Analysis, Consumption Analysis, Import Market Analysis (Value & Volume), Export Market Analysis (Value & Volume), Price Trend Analysis.

                                                              4. Can you provide details about the market size?

                                                              The market size is estimated to be USD 24.37 Million as of 2022.

                                                              5. What are some drivers contributing to market growth?

                                                              ; Increasing Number Of Air Passengers; Use Of Portable Electronic Devices.

                                                              6. What are the notable trends driving market growth?

                                                              Land Segment Anticipated to Generate Highest Growth During the Forecast Period.

                                                              7. Are there any restraints impacting market growth?

                                                              ; High Cost Of Connectivity Equipments.

                                                              8. Can you provide examples of recent developments in the market?

                                                              October 2023: The US Army is reportedly developing integrated formations of robots and human operators as part of the modernization efforts. The US Army’s Rapid Capabilities and Critical Technologies Office (RCCTO) plans to use existing science and technology as well as information from fielded programs to figure out how to combine capabilities to maximize coordination on the battlefield.

                                                              9. What pricing options are available for accessing the report?

                                                              Pricing options include single-user, multi-user, and enterprise licenses priced at USD 4750, USD 5250, and USD 8750 respectively.

                                                              10. Is the market size provided in terms of value or volume?

                                                              The market size is provided in terms of value, measured in Million.

                                                              11. Are there any specific market keywords associated with the report?

                                                              Yes, the market keyword associated with the report is "Military Robots Industry," which aids in identifying and referencing the specific market segment covered.

                                                              12. How do I determine which pricing option suits my needs best?

                                                              The pricing options vary based on user requirements and access needs. Individual users may opt for single-user licenses, while businesses requiring broader access may choose multi-user or enterprise licenses for cost-effective access to the report.

                                                              13. Are there any additional resources or data provided in the Military Robots Industry report?

                                                              While the report offers comprehensive insights, it's advisable to review the specific contents or supplementary materials provided to ascertain if additional resources or data are available.

                                                              14. How can I stay updated on further developments or reports in the Military Robots Industry?

                                                              To stay informed about further developments, trends, and reports in the Military Robots Industry, consider subscribing to industry newsletters, following relevant companies and organizations, or regularly checking reputable industry news sources and publications.


                                                              Methodology

                                                              Step 1 - Identification of Relevant Samples Size from Population Database

                                                              Step Chart
                                                              Bar Chart
                                                              Method Chart

                                                              Step 2 - Approaches for Defining Global Market Size (Value, Volume* & Price*)

                                                              Approach Chart
                                                              Top-down and bottom-up approaches are used to validate the global market size and estimate the market size for manufactures, regional segments, product, and application.

                                                              Note*: In applicable scenarios

                                                              Step 3 - Data Sources

                                                              Primary Research

                                                              • Web Analytics
                                                              • Survey Reports
                                                              • Research Institute
                                                              • Latest Research Reports
                                                              • Opinion Leaders

                                                              Secondary Research

                                                              • Annual Reports
                                                              • White Paper
                                                              • Latest Press Release
                                                              • Industry Association
                                                              • Paid Database
                                                              • Investor Presentations
                                                              Analyst Chart

                                                              Step 4 - Data Triangulation

                                                              Involves using different sources of information in order to increase the validity of a study

                                                              These sources are likely to be stakeholders in a program - participants, other researchers, program staff, other community members, and so on.

                                                              Then we put all data in single framework & apply various statistical tools to find out the dynamic on the market.

                                                              During the analysis stage, feedback from the stakeholder groups would be compared to determine areas of agreement as well as areas of divergence

                                                              Additionally, after gathering mixed and scattered data from a wide range of sources, data is triangulated and correlated to come up with estimated figures which are further validated through primary mediums or industry experts, opinion leaders.

                                                              About Precision Market View

                                                              Precision Market View offers precise market research, industry intelligence, and data analysis for healthcare, manufacturing, technology, and energy. Our reports provide the clarity you need to make informed decisions and drive growth.

                                                              Our team combines primary research, advanced analytics, and industry expertise to deliver actionable intelligence. We offer syndicated reports, custom research, and consulting services tailored to your business needs.

                                                              At Precision Market View, we are committed to quality, transparency, and client satisfaction. Every report is rigorously validated to ensure accuracy and relevance. Our global perspective and local expertise help you understand both the big picture and the finer details of your market.

                                                              Stay informed with Precision Market View. Subscribe to our newsletter for the latest updates and research highlights, and follow us on social media for real-time insights.

                                                              Precision Market View – Clarity for Your Strategic Decisions.

                                                              artwork spiralartwork spiralRelated Reports
                                                              artwork underline

                                                              Exploring Americas Intelligence Surveillance and Reconnaissance Market Market Disruption and Innovation

                                                              Discover the booming Americas Intelligence Surveillance and Reconnaissance (ISR) market! This comprehensive analysis reveals a CAGR exceeding 4.80% through 2033, driven by geopolitical tensions and technological advancements. Explore key players, regional trends, and growth opportunities in this vital sector.

                                                              July 2025
                                                              Base Year: 2024
                                                              No Of Pages: 197
                                                              Price: $3800

                                                              Exploring Innovation in Asia-Pacific And Middle-East Inflight Catering Market Industry

                                                              Discover the booming Asia-Pacific & Middle-East inflight catering market! Projected to reach \$15.89B by 2033 with a 10.05% CAGR, this report analyzes market size, key trends (premiumization, diverse cuisines), and leading players like Emirates & LSG. Learn more about regional growth and investment opportunities.

                                                              July 2025
                                                              Base Year: 2024
                                                              No Of Pages: 234
                                                              Price: $4750

                                                              Opportunities in Europe Military Satellite Market Market 2025-2033

                                                              Discover the booming European military satellite market! Our analysis reveals a €1.5 billion market in 2025 projected to reach €4 billion by 2033, driven by geopolitical tensions and technological advancements. Explore key trends, segments (LEO, GEO, satellite subsystems), and major players shaping this dynamic sector.

                                                              July 2025
                                                              Base Year: 2024
                                                              No Of Pages: 197
                                                              Price: $3800

                                                              Global Southeast Asia Defense Market Trends: Region-Specific Insights 2025-2033

                                                              The Southeast Asia defense market is booming, projected to reach over $25 billion by 2033, driven by modernization efforts and geopolitical tensions. This comprehensive analysis reveals key market trends, drivers, restraints, and leading companies in this rapidly expanding sector. Explore the opportunities and challenges in the Singapore, Indonesia, Thailand, and Malaysia defense markets.

                                                              July 2025
                                                              Base Year: 2024
                                                              No Of Pages: 197
                                                              Price: $3800

                                                              Comprehensive Overview of Cabin Interior Composites Industry Trends: 2025-2033

                                                              The Cabin Interior Composites market is booming, projected to exceed $XX million by 2033 with a CAGR above 6%. Learn about key drivers, market trends, leading companies (Triumph Group, Safran, etc.), and regional growth forecasts in this comprehensive market analysis. Discover opportunities in lightweight aircraft design and sustainable materials.

                                                              July 2025
                                                              Base Year: 2024
                                                              No Of Pages: 234
                                                              Price: $4750

                                                              Micro Turbine Generator System Market Market Drivers and Challenges: Trends 2025-2033

                                                              The Micro Turbine Generator System (MTGS) market is booming, projected to exceed a CAGR of 18% through 2033. Driven by demand for reliable power in remote areas and advancements in technology, this market presents lucrative opportunities across commercial, military, and industrial sectors. Explore market trends, key players, and regional insights in this comprehensive analysis.

                                                              July 2025
                                                              Base Year: 2024
                                                              No Of Pages: 234
                                                              Price: $4750

                                                              Electrical Weapons Market Market Trends and Strategic Roadmap

                                                              The global electrical weapons market is booming, projected to reach [estimated 2033 value based on CAGR] by 2033. Driven by law enforcement and military demand for less-lethal options, this market analysis explores key trends, leading companies (Axon, Lockheed Martin, etc.), and regional growth opportunities in stun guns, tasers, and advanced technologies.

                                                              July 2025
                                                              Base Year: 2024
                                                              No Of Pages: 234
                                                              Price: $4750

                                                              Fighter Aircraft Market: Disruptive Technologies Driving Market Growth 2025-2033

                                                              The global fighter aircraft market, valued at $47.34 billion in 2025, is poised for significant growth (CAGR 3.72%) driven by geopolitical tensions and technological advancements. Explore market trends, leading companies (Lockheed Martin, Boeing, Dassault), and regional insights in this comprehensive analysis.

                                                              July 2025
                                                              Base Year: 2024
                                                              No Of Pages: 234
                                                              Price: $4750

                                                              Military Gas Mask Market Market’s Consumer Insights and Trends

                                                              The Military Gas Mask Market is poised for significant growth, driven by rising geopolitical tensions and technological advancements. Discover key trends, market size projections (2025-2033), leading companies, and regional analysis in this comprehensive market report. Explore the impact of powered respirators and evolving military needs on this dynamic sector.

                                                              July 2025
                                                              Base Year: 2024
                                                              No Of Pages: 234
                                                              Price: $4750

                                                              Exploring Middle-East and Africa Airport Baggage Handling Systems Market Growth Trajectories: CAGR Insights 2025-2033

                                                              The Middle East & Africa Airport Baggage Handling Systems market is booming, projected to reach $90.71 million in 2025 with a 10.09% CAGR through 2033. Discover key drivers, trends, and regional insights in this comprehensive market analysis. Explore growth opportunities in automated baggage systems and airport modernization.

                                                              July 2025
                                                              Base Year: 2024
                                                              No Of Pages: 210
                                                              Price: $4750

                                                              Aircraft Engines Market in Europe Market Demand and Consumption Trends: Outlook 2025-2033

                                                              The European aircraft engines market is booming, with a projected €20.73 billion valuation in 2025 and a 3.82% CAGR through 2033. Discover key trends, major players (Rolls-Royce, Safran, Pratt & Whitney), and regional breakdowns in this comprehensive market analysis.

                                                              July 2025
                                                              Base Year: 2024
                                                              No Of Pages: 234
                                                              Price: $4750

                                                              Small Arms Light Weapons Market Market Analysis and Forecasts

                                                              The global small arms and light weapons market is experiencing steady growth, driven by increased military spending, law enforcement demand, and civilian ownership. This comprehensive analysis explores market size, trends, key players, and regional insights from 2019-2033, offering valuable data for industry stakeholders.

                                                              July 2025
                                                              Base Year: 2024
                                                              No Of Pages: 234
                                                              Price: $4750

                                                              Turkey Defense & Aerospace Industry Future-Proof Strategies: Market Trends 2025-2033

                                                              Discover the booming Turkish defense & aerospace industry! This in-depth market analysis reveals a $15.27B (2025) market with a projected CAGR of 1.15%, driven by government investment and leading companies like Turkish Technic and ASELSAN. Explore market trends, key players, and future growth potential.

                                                              July 2025
                                                              Base Year: 2024
                                                              No Of Pages: 197
                                                              Price: $3800

                                                              Understanding UAM Market Trends and Growth Dynamics

                                                              The Urban Air Mobility (UAM) market is booming, projected to reach $19.13 billion by 2033 with a 23.54% CAGR. Discover key trends, growth drivers, and major players shaping this transformative sector, including eVTOL aircraft, autonomous flight, and regional market analysis. Learn how advancements in technology and supportive regulations are driving this rapidly expanding market.

                                                              July 2025
                                                              Base Year: 2024
                                                              No Of Pages: 234
                                                              Price: $4750

                                                              Growth Strategies in Europe Air Defense Systems Market Market: 2025-2033 Outlook

                                                              The European Air Defense Systems Market is booming, projected to reach €16.31 billion by 2033, driven by geopolitical tensions and technological advancements. This in-depth analysis reveals key market drivers, trends, restraints, and leading companies, providing valuable insights for investors and industry professionals. Explore the market's growth potential across air, sea, and land-based systems in key European nations.

                                                              July 2025
                                                              Base Year: 2024
                                                              No Of Pages: 234
                                                              Price: $4750

                                                              Defense Market in the Middle East & Africa CAGR Growth Drivers and Trends: Forecasts 2025-2033

                                                              The Middle East & Africa defense market is booming, projected to reach \$207.5 billion by 2033, driven by geopolitical instability and modernization efforts. Explore market trends, key players (Rheinmetall, Elbit Systems, Lockheed Martin), and regional growth forecasts in this comprehensive analysis.

                                                              July 2025
                                                              Base Year: 2024
                                                              No Of Pages: 234
                                                              Price: $4750

                                                              Air-based Remote Weapon Stations Market 2025 Trends and Forecasts 2033: Analyzing Growth Opportunities

                                                              The Air-based Remote Weapon Stations (RWS) market is booming, with a 7.32% CAGR. Explore market trends, key players (General Dynamics, Elbit Systems, Leonardo), regional insights, and future projections for this rapidly expanding sector of defense technology. Discover the impact of UAVs and advanced sensor technologies on this multi-billion dollar market.

                                                              July 2025
                                                              Base Year: 2024
                                                              No Of Pages: 234
                                                              Price: $4750

                                                              Comprehensive Review of US Business Jet Market Growth Potential

                                                              The US business jet market is booming, with a CAGR exceeding 16% and projected to reach $75 billion by 2033. This report analyzes market drivers, restraints, segments (large, light, mid-size jets), key players (Textron, Dassault, Embraer, Bombardier), and regional trends across the US. Discover insights into this lucrative sector.

                                                              July 2025
                                                              Base Year: 2024
                                                              No Of Pages: 197
                                                              Price: $3800

                                                              Latin America Aviation Industry Market Size and Trends 2025-2033: Comprehensive Outlook

                                                              Discover the booming Latin American aviation market! This in-depth analysis reveals a $40.11B (2025) industry with a 3.03% CAGR, driven by tourism, infrastructure improvements, and a growing middle class. Learn about key players, market segments (commercial, military, general aviation), and regional growth projections for 2025-2033.

                                                              July 2025
                                                              Base Year: 2024
                                                              No Of Pages: 234
                                                              Price: $4750

                                                              Europe Aircraft Lighting Market Market’s Technological Evolution: Trends and Analysis 2025-2033

                                                              The European Aircraft Lighting Market is booming, projected to reach €324.57 million by 2033, driven by LED technology adoption and stringent safety regulations. Discover key trends, growth drivers, and leading companies shaping this dynamic sector.

                                                              July 2025
                                                              Base Year: 2024
                                                              No Of Pages: 234
                                                              Price: $4750
                                                              • Home
                                                              • About Us
                                                              • Industries
                                                                • Aerospace & Defense
                                                                • Agriculture
                                                                • Animal Nutrition & Wellness
                                                                • Automotive
                                                                • Chemicals & Materials
                                                                • Consumer Goods and Services
                                                                • Energy & Power
                                                                • Financial Services and Investment Intelligence
                                                                • Food & Beverage
                                                                • Home and Property Improvement
                                                                • Hospitality and Tourism
                                                                • Logistics
                                                                • Manufacturing Products and Services
                                                                • Packaging
                                                                • Professional and Commercial Services
                                                                • Real Estate and Construction
                                                                • Retail
                                                                • Technology, Media and Telecom
                                                                • Healthcare
                                                              • Services
                                                              • Contact
                                                              Main Logo
                                                              • Home
                                                              • About Us
                                                              • Industries
                                                                • Aerospace & Defense
                                                                • Agriculture
                                                                • Animal Nutrition & Wellness
                                                                • Automotive
                                                                • Chemicals & Materials
                                                                • Consumer Goods and Services
                                                                • Energy & Power
                                                                • Financial Services and Investment Intelligence
                                                                • Food & Beverage
                                                                • Home and Property Improvement
                                                                • Hospitality and Tourism
                                                                • Logistics
                                                                • Manufacturing Products and Services
                                                                • Packaging
                                                                • Professional and Commercial Services
                                                                • Real Estate and Construction
                                                                • Retail
                                                                • Technology, Media and Telecom
                                                                • Healthcare
                                                              • Services
                                                              • Contact
                                                              +17162654855
                                                              [email protected]

                                                              +17162654855

                                                              [email protected]

                                                              Business Address

                                                              Head Office

                                                              Office no. A 5010, fifth floor, Solitaire Business Hub, Near Phoenix mall, Pune, Maharashtra 411014

                                                              Contact Information

                                                              Craig Francis

                                                              Business Development Head

                                                              +17162654855

                                                              [email protected]

                                                              Connect With Us

                                                              Secure Payment Partners

                                                              payment image
                                                              RetailLogisticsPackagingAutomotiveHealthcareAgricultureEnergy & PowerFood & BeverageAerospace & DefenseChemicals & MaterialsHospitality and TourismAnimal Nutrition & WellnessConsumer Goods and ServicesReal Estate and ConstructionHome and Property ImprovementTechnology, Media and TelecomManufacturing Products and ServicesFinancial Services and Investment Intelligence

                                                              © 2025 All rights reserved


                                                              Privacy Policy
                                                              Terms and Conditions
                                                              FAQ