
Key Insights
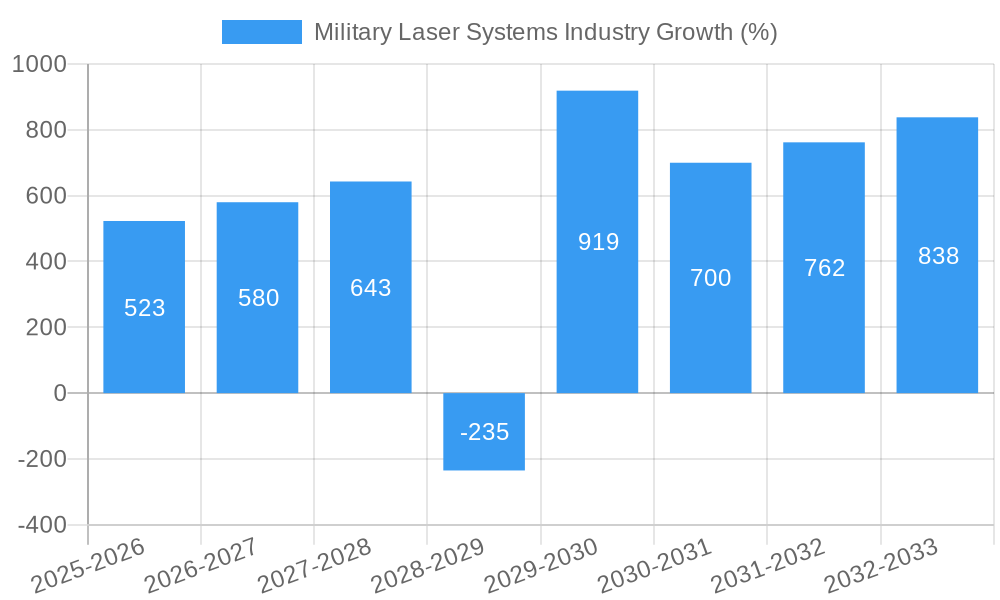
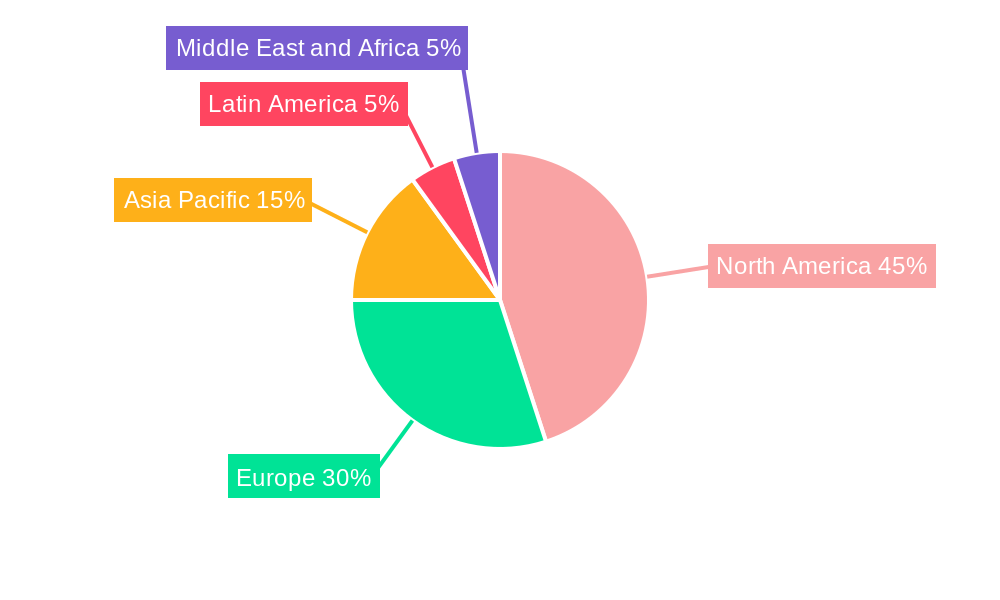
The Military Laser Systems market, valued at $5.57 billion in 2025, is projected to experience robust growth, driven by escalating defense budgets globally and increasing demand for advanced laser-based weaponry and guidance systems. The market's Compound Annual Growth Rate (CAGR) of 9.09% from 2025 to 2033 reflects a significant expansion fueled by technological advancements in solid-state lasers, offering improved efficiency and power compared to traditional gas lasers. Key applications like directed energy weapons (DEWs), laser rangefinders, and targeting systems are experiencing substantial growth, propelled by their precision, speed, and cost-effectiveness compared to conventional systems. North America and Europe currently dominate the market, due to substantial investment in military technology and research & development. However, the Asia-Pacific region is expected to demonstrate significant growth in the coming years, fueled by rising defense spending and the modernization of military capabilities in countries like China and India. While challenges exist, such as the high initial cost of laser systems and technological limitations in certain applications, ongoing research and development initiatives are actively addressing these issues, paving the way for broader adoption across various military platforms.
The segmentation of the Military Laser Systems market reveals a dynamic landscape. Solid-state lasers are rapidly gaining traction due to their superior performance and reliability, while gas lasers continue to hold a significant share in legacy systems. In terms of applications, the demand for directed energy weapons is increasing rapidly, driven by their potential to neutralize threats at long ranges with minimal collateral damage. Guidance systems, laser sights, and designators remain vital components in modern military operations, contributing substantially to the market's overall growth. Leading companies like Thales, Lockheed Martin, and Raytheon are actively investing in R&D and strategic partnerships to maintain their competitive edge, while smaller specialized companies are also contributing significantly through innovation in specific niche technologies. The continued development of high-energy laser systems, along with the integration of artificial intelligence and advanced sensor technologies, is poised to further revolutionize military operations and significantly expand the market's potential in the coming decade.

Military Laser Systems Industry: A Comprehensive Market Report (2019-2033)
This in-depth report provides a comprehensive analysis of the Military Laser Systems industry, encompassing market size, growth projections, competitive landscape, technological advancements, and key industry trends from 2019 to 2033. The report leverages extensive primary and secondary research to deliver actionable insights for stakeholders across the defense and technology sectors. With a focus on key players like Thales, Lockheed Martin, and RTX Corporation, this report is essential for strategic decision-making and investment planning. The study period covers 2019-2033, with 2025 as the base and estimated year. The forecast period spans 2025-2033, and the historical period covers 2019-2024. The total market value in 2025 is estimated at $XX Million.
Military Laser Systems Industry Market Structure & Competitive Dynamics
The Military Laser Systems market is characterized by a moderately concentrated structure, with a few major players like THALES, Leidos Inc, Rheinmetall AG, Elbit Systems Ltd, Lockheed Martin Corporation, MBDA, IAI, Rafael Advanced Defense Systems Ltd, RTX Corporation, BAE Systems plc, Northrop Grumman Corporation, and The Boeing Company holding significant market share. Market concentration is influenced by factors such as technological expertise, research and development capabilities, and established relationships with defense agencies. The industry is witnessing increased innovation, driven by the development of advanced solid-state lasers and directed energy weapons. Stringent regulatory frameworks govern the development and deployment of military laser systems, particularly concerning safety and international regulations. Product substitutes, such as conventional weapons systems, continue to compete with laser-based solutions. However, the advantages of precision, speed, and cost-effectiveness associated with laser systems are steadily increasing their market adoption. End-user trends are shifting towards more sophisticated and integrated systems with enhanced capabilities. The industry has experienced significant M&A activity in recent years, with deals valued at $XX Million in 2024 alone, reflecting consolidation and expansion strategies among major players.
- Market Share (2024): Lockheed Martin: 15%, RTX Corporation: 12%, Thales: 10%, Others: 63% (Approximate values due to limited publicly available data)
- M&A Deal Values (2019-2024): Total estimated value: $XX Million (Including both disclosed and undisclosed deals)
Military Laser Systems Industry Industry Trends & Insights
The Military Laser Systems market is experiencing robust growth, driven by increasing defense budgets globally and the growing demand for advanced weaponry. The Compound Annual Growth Rate (CAGR) for the forecast period (2025-2033) is projected to be XX%. This growth is fueled by several key factors: the continuous advancement of laser technology, particularly in solid-state lasers; rising adoption of directed energy weapons (DEWs) as a potential game-changer in warfare; increased focus on precision-guided munitions and enhanced targeting capabilities; and growing geopolitical tensions and military modernization efforts worldwide. Technological disruptions, such as the miniaturization and increased power efficiency of laser systems, are revolutionizing the capabilities of military platforms. Consumer preferences are shifting towards laser systems offering improved accuracy, reduced collateral damage, and enhanced operational effectiveness. Competitive dynamics are intensifying, leading to innovation and the development of increasingly sophisticated laser weapons and related technologies. Market penetration of laser-guided systems in various military applications is steadily increasing, with projected penetration rates reaching XX% by 2033.
Dominant Markets & Segments in Military Laser Systems Industry
The North American region currently dominates the Military Laser Systems market, driven by substantial defense spending and technological leadership. The US remains a key market due to its significant investment in directed energy weapons research and development.
Key Drivers for North American Dominance:
- High defense budget allocation
- Robust technological infrastructure and expertise
- Favorable government policies promoting innovation in the defense sector
- Strong presence of major industry players
Dominant Segments:
- Technology: Solid-state lasers are rapidly gaining traction due to their superior efficiency, compactness, and scalability compared to gas lasers. The segment is expected to witness a CAGR of XX% during the forecast period.
- Application: Directed Energy Weapons (DEWs) represent the fastest-growing application segment, driven by the desire for high-precision, long-range engagement capabilities. The sector's market size is projected to reach $XX Million by 2033. Guidance systems incorporating laser technology are also seeing significant growth.
Military Laser Systems Industry Product Innovations
Recent product developments focus on the miniaturization of laser systems for integration into smaller platforms, including unmanned aerial vehicles (UAVs) and ground vehicles. Advances in beam control and power scaling are enhancing the effectiveness and range of laser weapons. The development of high-energy solid-state lasers offers significant advantages in terms of efficiency and portability compared to traditional gas lasers. These innovations are improving the market fit by delivering more compact, efficient, and adaptable solutions for a range of military applications.
Report Segmentation & Scope
The report segments the Military Laser Systems market based on technology (Solid State Lasers, Gas Lasers, Others) and application (Directed Energy Weapons, Guidance Systems, Laser Sights, Designators and Rangefinders, Others). Each segment is analyzed based on its market size, growth projections, and competitive dynamics. Growth projections are provided for each segment based on forecast data. The competitive landscape within each segment is analyzed, highlighting key players and their market strategies. Market size estimates are presented for each segment for the historical period (2019-2024) and the forecast period (2025-2033).
Key Drivers of Military Laser Systems Industry Growth
The growth of the Military Laser Systems industry is driven by several factors: increasing defense spending, technological advancements leading to higher power and efficiency lasers, a growing demand for precision-guided munitions, and the potential for cost-effective solutions compared to traditional weapon systems. Government initiatives supporting research and development, coupled with the need for enhanced situational awareness and threat neutralization, further drive market growth. The development of more compact and efficient laser systems suitable for integration into smaller platforms is another significant growth driver.
Challenges in the Military Laser Systems Industry Sector
The Military Laser Systems industry faces challenges such as high research and development costs, complex regulatory hurdles for weapon systems, and potential supply chain disruptions affecting the availability of critical components. The need for robust testing and validation procedures, along with countermeasures developed to mitigate the effectiveness of laser systems, pose further constraints. The competitive landscape, with established players and emerging entrants, creates intense pressure on pricing and innovation. These factors can collectively impact market growth and profitability.
Leading Players in the Military Laser Systems Industry Market
- THALES
- Leidos Inc
- Rheinmetall AG
- Elbit Systems Ltd
- Lockheed Martin Corporation
- MBDA
- IAI
- Rafael Advanced Defense Systems Ltd
- RTX Corporation
- BAE Systems plc
- Northrop Grumman Corporation
- The Boeing Company
Key Developments in Military Laser Systems Industry Sector
- June 2023: RTX Corporation delivered the fourth combat-ready laser weapon to the US Air Force. This 10 KW laser, built to US military specifications in a standalone configuration, represents a significant advancement in deployable laser weapon technology.
- April 2023: The US Department of Defense (DoD) awarded NUBURU Inc. a contract for the development of solid-state high-energy laser (HEL) weapon systems, highlighting the growing importance of solid-state laser technology.
- March 2023: Blighter Surveillance Systems secured a contract to supply Raytheon UK with radar systems for a laser weapon project with the UK MoD, indicating increased collaborative efforts in the development and deployment of laser weapon systems.
Strategic Military Laser Systems Industry Market Outlook
The future of the Military Laser Systems market is promising. Continuous technological advancements, increasing defense budgets, and the growing need for precision-guided weaponry will drive significant growth in the coming years. Strategic opportunities exist for companies focusing on the development of high-energy, compact laser systems, integrating these systems into smaller platforms, and advancing beam control and power scaling technologies. The market will continue to see increased consolidation and collaboration amongst key players. This is expected to lead to the emergence of increasingly sophisticated and effective military laser systems that reshape modern warfare.
Military Laser Systems Industry Segmentation
-
1. Technology
- 1.1. Solid-state Lasers
- 1.2. Gas Lasers
- 1.3. Other Technologies
-
2. Application
- 2.1. Directed Energy Weapons
- 2.2. Guidance Systems
- 2.3. Laser Sights, Designators, and Rangefinders
- 2.4. Other Applications
Military Laser Systems Industry Segmentation By Geography
-
1. North America
- 1.1. United States
- 1.2. Canada
-
2. Europe
- 2.1. United Kingdom
- 2.2. Germany
- 2.3. France
- 2.4. Italy
- 2.5. Russia
- 2.6. Rest of Europe
-
3. Asia Pacific
- 3.1. China
- 3.2. India
- 3.3. Japan
- 3.4. South Korea
- 3.5. Rest of Asia Pacific
-
4. Latin America
- 4.1. Brazil
- 4.2. Rest of Latin America
-
5. Middle East and Africa
- 5.1. United Arab Emirates
- 5.2. Saudi Arabia
- 5.3. Israel
- 5.4. Rest of Middle East and Africa
Military Laser Systems Industry REPORT HIGHLIGHTS
| Aspects | Details |
|---|---|
| Study Period | 2019-2033 |
| Base Year | 2024 |
| Estimated Year | 2025 |
| Forecast Period | 2025-2033 |
| Historical Period | 2019-2024 |
| Growth Rate | CAGR of 9.09% from 2019-2033 |
| Segmentation |
|
Table of Contents
- 1. Introduction
- 1.1. Research Scope
- 1.2. Market Segmentation
- 1.3. Research Methodology
- 1.4. Definitions and Assumptions
- 2. Executive Summary
- 2.1. Introduction
- 3. Market Dynamics
- 3.1. Introduction
- 3.2. Market Drivers
- 3.2.1. Increase in Internet of Things (IoT) and Autonomous Systems; Rise in Demand for Military and Defense Satellite Communication Solutions
- 3.3. Market Restrains
- 3.3.1. Cybersecurity Threats to Satellite Communication; Interference in Transmission of Data
- 3.4. Market Trends
- 3.4.1. Directed Energy Weapons Segment Projected to Exhibit the Highest CAGR During the Forecast Period
- 4. Market Factor Analysis
- 4.1. Porters Five Forces
- 4.2. Supply/Value Chain
- 4.3. PESTEL analysis
- 4.4. Market Entropy
- 4.5. Patent/Trademark Analysis
- 5. Global Military Laser Systems Industry Analysis, Insights and Forecast, 2019-2031
- 5.1. Market Analysis, Insights and Forecast - by Technology
- 5.1.1. Solid-state Lasers
- 5.1.2. Gas Lasers
- 5.1.3. Other Technologies
- 5.2. Market Analysis, Insights and Forecast - by Application
- 5.2.1. Directed Energy Weapons
- 5.2.2. Guidance Systems
- 5.2.3. Laser Sights, Designators, and Rangefinders
- 5.2.4. Other Applications
- 5.3. Market Analysis, Insights and Forecast - by Region
- 5.3.1. North America
- 5.3.2. Europe
- 5.3.3. Asia Pacific
- 5.3.4. Latin America
- 5.3.5. Middle East and Africa
- 5.1. Market Analysis, Insights and Forecast - by Technology
- 6. North America Military Laser Systems Industry Analysis, Insights and Forecast, 2019-2031
- 6.1. Market Analysis, Insights and Forecast - by Technology
- 6.1.1. Solid-state Lasers
- 6.1.2. Gas Lasers
- 6.1.3. Other Technologies
- 6.2. Market Analysis, Insights and Forecast - by Application
- 6.2.1. Directed Energy Weapons
- 6.2.2. Guidance Systems
- 6.2.3. Laser Sights, Designators, and Rangefinders
- 6.2.4. Other Applications
- 6.1. Market Analysis, Insights and Forecast - by Technology
- 7. Europe Military Laser Systems Industry Analysis, Insights and Forecast, 2019-2031
- 7.1. Market Analysis, Insights and Forecast - by Technology
- 7.1.1. Solid-state Lasers
- 7.1.2. Gas Lasers
- 7.1.3. Other Technologies
- 7.2. Market Analysis, Insights and Forecast - by Application
- 7.2.1. Directed Energy Weapons
- 7.2.2. Guidance Systems
- 7.2.3. Laser Sights, Designators, and Rangefinders
- 7.2.4. Other Applications
- 7.1. Market Analysis, Insights and Forecast - by Technology
- 8. Asia Pacific Military Laser Systems Industry Analysis, Insights and Forecast, 2019-2031
- 8.1. Market Analysis, Insights and Forecast - by Technology
- 8.1.1. Solid-state Lasers
- 8.1.2. Gas Lasers
- 8.1.3. Other Technologies
- 8.2. Market Analysis, Insights and Forecast - by Application
- 8.2.1. Directed Energy Weapons
- 8.2.2. Guidance Systems
- 8.2.3. Laser Sights, Designators, and Rangefinders
- 8.2.4. Other Applications
- 8.1. Market Analysis, Insights and Forecast - by Technology
- 9. Latin America Military Laser Systems Industry Analysis, Insights and Forecast, 2019-2031
- 9.1. Market Analysis, Insights and Forecast - by Technology
- 9.1.1. Solid-state Lasers
- 9.1.2. Gas Lasers
- 9.1.3. Other Technologies
- 9.2. Market Analysis, Insights and Forecast - by Application
- 9.2.1. Directed Energy Weapons
- 9.2.2. Guidance Systems
- 9.2.3. Laser Sights, Designators, and Rangefinders
- 9.2.4. Other Applications
- 9.1. Market Analysis, Insights and Forecast - by Technology
- 10. Middle East and Africa Military Laser Systems Industry Analysis, Insights and Forecast, 2019-2031
- 10.1. Market Analysis, Insights and Forecast - by Technology
- 10.1.1. Solid-state Lasers
- 10.1.2. Gas Lasers
- 10.1.3. Other Technologies
- 10.2. Market Analysis, Insights and Forecast - by Application
- 10.2.1. Directed Energy Weapons
- 10.2.2. Guidance Systems
- 10.2.3. Laser Sights, Designators, and Rangefinders
- 10.2.4. Other Applications
- 10.1. Market Analysis, Insights and Forecast - by Technology
- 11. North America Military Laser Systems Industry Analysis, Insights and Forecast, 2019-2031
- 11.1. Market Analysis, Insights and Forecast - By Country/Sub-region
- 11.1.1 United States
- 11.1.2 Canada
- 12. Europe Military Laser Systems Industry Analysis, Insights and Forecast, 2019-2031
- 12.1. Market Analysis, Insights and Forecast - By Country/Sub-region
- 12.1.1 United Kingdom
- 12.1.2 Germany
- 12.1.3 France
- 12.1.4 Italy
- 12.1.5 Russia
- 12.1.6 Rest of Europe
- 13. Asia Pacific Military Laser Systems Industry Analysis, Insights and Forecast, 2019-2031
- 13.1. Market Analysis, Insights and Forecast - By Country/Sub-region
- 13.1.1 China
- 13.1.2 India
- 13.1.3 Japan
- 13.1.4 South Korea
- 13.1.5 Rest of Asia Pacific
- 14. Latin America Military Laser Systems Industry Analysis, Insights and Forecast, 2019-2031
- 14.1. Market Analysis, Insights and Forecast - By Country/Sub-region
- 14.1.1 Brazil
- 14.1.2 Rest of Latin America
- 15. Middle East and Africa Military Laser Systems Industry Analysis, Insights and Forecast, 2019-2031
- 15.1. Market Analysis, Insights and Forecast - By Country/Sub-region
- 15.1.1 United Arab Emirates
- 15.1.2 Saudi Arabia
- 15.1.3 Israel
- 15.1.4 Rest of Middle East and Africa
- 16. Competitive Analysis
- 16.1. Global Market Share Analysis 2024
- 16.2. Company Profiles
- 16.2.1 THALES
- 16.2.1.1. Overview
- 16.2.1.2. Products
- 16.2.1.3. SWOT Analysis
- 16.2.1.4. Recent Developments
- 16.2.1.5. Financials (Based on Availability)
- 16.2.2 Leidos Inc
- 16.2.2.1. Overview
- 16.2.2.2. Products
- 16.2.2.3. SWOT Analysis
- 16.2.2.4. Recent Developments
- 16.2.2.5. Financials (Based on Availability)
- 16.2.3 Rheinmetall AG
- 16.2.3.1. Overview
- 16.2.3.2. Products
- 16.2.3.3. SWOT Analysis
- 16.2.3.4. Recent Developments
- 16.2.3.5. Financials (Based on Availability)
- 16.2.4 Elbit Systems Ltd
- 16.2.4.1. Overview
- 16.2.4.2. Products
- 16.2.4.3. SWOT Analysis
- 16.2.4.4. Recent Developments
- 16.2.4.5. Financials (Based on Availability)
- 16.2.5 Lockheed Martin Corporation
- 16.2.5.1. Overview
- 16.2.5.2. Products
- 16.2.5.3. SWOT Analysis
- 16.2.5.4. Recent Developments
- 16.2.5.5. Financials (Based on Availability)
- 16.2.6 MBDA
- 16.2.6.1. Overview
- 16.2.6.2. Products
- 16.2.6.3. SWOT Analysis
- 16.2.6.4. Recent Developments
- 16.2.6.5. Financials (Based on Availability)
- 16.2.7 IAI
- 16.2.7.1. Overview
- 16.2.7.2. Products
- 16.2.7.3. SWOT Analysis
- 16.2.7.4. Recent Developments
- 16.2.7.5. Financials (Based on Availability)
- 16.2.8 Rafael Advanced Defense Systems Ltd
- 16.2.8.1. Overview
- 16.2.8.2. Products
- 16.2.8.3. SWOT Analysis
- 16.2.8.4. Recent Developments
- 16.2.8.5. Financials (Based on Availability)
- 16.2.9 RTX Corporation
- 16.2.9.1. Overview
- 16.2.9.2. Products
- 16.2.9.3. SWOT Analysis
- 16.2.9.4. Recent Developments
- 16.2.9.5. Financials (Based on Availability)
- 16.2.10 BAE Systems plc
- 16.2.10.1. Overview
- 16.2.10.2. Products
- 16.2.10.3. SWOT Analysis
- 16.2.10.4. Recent Developments
- 16.2.10.5. Financials (Based on Availability)
- 16.2.11 Northrop Grumman Corporation
- 16.2.11.1. Overview
- 16.2.11.2. Products
- 16.2.11.3. SWOT Analysis
- 16.2.11.4. Recent Developments
- 16.2.11.5. Financials (Based on Availability)
- 16.2.12 The Boeing Company
- 16.2.12.1. Overview
- 16.2.12.2. Products
- 16.2.12.3. SWOT Analysis
- 16.2.12.4. Recent Developments
- 16.2.12.5. Financials (Based on Availability)
- 16.2.1 THALES
List of Figures
- Figure 1: Global Military Laser Systems Industry Revenue Breakdown (Million, %) by Region 2024 & 2032
- Figure 2: North America Military Laser Systems Industry Revenue (Million), by Country 2024 & 2032
- Figure 3: North America Military Laser Systems Industry Revenue Share (%), by Country 2024 & 2032
- Figure 4: Europe Military Laser Systems Industry Revenue (Million), by Country 2024 & 2032
- Figure 5: Europe Military Laser Systems Industry Revenue Share (%), by Country 2024 & 2032
- Figure 6: Asia Pacific Military Laser Systems Industry Revenue (Million), by Country 2024 & 2032
- Figure 7: Asia Pacific Military Laser Systems Industry Revenue Share (%), by Country 2024 & 2032
- Figure 8: Latin America Military Laser Systems Industry Revenue (Million), by Country 2024 & 2032
- Figure 9: Latin America Military Laser Systems Industry Revenue Share (%), by Country 2024 & 2032
- Figure 10: Middle East and Africa Military Laser Systems Industry Revenue (Million), by Country 2024 & 2032
- Figure 11: Middle East and Africa Military Laser Systems Industry Revenue Share (%), by Country 2024 & 2032
- Figure 12: North America Military Laser Systems Industry Revenue (Million), by Technology 2024 & 2032
- Figure 13: North America Military Laser Systems Industry Revenue Share (%), by Technology 2024 & 2032
- Figure 14: North America Military Laser Systems Industry Revenue (Million), by Application 2024 & 2032
- Figure 15: North America Military Laser Systems Industry Revenue Share (%), by Application 2024 & 2032
- Figure 16: North America Military Laser Systems Industry Revenue (Million), by Country 2024 & 2032
- Figure 17: North America Military Laser Systems Industry Revenue Share (%), by Country 2024 & 2032
- Figure 18: Europe Military Laser Systems Industry Revenue (Million), by Technology 2024 & 2032
- Figure 19: Europe Military Laser Systems Industry Revenue Share (%), by Technology 2024 & 2032
- Figure 20: Europe Military Laser Systems Industry Revenue (Million), by Application 2024 & 2032
- Figure 21: Europe Military Laser Systems Industry Revenue Share (%), by Application 2024 & 2032
- Figure 22: Europe Military Laser Systems Industry Revenue (Million), by Country 2024 & 2032
- Figure 23: Europe Military Laser Systems Industry Revenue Share (%), by Country 2024 & 2032
- Figure 24: Asia Pacific Military Laser Systems Industry Revenue (Million), by Technology 2024 & 2032
- Figure 25: Asia Pacific Military Laser Systems Industry Revenue Share (%), by Technology 2024 & 2032
- Figure 26: Asia Pacific Military Laser Systems Industry Revenue (Million), by Application 2024 & 2032
- Figure 27: Asia Pacific Military Laser Systems Industry Revenue Share (%), by Application 2024 & 2032
- Figure 28: Asia Pacific Military Laser Systems Industry Revenue (Million), by Country 2024 & 2032
- Figure 29: Asia Pacific Military Laser Systems Industry Revenue Share (%), by Country 2024 & 2032
- Figure 30: Latin America Military Laser Systems Industry Revenue (Million), by Technology 2024 & 2032
- Figure 31: Latin America Military Laser Systems Industry Revenue Share (%), by Technology 2024 & 2032
- Figure 32: Latin America Military Laser Systems Industry Revenue (Million), by Application 2024 & 2032
- Figure 33: Latin America Military Laser Systems Industry Revenue Share (%), by Application 2024 & 2032
- Figure 34: Latin America Military Laser Systems Industry Revenue (Million), by Country 2024 & 2032
- Figure 35: Latin America Military Laser Systems Industry Revenue Share (%), by Country 2024 & 2032
- Figure 36: Middle East and Africa Military Laser Systems Industry Revenue (Million), by Technology 2024 & 2032
- Figure 37: Middle East and Africa Military Laser Systems Industry Revenue Share (%), by Technology 2024 & 2032
- Figure 38: Middle East and Africa Military Laser Systems Industry Revenue (Million), by Application 2024 & 2032
- Figure 39: Middle East and Africa Military Laser Systems Industry Revenue Share (%), by Application 2024 & 2032
- Figure 40: Middle East and Africa Military Laser Systems Industry Revenue (Million), by Country 2024 & 2032
- Figure 41: Middle East and Africa Military Laser Systems Industry Revenue Share (%), by Country 2024 & 2032
List of Tables
- Table 1: Global Military Laser Systems Industry Revenue Million Forecast, by Region 2019 & 2032
- Table 2: Global Military Laser Systems Industry Revenue Million Forecast, by Technology 2019 & 2032
- Table 3: Global Military Laser Systems Industry Revenue Million Forecast, by Application 2019 & 2032
- Table 4: Global Military Laser Systems Industry Revenue Million Forecast, by Region 2019 & 2032
- Table 5: Global Military Laser Systems Industry Revenue Million Forecast, by Country 2019 & 2032
- Table 6: United States Military Laser Systems Industry Revenue (Million) Forecast, by Application 2019 & 2032
- Table 7: Canada Military Laser Systems Industry Revenue (Million) Forecast, by Application 2019 & 2032
- Table 8: Global Military Laser Systems Industry Revenue Million Forecast, by Country 2019 & 2032
- Table 9: United Kingdom Military Laser Systems Industry Revenue (Million) Forecast, by Application 2019 & 2032
- Table 10: Germany Military Laser Systems Industry Revenue (Million) Forecast, by Application 2019 & 2032
- Table 11: France Military Laser Systems Industry Revenue (Million) Forecast, by Application 2019 & 2032
- Table 12: Italy Military Laser Systems Industry Revenue (Million) Forecast, by Application 2019 & 2032
- Table 13: Russia Military Laser Systems Industry Revenue (Million) Forecast, by Application 2019 & 2032
- Table 14: Rest of Europe Military Laser Systems Industry Revenue (Million) Forecast, by Application 2019 & 2032
- Table 15: Global Military Laser Systems Industry Revenue Million Forecast, by Country 2019 & 2032
- Table 16: China Military Laser Systems Industry Revenue (Million) Forecast, by Application 2019 & 2032
- Table 17: India Military Laser Systems Industry Revenue (Million) Forecast, by Application 2019 & 2032
- Table 18: Japan Military Laser Systems Industry Revenue (Million) Forecast, by Application 2019 & 2032
- Table 19: South Korea Military Laser Systems Industry Revenue (Million) Forecast, by Application 2019 & 2032
- Table 20: Rest of Asia Pacific Military Laser Systems Industry Revenue (Million) Forecast, by Application 2019 & 2032
- Table 21: Global Military Laser Systems Industry Revenue Million Forecast, by Country 2019 & 2032
- Table 22: Brazil Military Laser Systems Industry Revenue (Million) Forecast, by Application 2019 & 2032
- Table 23: Rest of Latin America Military Laser Systems Industry Revenue (Million) Forecast, by Application 2019 & 2032
- Table 24: Global Military Laser Systems Industry Revenue Million Forecast, by Country 2019 & 2032
- Table 25: United Arab Emirates Military Laser Systems Industry Revenue (Million) Forecast, by Application 2019 & 2032
- Table 26: Saudi Arabia Military Laser Systems Industry Revenue (Million) Forecast, by Application 2019 & 2032
- Table 27: Israel Military Laser Systems Industry Revenue (Million) Forecast, by Application 2019 & 2032
- Table 28: Rest of Middle East and Africa Military Laser Systems Industry Revenue (Million) Forecast, by Application 2019 & 2032
- Table 29: Global Military Laser Systems Industry Revenue Million Forecast, by Technology 2019 & 2032
- Table 30: Global Military Laser Systems Industry Revenue Million Forecast, by Application 2019 & 2032
- Table 31: Global Military Laser Systems Industry Revenue Million Forecast, by Country 2019 & 2032
- Table 32: United States Military Laser Systems Industry Revenue (Million) Forecast, by Application 2019 & 2032
- Table 33: Canada Military Laser Systems Industry Revenue (Million) Forecast, by Application 2019 & 2032
- Table 34: Global Military Laser Systems Industry Revenue Million Forecast, by Technology 2019 & 2032
- Table 35: Global Military Laser Systems Industry Revenue Million Forecast, by Application 2019 & 2032
- Table 36: Global Military Laser Systems Industry Revenue Million Forecast, by Country 2019 & 2032
- Table 37: United Kingdom Military Laser Systems Industry Revenue (Million) Forecast, by Application 2019 & 2032
- Table 38: Germany Military Laser Systems Industry Revenue (Million) Forecast, by Application 2019 & 2032
- Table 39: France Military Laser Systems Industry Revenue (Million) Forecast, by Application 2019 & 2032
- Table 40: Italy Military Laser Systems Industry Revenue (Million) Forecast, by Application 2019 & 2032
- Table 41: Russia Military Laser Systems Industry Revenue (Million) Forecast, by Application 2019 & 2032
- Table 42: Rest of Europe Military Laser Systems Industry Revenue (Million) Forecast, by Application 2019 & 2032
- Table 43: Global Military Laser Systems Industry Revenue Million Forecast, by Technology 2019 & 2032
- Table 44: Global Military Laser Systems Industry Revenue Million Forecast, by Application 2019 & 2032
- Table 45: Global Military Laser Systems Industry Revenue Million Forecast, by Country 2019 & 2032
- Table 46: China Military Laser Systems Industry Revenue (Million) Forecast, by Application 2019 & 2032
- Table 47: India Military Laser Systems Industry Revenue (Million) Forecast, by Application 2019 & 2032
- Table 48: Japan Military Laser Systems Industry Revenue (Million) Forecast, by Application 2019 & 2032
- Table 49: South Korea Military Laser Systems Industry Revenue (Million) Forecast, by Application 2019 & 2032
- Table 50: Rest of Asia Pacific Military Laser Systems Industry Revenue (Million) Forecast, by Application 2019 & 2032
- Table 51: Global Military Laser Systems Industry Revenue Million Forecast, by Technology 2019 & 2032
- Table 52: Global Military Laser Systems Industry Revenue Million Forecast, by Application 2019 & 2032
- Table 53: Global Military Laser Systems Industry Revenue Million Forecast, by Country 2019 & 2032
- Table 54: Brazil Military Laser Systems Industry Revenue (Million) Forecast, by Application 2019 & 2032
- Table 55: Rest of Latin America Military Laser Systems Industry Revenue (Million) Forecast, by Application 2019 & 2032
- Table 56: Global Military Laser Systems Industry Revenue Million Forecast, by Technology 2019 & 2032
- Table 57: Global Military Laser Systems Industry Revenue Million Forecast, by Application 2019 & 2032
- Table 58: Global Military Laser Systems Industry Revenue Million Forecast, by Country 2019 & 2032
- Table 59: United Arab Emirates Military Laser Systems Industry Revenue (Million) Forecast, by Application 2019 & 2032
- Table 60: Saudi Arabia Military Laser Systems Industry Revenue (Million) Forecast, by Application 2019 & 2032
- Table 61: Israel Military Laser Systems Industry Revenue (Million) Forecast, by Application 2019 & 2032
- Table 62: Rest of Middle East and Africa Military Laser Systems Industry Revenue (Million) Forecast, by Application 2019 & 2032
Frequently Asked Questions
1. What is the projected Compound Annual Growth Rate (CAGR) of the Military Laser Systems Industry?
The projected CAGR is approximately 9.09%.
2. Which companies are prominent players in the Military Laser Systems Industry?
Key companies in the market include THALES, Leidos Inc, Rheinmetall AG, Elbit Systems Ltd, Lockheed Martin Corporation, MBDA, IAI, Rafael Advanced Defense Systems Ltd, RTX Corporation, BAE Systems plc, Northrop Grumman Corporation, The Boeing Company.
3. What are the main segments of the Military Laser Systems Industry?
The market segments include Technology, Application.
4. Can you provide details about the market size?
The market size is estimated to be USD 5.57 Million as of 2022.
5. What are some drivers contributing to market growth?
Increase in Internet of Things (IoT) and Autonomous Systems; Rise in Demand for Military and Defense Satellite Communication Solutions.
6. What are the notable trends driving market growth?
Directed Energy Weapons Segment Projected to Exhibit the Highest CAGR During the Forecast Period.
7. Are there any restraints impacting market growth?
Cybersecurity Threats to Satellite Communication; Interference in Transmission of Data.
8. Can you provide examples of recent developments in the market?
June 2023: RTX Corporation delivered the fourth combat-ready laser weapon to the US Air Force. The new palletized laser weapon was the first 10 KW laser built to US military specifications in a stand-alone configuration that can be moved and mounted anywhere it's needed.
9. What pricing options are available for accessing the report?
Pricing options include single-user, multi-user, and enterprise licenses priced at USD 4750, USD 5250, and USD 8750 respectively.
10. Is the market size provided in terms of value or volume?
The market size is provided in terms of value, measured in Million.
11. Are there any specific market keywords associated with the report?
Yes, the market keyword associated with the report is "Military Laser Systems Industry," which aids in identifying and referencing the specific market segment covered.
12. How do I determine which pricing option suits my needs best?
The pricing options vary based on user requirements and access needs. Individual users may opt for single-user licenses, while businesses requiring broader access may choose multi-user or enterprise licenses for cost-effective access to the report.
13. Are there any additional resources or data provided in the Military Laser Systems Industry report?
While the report offers comprehensive insights, it's advisable to review the specific contents or supplementary materials provided to ascertain if additional resources or data are available.
14. How can I stay updated on further developments or reports in the Military Laser Systems Industry?
To stay informed about further developments, trends, and reports in the Military Laser Systems Industry, consider subscribing to industry newsletters, following relevant companies and organizations, or regularly checking reputable industry news sources and publications.
Methodology
Step 1 - Identification of Relevant Samples Size from Population Database


Step 2 - Approaches for Defining Global Market Size (Value, Volume* & Price*)

Note*: In applicable scenarios
Step 3 - Data Sources
Primary Research
- Web Analytics
- Survey Reports
- Research Institute
- Latest Research Reports
- Opinion Leaders
Secondary Research
- Annual Reports
- White Paper
- Latest Press Release
- Industry Association
- Paid Database
- Investor Presentations

Step 4 - Data Triangulation
Involves using different sources of information in order to increase the validity of a study
These sources are likely to be stakeholders in a program - participants, other researchers, program staff, other community members, and so on.
Then we put all data in single framework & apply various statistical tools to find out the dynamic on the market.
During the analysis stage, feedback from the stakeholder groups would be compared to determine areas of agreement as well as areas of divergence


