
Key Insights
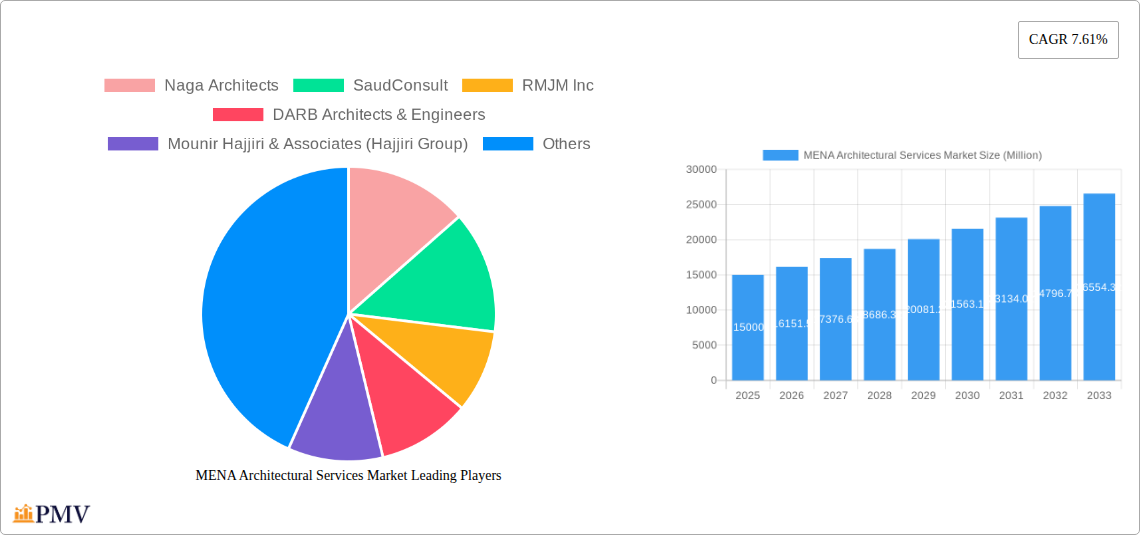
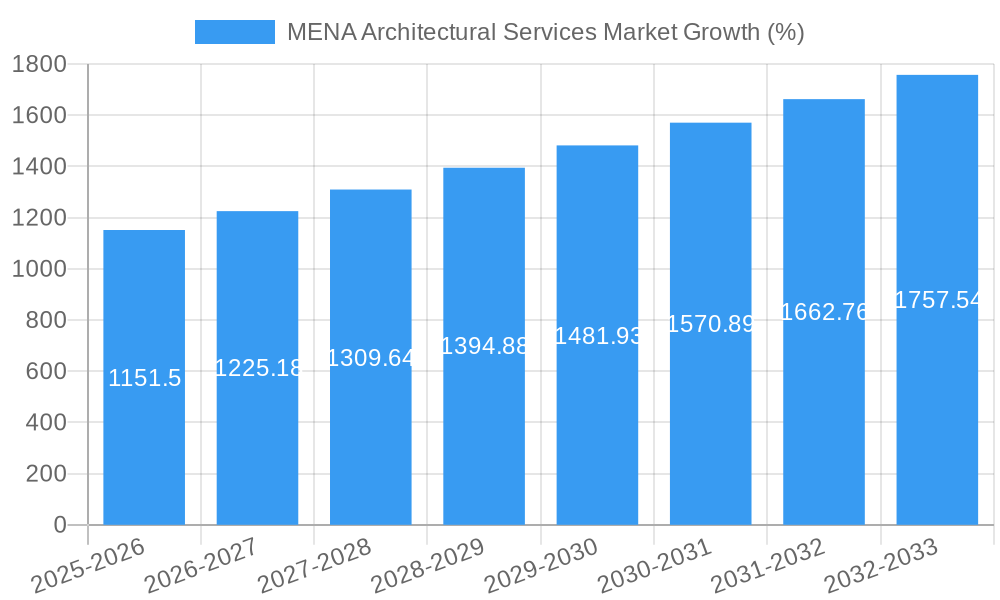
The MENA (Middle East and North Africa) Architectural Services market exhibits robust growth, driven by significant infrastructure development, burgeoning tourism, and a rising population demanding modern living spaces. The market, valued at an estimated $15 billion USD in 2025, is projected to experience a Compound Annual Growth Rate (CAGR) of 7.61% from 2025 to 2033. This growth is fueled by large-scale construction projects across various sectors, including commercial, residential, healthcare, and hospitality. The increasing adoption of sustainable design practices and technological advancements like Building Information Modeling (BIM) are further contributing factors. While economic fluctuations and potential material cost increases could pose challenges, the long-term outlook remains positive, underpinned by continued government investment in infrastructure and a strong focus on urban development throughout the region. The segment breakdown reveals a significant share for commercial and residential building types, while the service type segment is diversified across concept design, schematic design, design development, and construction documentation, indicative of a mature and comprehensive market landscape. Key players like AECOM, Omrania, and Dar Al-Handasah are leveraging their expertise and regional presence to capitalize on these opportunities.
The competitive landscape is characterized by both international and regional firms, each catering to specific niches and project scales. The market shows substantial potential for growth, particularly in countries undergoing rapid urbanization and economic expansion. However, navigating regulatory hurdles and ensuring skilled workforce availability will be critical for sustained growth. The increasing demand for specialized architectural services, such as sustainable and smart building design, presents opportunities for firms that can adapt and innovate. Regional variations in economic conditions and construction regulations will influence market dynamics within specific countries within the MENA region. Continued focus on building resilience and adaptation to climate change will also significantly shape future market trends. The overall trend suggests a positive trajectory for the MENA Architectural Services market over the next decade, promising lucrative prospects for established players and new entrants alike.
This in-depth report provides a comprehensive analysis of the MENA Architectural Services Market, covering market size, segmentation, growth drivers, challenges, competitive landscape, and future outlook. The study period spans from 2019 to 2033, with 2025 serving as the base and estimated year. The report offers invaluable insights for industry stakeholders, investors, and businesses seeking to understand and capitalize on the opportunities within this dynamic market.
MENA Architectural Services Market Market Structure & Competitive Dynamics
The MENA architectural services market exhibits a moderately concentrated structure, with a few large multinational firms and numerous smaller, local players competing for projects. Market share is largely influenced by firm reputation, project portfolio diversity, and ability to secure large-scale government contracts. The market is characterized by a dynamic innovation ecosystem, driven by technological advancements in building information modeling (BIM), sustainable design practices, and digital design tools. Regulatory frameworks, varying across different MENA countries, influence project approvals, licensing, and construction standards. Substitutes exist in the form of prefabricated construction and modular building systems, though traditional architectural services retain a dominant position. End-user trends towards sustainable and smart buildings are shaping demand, fostering innovation within the market. M&A activity is steadily increasing, as larger firms seek to expand their regional footprint and service capabilities. Recent M&A deal values have ranged from xx Million to xx Million, indicating a robust consolidation trend. For example, the acquisition of Omrania by Egis Group significantly alters the competitive landscape in Saudi Arabia.
- Market Concentration: Moderately concentrated, with a few dominant players.
- Innovation Ecosystems: Driven by BIM, sustainable design, and digital tools.
- Regulatory Frameworks: Varying across MENA countries, influencing project approvals.
- Product Substitutes: Prefabricated construction and modular buildings present limited competition.
- M&A Activity: Growing, with deals valued between xx Million and xx Million.
MENA Architectural Services Market Industry Trends & Insights
The MENA architectural services market is experiencing robust growth, driven by significant infrastructure development across the region, burgeoning urbanization, and increasing investments in both residential and commercial real estate. The Compound Annual Growth Rate (CAGR) from 2025 to 2033 is projected to be xx%, reflecting the ongoing expansion of the construction sector. Market penetration of sustainable design practices is gradually increasing, although adoption rates vary across different segments and countries. Consumer preferences are shifting towards environmentally friendly and technologically advanced buildings, prompting architectural firms to incorporate sustainable materials and smart technologies into their designs. The rise of proptech companies is influencing the way architectural services are procured and delivered, creating new competitive dynamics. Technological disruptions such as BIM and digital fabrication are enhancing design efficiency and construction accuracy.
Dominant Markets & Segments in MENA Architectural Services Market
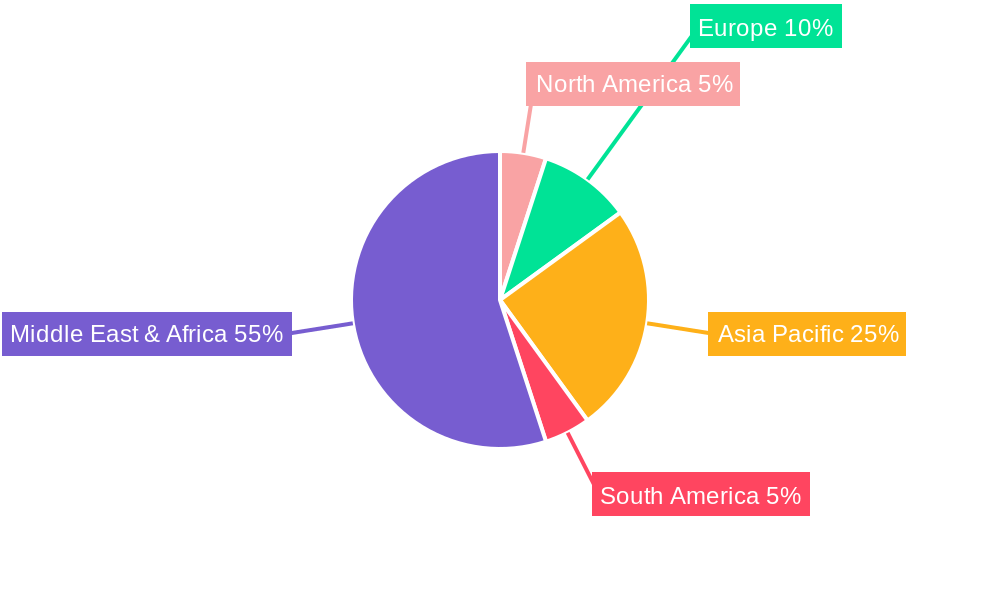
The Saudi Arabian architectural services market currently dominates the MENA region, driven by substantial government investments in infrastructure projects related to Vision 2030. The UAE also holds a significant market share, fueled by its thriving tourism and real estate sectors. Within the service type segment, Construction Documentation commands the largest market share due to its indispensable role in construction projects. Similarly, Commercial building projects are the largest segment by building type, followed by Residential.
Key Drivers for Saudi Arabia's Dominance:
- Massive infrastructure development plans (Vision 2030)
- Significant government spending on construction projects
- Robust growth in the real estate sector.
Key Drivers for UAE's Strong Position:
- Flourishing tourism and hospitality industry
- High demand for commercial and residential real estate
- Diversified economy.
Dominant Service Type: Construction Documentation.
Dominant Building Type: Commercial.
MENA Architectural Services Market Product Innovations
Recent innovations in the MENA architectural services market include a heightened focus on sustainable and resilient designs, incorporating green building materials, renewable energy technologies, and climate-responsive design strategies. The adoption of Building Information Modeling (BIM) is improving design accuracy and collaboration among stakeholders. Furthermore, advancements in digital fabrication technologies are streamlining the construction process and enabling the creation of complex building forms. These advancements enhance the efficiency, sustainability, and cost-effectiveness of projects, providing significant competitive advantages to firms adopting them. Henning Larsen's work with climate-resilient moss exemplifies this trend.
Report Segmentation & Scope
This report segments the MENA Architectural Services Market by service type and building type.
By Service Type:
- Concept Design: Growth is projected at xx% CAGR due to early stage project planning. Competitive dynamics are driven by design innovation and client relationships.
- Schematic Design: Projects a xx% CAGR, with competition centered around design efficiency and cost optimization.
- Design Development: Projected xx% CAGR, focusing on detailed design and client collaboration. Competitive advantage lies in expertise.
- Construction Documentation: Largest segment with a projected xx% CAGR, primarily driven by construction project volumes. Competition is based on accuracy and speed.
By Building Type:
- Commercial: Largest segment with a projected xx% CAGR, reflecting the robust growth of the commercial real estate sector. Competition is driven by design innovation and client acquisition.
- Residential: Significant growth potential with a projected xx% CAGR, reflecting the rise of urbanization and the growing demand for housing. Competitive advantage lies in efficient design and affordability.
- Healthcare: Projected xx% CAGR, driven by increased investment in healthcare infrastructure. Specialized expertise is crucial.
- Educational: Projected xx% CAGR, driven by government investment in education. Design expertise and functional needs are paramount.
- Hospitality: Projected xx% CAGR, driven by the growth of the tourism sector. Attractive designs and sustainable practices are essential for competitiveness.
Key Drivers of MENA Architectural Services Market Growth
Several factors drive the growth of the MENA architectural services market: rapid urbanization and population growth, creating a high demand for new infrastructure and buildings; substantial government investments in infrastructure projects, particularly in Saudi Arabia and the UAE; growing tourism and hospitality sectors, boosting demand for hotels, resorts, and entertainment venues; and a rising middle class with increased purchasing power, driving demand for quality housing and commercial spaces. Furthermore, government initiatives promoting sustainable construction practices contribute to the market’s expansion.
Challenges in the MENA Architectural Services Market Sector
The MENA architectural services market faces challenges including fluctuating oil prices which impact government spending; shortages of skilled labor and specialized professionals; complex regulatory processes and bureaucratic hurdles in certain countries; intense competition among firms, with varying levels of experience and expertise; and potential supply chain disruptions affecting construction material availability and costs. These factors collectively influence project timelines and profitability.
Leading Players in the MENA Architectural Services Market Market
- Naga Architects
- SaudConsult
- RMJM Inc
- DARB Architects & Engineers
- Mounir Hajjiri & Associates (Hajjiri Group)
- Sabbour Consulting
- Omrania
- Khatib & Alami
- DSA Architects Intl
- M T Architects
- Modern Architectural Design
- EHAF Consulting Engineers
- Henning Larsen
- Saudi Architects
- Farris & Farris Architects
- Engineering Consultants Group
- HKS Inc
- Keo International Consultants
- Tahhan and Bushnaq
- AECOM
- U+A
- Lacasa Architects & Engineering Consultants
Key Developments in MENA Architectural Services Market Sector
- September 2023: Henning Larsen announces its work on a climate-resilient moss home, highlighting innovation in sustainable design.
- March 2023: Omrania's acquisition by Egis Group significantly reshapes the Saudi Arabian market landscape, increasing the scale and potential for Vision 2030 project involvement.
Strategic MENA Architectural Services Market Market Outlook
The MENA architectural services market presents significant growth opportunities, driven by continued infrastructure development, urbanization, and economic diversification initiatives across the region. Strategic partnerships, investments in technology, and a focus on sustainable and resilient designs will be key success factors for firms seeking to capitalize on this market's potential. The increasing adoption of BIM and digital fabrication technologies will further reshape the competitive landscape, creating opportunities for firms with advanced technological capabilities. Moreover, expansion into niche markets, such as sustainable design and healthcare facilities, will provide additional avenues for growth.
MENA Architectural Services Market Segmentation
-
1. Service Type
- 1.1. Concept Design
- 1.2. Schematic Design
- 1.3. Design Development
- 1.4. Construction Documentation
-
2. Building Type
- 2.1. Commercial
- 2.2. Residential
- 2.3. Healthcare
- 2.4. Educational
- 2.5. Hospitality
MENA Architectural Services Market Segmentation By Geography
-
1. North America
- 1.1. United States
- 1.2. Canada
- 1.3. Mexico
-
2. South America
- 2.1. Brazil
- 2.2. Argentina
- 2.3. Rest of South America
-
3. Europe
- 3.1. United Kingdom
- 3.2. Germany
- 3.3. France
- 3.4. Italy
- 3.5. Spain
- 3.6. Russia
- 3.7. Benelux
- 3.8. Nordics
- 3.9. Rest of Europe
-
4. Middle East & Africa
- 4.1. Turkey
- 4.2. Israel
- 4.3. GCC
- 4.4. North Africa
- 4.5. South Africa
- 4.6. Rest of Middle East & Africa
-
5. Asia Pacific
- 5.1. China
- 5.2. India
- 5.3. Japan
- 5.4. South Korea
- 5.5. ASEAN
- 5.6. Oceania
- 5.7. Rest of Asia Pacific
MENA Architectural Services Market REPORT HIGHLIGHTS
| Aspects | Details |
|---|---|
| Study Period | 2019-2033 |
| Base Year | 2024 |
| Estimated Year | 2025 |
| Forecast Period | 2025-2033 |
| Historical Period | 2019-2024 |
| Growth Rate | CAGR of 7.61% from 2019-2033 |
| Segmentation |
|
Table of Contents
- 1. Introduction
- 1.1. Research Scope
- 1.2. Market Segmentation
- 1.3. Research Methodology
- 1.4. Definitions and Assumptions
- 2. Executive Summary
- 2.1. Introduction
- 3. Market Dynamics
- 3.1. Introduction
- 3.2. Market Drivers
- 3.2.1. Increasing Demand for Green Buildings; Adoption of 3D Printing
- 3.3. Market Restrains
- 3.3.1. ; Data Privacy Concerns and Lack of internet Infrastructure in Emerging Nations
- 3.4. Market Trends
- 3.4.1. Increasing Demand for Green Buildings to Drive the Market
- 4. Market Factor Analysis
- 4.1. Porters Five Forces
- 4.2. Supply/Value Chain
- 4.3. PESTEL analysis
- 4.4. Market Entropy
- 4.5. Patent/Trademark Analysis
- 5. Global MENA Architectural Services Market Analysis, Insights and Forecast, 2019-2031
- 5.1. Market Analysis, Insights and Forecast - by Service Type
- 5.1.1. Concept Design
- 5.1.2. Schematic Design
- 5.1.3. Design Development
- 5.1.4. Construction Documentation
- 5.2. Market Analysis, Insights and Forecast - by Building Type
- 5.2.1. Commercial
- 5.2.2. Residential
- 5.2.3. Healthcare
- 5.2.4. Educational
- 5.2.5. Hospitality
- 5.3. Market Analysis, Insights and Forecast - by Region
- 5.3.1. North America
- 5.3.2. South America
- 5.3.3. Europe
- 5.3.4. Middle East & Africa
- 5.3.5. Asia Pacific
- 5.1. Market Analysis, Insights and Forecast - by Service Type
- 6. North America MENA Architectural Services Market Analysis, Insights and Forecast, 2019-2031
- 6.1. Market Analysis, Insights and Forecast - by Service Type
- 6.1.1. Concept Design
- 6.1.2. Schematic Design
- 6.1.3. Design Development
- 6.1.4. Construction Documentation
- 6.2. Market Analysis, Insights and Forecast - by Building Type
- 6.2.1. Commercial
- 6.2.2. Residential
- 6.2.3. Healthcare
- 6.2.4. Educational
- 6.2.5. Hospitality
- 6.1. Market Analysis, Insights and Forecast - by Service Type
- 7. South America MENA Architectural Services Market Analysis, Insights and Forecast, 2019-2031
- 7.1. Market Analysis, Insights and Forecast - by Service Type
- 7.1.1. Concept Design
- 7.1.2. Schematic Design
- 7.1.3. Design Development
- 7.1.4. Construction Documentation
- 7.2. Market Analysis, Insights and Forecast - by Building Type
- 7.2.1. Commercial
- 7.2.2. Residential
- 7.2.3. Healthcare
- 7.2.4. Educational
- 7.2.5. Hospitality
- 7.1. Market Analysis, Insights and Forecast - by Service Type
- 8. Europe MENA Architectural Services Market Analysis, Insights and Forecast, 2019-2031
- 8.1. Market Analysis, Insights and Forecast - by Service Type
- 8.1.1. Concept Design
- 8.1.2. Schematic Design
- 8.1.3. Design Development
- 8.1.4. Construction Documentation
- 8.2. Market Analysis, Insights and Forecast - by Building Type
- 8.2.1. Commercial
- 8.2.2. Residential
- 8.2.3. Healthcare
- 8.2.4. Educational
- 8.2.5. Hospitality
- 8.1. Market Analysis, Insights and Forecast - by Service Type
- 9. Middle East & Africa MENA Architectural Services Market Analysis, Insights and Forecast, 2019-2031
- 9.1. Market Analysis, Insights and Forecast - by Service Type
- 9.1.1. Concept Design
- 9.1.2. Schematic Design
- 9.1.3. Design Development
- 9.1.4. Construction Documentation
- 9.2. Market Analysis, Insights and Forecast - by Building Type
- 9.2.1. Commercial
- 9.2.2. Residential
- 9.2.3. Healthcare
- 9.2.4. Educational
- 9.2.5. Hospitality
- 9.1. Market Analysis, Insights and Forecast - by Service Type
- 10. Asia Pacific MENA Architectural Services Market Analysis, Insights and Forecast, 2019-2031
- 10.1. Market Analysis, Insights and Forecast - by Service Type
- 10.1.1. Concept Design
- 10.1.2. Schematic Design
- 10.1.3. Design Development
- 10.1.4. Construction Documentation
- 10.2. Market Analysis, Insights and Forecast - by Building Type
- 10.2.1. Commercial
- 10.2.2. Residential
- 10.2.3. Healthcare
- 10.2.4. Educational
- 10.2.5. Hospitality
- 10.1. Market Analysis, Insights and Forecast - by Service Type
- 11. North America MENA Architectural Services Market Analysis, Insights and Forecast, 2019-2031
- 11.1. Market Analysis, Insights and Forecast - By Country/Sub-region
- 11.1.1 United States
- 11.1.2 Canada
- 11.1.3 Mexico
- 12. Europe MENA Architectural Services Market Analysis, Insights and Forecast, 2019-2031
- 12.1. Market Analysis, Insights and Forecast - By Country/Sub-region
- 12.1.1 Germany
- 12.1.2 United Kingdom
- 12.1.3 France
- 12.1.4 Spain
- 12.1.5 Italy
- 12.1.6 Spain
- 12.1.7 Belgium
- 12.1.8 Netherland
- 12.1.9 Nordics
- 12.1.10 Rest of Europe
- 13. Asia Pacific MENA Architectural Services Market Analysis, Insights and Forecast, 2019-2031
- 13.1. Market Analysis, Insights and Forecast - By Country/Sub-region
- 13.1.1 China
- 13.1.2 Japan
- 13.1.3 India
- 13.1.4 South Korea
- 13.1.5 Southeast Asia
- 13.1.6 Australia
- 13.1.7 Indonesia
- 13.1.8 Phillipes
- 13.1.9 Singapore
- 13.1.10 Thailandc
- 13.1.11 Rest of Asia Pacific
- 14. South America MENA Architectural Services Market Analysis, Insights and Forecast, 2019-2031
- 14.1. Market Analysis, Insights and Forecast - By Country/Sub-region
- 14.1.1 Brazil
- 14.1.2 Argentina
- 14.1.3 Peru
- 14.1.4 Chile
- 14.1.5 Colombia
- 14.1.6 Ecuador
- 14.1.7 Venezuela
- 14.1.8 Rest of South America
- 15. Middle East & Africa MENA Architectural Services Market Analysis, Insights and Forecast, 2019-2031
- 15.1. Market Analysis, Insights and Forecast - By Country/Sub-region
- 15.1.1 UAE
- 15.1.2 South Africa
- 15.1.3 Saudi Arabia
- 15.1.4 Rest of MEA
- 16. Competitive Analysis
- 16.1. Global Market Share Analysis 2024
- 16.2. Company Profiles
- 16.2.1 Naga Architects
- 16.2.1.1. Overview
- 16.2.1.2. Products
- 16.2.1.3. SWOT Analysis
- 16.2.1.4. Recent Developments
- 16.2.1.5. Financials (Based on Availability)
- 16.2.2 SaudConsult
- 16.2.2.1. Overview
- 16.2.2.2. Products
- 16.2.2.3. SWOT Analysis
- 16.2.2.4. Recent Developments
- 16.2.2.5. Financials (Based on Availability)
- 16.2.3 RMJM Inc
- 16.2.3.1. Overview
- 16.2.3.2. Products
- 16.2.3.3. SWOT Analysis
- 16.2.3.4. Recent Developments
- 16.2.3.5. Financials (Based on Availability)
- 16.2.4 DARB Architects & Engineers
- 16.2.4.1. Overview
- 16.2.4.2. Products
- 16.2.4.3. SWOT Analysis
- 16.2.4.4. Recent Developments
- 16.2.4.5. Financials (Based on Availability)
- 16.2.5 Mounir Hajjiri & Associates (Hajjiri Group)
- 16.2.5.1. Overview
- 16.2.5.2. Products
- 16.2.5.3. SWOT Analysis
- 16.2.5.4. Recent Developments
- 16.2.5.5. Financials (Based on Availability)
- 16.2.6 Sabbour Consulting
- 16.2.6.1. Overview
- 16.2.6.2. Products
- 16.2.6.3. SWOT Analysis
- 16.2.6.4. Recent Developments
- 16.2.6.5. Financials (Based on Availability)
- 16.2.7 Omrania
- 16.2.7.1. Overview
- 16.2.7.2. Products
- 16.2.7.3. SWOT Analysis
- 16.2.7.4. Recent Developments
- 16.2.7.5. Financials (Based on Availability)
- 16.2.8 Khatib & Alami
- 16.2.8.1. Overview
- 16.2.8.2. Products
- 16.2.8.3. SWOT Analysis
- 16.2.8.4. Recent Developments
- 16.2.8.5. Financials (Based on Availability)
- 16.2.9 DSA Architects Intl
- 16.2.9.1. Overview
- 16.2.9.2. Products
- 16.2.9.3. SWOT Analysis
- 16.2.9.4. Recent Developments
- 16.2.9.5. Financials (Based on Availability)
- 16.2.10 M T Architects
- 16.2.10.1. Overview
- 16.2.10.2. Products
- 16.2.10.3. SWOT Analysis
- 16.2.10.4. Recent Developments
- 16.2.10.5. Financials (Based on Availability)
- 16.2.11 Modern Architectural Design
- 16.2.11.1. Overview
- 16.2.11.2. Products
- 16.2.11.3. SWOT Analysis
- 16.2.11.4. Recent Developments
- 16.2.11.5. Financials (Based on Availability)
- 16.2.12 EHAF Consulting Engineers
- 16.2.12.1. Overview
- 16.2.12.2. Products
- 16.2.12.3. SWOT Analysis
- 16.2.12.4. Recent Developments
- 16.2.12.5. Financials (Based on Availability)
- 16.2.13 Henning Larsen
- 16.2.13.1. Overview
- 16.2.13.2. Products
- 16.2.13.3. SWOT Analysis
- 16.2.13.4. Recent Developments
- 16.2.13.5. Financials (Based on Availability)
- 16.2.14 Saudi Architects
- 16.2.14.1. Overview
- 16.2.14.2. Products
- 16.2.14.3. SWOT Analysis
- 16.2.14.4. Recent Developments
- 16.2.14.5. Financials (Based on Availability)
- 16.2.15 Farris & Farris Architects
- 16.2.15.1. Overview
- 16.2.15.2. Products
- 16.2.15.3. SWOT Analysis
- 16.2.15.4. Recent Developments
- 16.2.15.5. Financials (Based on Availability)
- 16.2.16 Engineering Consultants Group
- 16.2.16.1. Overview
- 16.2.16.2. Products
- 16.2.16.3. SWOT Analysis
- 16.2.16.4. Recent Developments
- 16.2.16.5. Financials (Based on Availability)
- 16.2.17 HKS Inc
- 16.2.17.1. Overview
- 16.2.17.2. Products
- 16.2.17.3. SWOT Analysis
- 16.2.17.4. Recent Developments
- 16.2.17.5. Financials (Based on Availability)
- 16.2.18 Keo International Consultants
- 16.2.18.1. Overview
- 16.2.18.2. Products
- 16.2.18.3. SWOT Analysis
- 16.2.18.4. Recent Developments
- 16.2.18.5. Financials (Based on Availability)
- 16.2.19 Tahhan and Bushnaq
- 16.2.19.1. Overview
- 16.2.19.2. Products
- 16.2.19.3. SWOT Analysis
- 16.2.19.4. Recent Developments
- 16.2.19.5. Financials (Based on Availability)
- 16.2.20 AECOM
- 16.2.20.1. Overview
- 16.2.20.2. Products
- 16.2.20.3. SWOT Analysis
- 16.2.20.4. Recent Developments
- 16.2.20.5. Financials (Based on Availability)
- 16.2.21 U+A
- 16.2.21.1. Overview
- 16.2.21.2. Products
- 16.2.21.3. SWOT Analysis
- 16.2.21.4. Recent Developments
- 16.2.21.5. Financials (Based on Availability)
- 16.2.22 Lacasa Architects & Engineering Consultants
- 16.2.22.1. Overview
- 16.2.22.2. Products
- 16.2.22.3. SWOT Analysis
- 16.2.22.4. Recent Developments
- 16.2.22.5. Financials (Based on Availability)
- 16.2.1 Naga Architects
List of Figures
- Figure 1: Global MENA Architectural Services Market Revenue Breakdown (Million, %) by Region 2024 & 2032
- Figure 2: North America MENA Architectural Services Market Revenue (Million), by Country 2024 & 2032
- Figure 3: North America MENA Architectural Services Market Revenue Share (%), by Country 2024 & 2032
- Figure 4: Europe MENA Architectural Services Market Revenue (Million), by Country 2024 & 2032
- Figure 5: Europe MENA Architectural Services Market Revenue Share (%), by Country 2024 & 2032
- Figure 6: Asia Pacific MENA Architectural Services Market Revenue (Million), by Country 2024 & 2032
- Figure 7: Asia Pacific MENA Architectural Services Market Revenue Share (%), by Country 2024 & 2032
- Figure 8: South America MENA Architectural Services Market Revenue (Million), by Country 2024 & 2032
- Figure 9: South America MENA Architectural Services Market Revenue Share (%), by Country 2024 & 2032
- Figure 10: Middle East & Africa MENA Architectural Services Market Revenue (Million), by Country 2024 & 2032
- Figure 11: Middle East & Africa MENA Architectural Services Market Revenue Share (%), by Country 2024 & 2032
- Figure 12: North America MENA Architectural Services Market Revenue (Million), by Service Type 2024 & 2032
- Figure 13: North America MENA Architectural Services Market Revenue Share (%), by Service Type 2024 & 2032
- Figure 14: North America MENA Architectural Services Market Revenue (Million), by Building Type 2024 & 2032
- Figure 15: North America MENA Architectural Services Market Revenue Share (%), by Building Type 2024 & 2032
- Figure 16: North America MENA Architectural Services Market Revenue (Million), by Country 2024 & 2032
- Figure 17: North America MENA Architectural Services Market Revenue Share (%), by Country 2024 & 2032
- Figure 18: South America MENA Architectural Services Market Revenue (Million), by Service Type 2024 & 2032
- Figure 19: South America MENA Architectural Services Market Revenue Share (%), by Service Type 2024 & 2032
- Figure 20: South America MENA Architectural Services Market Revenue (Million), by Building Type 2024 & 2032
- Figure 21: South America MENA Architectural Services Market Revenue Share (%), by Building Type 2024 & 2032
- Figure 22: South America MENA Architectural Services Market Revenue (Million), by Country 2024 & 2032
- Figure 23: South America MENA Architectural Services Market Revenue Share (%), by Country 2024 & 2032
- Figure 24: Europe MENA Architectural Services Market Revenue (Million), by Service Type 2024 & 2032
- Figure 25: Europe MENA Architectural Services Market Revenue Share (%), by Service Type 2024 & 2032
- Figure 26: Europe MENA Architectural Services Market Revenue (Million), by Building Type 2024 & 2032
- Figure 27: Europe MENA Architectural Services Market Revenue Share (%), by Building Type 2024 & 2032
- Figure 28: Europe MENA Architectural Services Market Revenue (Million), by Country 2024 & 2032
- Figure 29: Europe MENA Architectural Services Market Revenue Share (%), by Country 2024 & 2032
- Figure 30: Middle East & Africa MENA Architectural Services Market Revenue (Million), by Service Type 2024 & 2032
- Figure 31: Middle East & Africa MENA Architectural Services Market Revenue Share (%), by Service Type 2024 & 2032
- Figure 32: Middle East & Africa MENA Architectural Services Market Revenue (Million), by Building Type 2024 & 2032
- Figure 33: Middle East & Africa MENA Architectural Services Market Revenue Share (%), by Building Type 2024 & 2032
- Figure 34: Middle East & Africa MENA Architectural Services Market Revenue (Million), by Country 2024 & 2032
- Figure 35: Middle East & Africa MENA Architectural Services Market Revenue Share (%), by Country 2024 & 2032
- Figure 36: Asia Pacific MENA Architectural Services Market Revenue (Million), by Service Type 2024 & 2032
- Figure 37: Asia Pacific MENA Architectural Services Market Revenue Share (%), by Service Type 2024 & 2032
- Figure 38: Asia Pacific MENA Architectural Services Market Revenue (Million), by Building Type 2024 & 2032
- Figure 39: Asia Pacific MENA Architectural Services Market Revenue Share (%), by Building Type 2024 & 2032
- Figure 40: Asia Pacific MENA Architectural Services Market Revenue (Million), by Country 2024 & 2032
- Figure 41: Asia Pacific MENA Architectural Services Market Revenue Share (%), by Country 2024 & 2032
List of Tables
- Table 1: Global MENA Architectural Services Market Revenue Million Forecast, by Region 2019 & 2032
- Table 2: Global MENA Architectural Services Market Revenue Million Forecast, by Service Type 2019 & 2032
- Table 3: Global MENA Architectural Services Market Revenue Million Forecast, by Building Type 2019 & 2032
- Table 4: Global MENA Architectural Services Market Revenue Million Forecast, by Region 2019 & 2032
- Table 5: Global MENA Architectural Services Market Revenue Million Forecast, by Country 2019 & 2032
- Table 6: United States MENA Architectural Services Market Revenue (Million) Forecast, by Application 2019 & 2032
- Table 7: Canada MENA Architectural Services Market Revenue (Million) Forecast, by Application 2019 & 2032
- Table 8: Mexico MENA Architectural Services Market Revenue (Million) Forecast, by Application 2019 & 2032
- Table 9: Global MENA Architectural Services Market Revenue Million Forecast, by Country 2019 & 2032
- Table 10: Germany MENA Architectural Services Market Revenue (Million) Forecast, by Application 2019 & 2032
- Table 11: United Kingdom MENA Architectural Services Market Revenue (Million) Forecast, by Application 2019 & 2032
- Table 12: France MENA Architectural Services Market Revenue (Million) Forecast, by Application 2019 & 2032
- Table 13: Spain MENA Architectural Services Market Revenue (Million) Forecast, by Application 2019 & 2032
- Table 14: Italy MENA Architectural Services Market Revenue (Million) Forecast, by Application 2019 & 2032
- Table 15: Spain MENA Architectural Services Market Revenue (Million) Forecast, by Application 2019 & 2032
- Table 16: Belgium MENA Architectural Services Market Revenue (Million) Forecast, by Application 2019 & 2032
- Table 17: Netherland MENA Architectural Services Market Revenue (Million) Forecast, by Application 2019 & 2032
- Table 18: Nordics MENA Architectural Services Market Revenue (Million) Forecast, by Application 2019 & 2032
- Table 19: Rest of Europe MENA Architectural Services Market Revenue (Million) Forecast, by Application 2019 & 2032
- Table 20: Global MENA Architectural Services Market Revenue Million Forecast, by Country 2019 & 2032
- Table 21: China MENA Architectural Services Market Revenue (Million) Forecast, by Application 2019 & 2032
- Table 22: Japan MENA Architectural Services Market Revenue (Million) Forecast, by Application 2019 & 2032
- Table 23: India MENA Architectural Services Market Revenue (Million) Forecast, by Application 2019 & 2032
- Table 24: South Korea MENA Architectural Services Market Revenue (Million) Forecast, by Application 2019 & 2032
- Table 25: Southeast Asia MENA Architectural Services Market Revenue (Million) Forecast, by Application 2019 & 2032
- Table 26: Australia MENA Architectural Services Market Revenue (Million) Forecast, by Application 2019 & 2032
- Table 27: Indonesia MENA Architectural Services Market Revenue (Million) Forecast, by Application 2019 & 2032
- Table 28: Phillipes MENA Architectural Services Market Revenue (Million) Forecast, by Application 2019 & 2032
- Table 29: Singapore MENA Architectural Services Market Revenue (Million) Forecast, by Application 2019 & 2032
- Table 30: Thailandc MENA Architectural Services Market Revenue (Million) Forecast, by Application 2019 & 2032
- Table 31: Rest of Asia Pacific MENA Architectural Services Market Revenue (Million) Forecast, by Application 2019 & 2032
- Table 32: Global MENA Architectural Services Market Revenue Million Forecast, by Country 2019 & 2032
- Table 33: Brazil MENA Architectural Services Market Revenue (Million) Forecast, by Application 2019 & 2032
- Table 34: Argentina MENA Architectural Services Market Revenue (Million) Forecast, by Application 2019 & 2032
- Table 35: Peru MENA Architectural Services Market Revenue (Million) Forecast, by Application 2019 & 2032
- Table 36: Chile MENA Architectural Services Market Revenue (Million) Forecast, by Application 2019 & 2032
- Table 37: Colombia MENA Architectural Services Market Revenue (Million) Forecast, by Application 2019 & 2032
- Table 38: Ecuador MENA Architectural Services Market Revenue (Million) Forecast, by Application 2019 & 2032
- Table 39: Venezuela MENA Architectural Services Market Revenue (Million) Forecast, by Application 2019 & 2032
- Table 40: Rest of South America MENA Architectural Services Market Revenue (Million) Forecast, by Application 2019 & 2032
- Table 41: Global MENA Architectural Services Market Revenue Million Forecast, by Country 2019 & 2032
- Table 42: UAE MENA Architectural Services Market Revenue (Million) Forecast, by Application 2019 & 2032
- Table 43: South Africa MENA Architectural Services Market Revenue (Million) Forecast, by Application 2019 & 2032
- Table 44: Saudi Arabia MENA Architectural Services Market Revenue (Million) Forecast, by Application 2019 & 2032
- Table 45: Rest of MEA MENA Architectural Services Market Revenue (Million) Forecast, by Application 2019 & 2032
- Table 46: Global MENA Architectural Services Market Revenue Million Forecast, by Service Type 2019 & 2032
- Table 47: Global MENA Architectural Services Market Revenue Million Forecast, by Building Type 2019 & 2032
- Table 48: Global MENA Architectural Services Market Revenue Million Forecast, by Country 2019 & 2032
- Table 49: United States MENA Architectural Services Market Revenue (Million) Forecast, by Application 2019 & 2032
- Table 50: Canada MENA Architectural Services Market Revenue (Million) Forecast, by Application 2019 & 2032
- Table 51: Mexico MENA Architectural Services Market Revenue (Million) Forecast, by Application 2019 & 2032
- Table 52: Global MENA Architectural Services Market Revenue Million Forecast, by Service Type 2019 & 2032
- Table 53: Global MENA Architectural Services Market Revenue Million Forecast, by Building Type 2019 & 2032
- Table 54: Global MENA Architectural Services Market Revenue Million Forecast, by Country 2019 & 2032
- Table 55: Brazil MENA Architectural Services Market Revenue (Million) Forecast, by Application 2019 & 2032
- Table 56: Argentina MENA Architectural Services Market Revenue (Million) Forecast, by Application 2019 & 2032
- Table 57: Rest of South America MENA Architectural Services Market Revenue (Million) Forecast, by Application 2019 & 2032
- Table 58: Global MENA Architectural Services Market Revenue Million Forecast, by Service Type 2019 & 2032
- Table 59: Global MENA Architectural Services Market Revenue Million Forecast, by Building Type 2019 & 2032
- Table 60: Global MENA Architectural Services Market Revenue Million Forecast, by Country 2019 & 2032
- Table 61: United Kingdom MENA Architectural Services Market Revenue (Million) Forecast, by Application 2019 & 2032
- Table 62: Germany MENA Architectural Services Market Revenue (Million) Forecast, by Application 2019 & 2032
- Table 63: France MENA Architectural Services Market Revenue (Million) Forecast, by Application 2019 & 2032
- Table 64: Italy MENA Architectural Services Market Revenue (Million) Forecast, by Application 2019 & 2032
- Table 65: Spain MENA Architectural Services Market Revenue (Million) Forecast, by Application 2019 & 2032
- Table 66: Russia MENA Architectural Services Market Revenue (Million) Forecast, by Application 2019 & 2032
- Table 67: Benelux MENA Architectural Services Market Revenue (Million) Forecast, by Application 2019 & 2032
- Table 68: Nordics MENA Architectural Services Market Revenue (Million) Forecast, by Application 2019 & 2032
- Table 69: Rest of Europe MENA Architectural Services Market Revenue (Million) Forecast, by Application 2019 & 2032
- Table 70: Global MENA Architectural Services Market Revenue Million Forecast, by Service Type 2019 & 2032
- Table 71: Global MENA Architectural Services Market Revenue Million Forecast, by Building Type 2019 & 2032
- Table 72: Global MENA Architectural Services Market Revenue Million Forecast, by Country 2019 & 2032
- Table 73: Turkey MENA Architectural Services Market Revenue (Million) Forecast, by Application 2019 & 2032
- Table 74: Israel MENA Architectural Services Market Revenue (Million) Forecast, by Application 2019 & 2032
- Table 75: GCC MENA Architectural Services Market Revenue (Million) Forecast, by Application 2019 & 2032
- Table 76: North Africa MENA Architectural Services Market Revenue (Million) Forecast, by Application 2019 & 2032
- Table 77: South Africa MENA Architectural Services Market Revenue (Million) Forecast, by Application 2019 & 2032
- Table 78: Rest of Middle East & Africa MENA Architectural Services Market Revenue (Million) Forecast, by Application 2019 & 2032
- Table 79: Global MENA Architectural Services Market Revenue Million Forecast, by Service Type 2019 & 2032
- Table 80: Global MENA Architectural Services Market Revenue Million Forecast, by Building Type 2019 & 2032
- Table 81: Global MENA Architectural Services Market Revenue Million Forecast, by Country 2019 & 2032
- Table 82: China MENA Architectural Services Market Revenue (Million) Forecast, by Application 2019 & 2032
- Table 83: India MENA Architectural Services Market Revenue (Million) Forecast, by Application 2019 & 2032
- Table 84: Japan MENA Architectural Services Market Revenue (Million) Forecast, by Application 2019 & 2032
- Table 85: South Korea MENA Architectural Services Market Revenue (Million) Forecast, by Application 2019 & 2032
- Table 86: ASEAN MENA Architectural Services Market Revenue (Million) Forecast, by Application 2019 & 2032
- Table 87: Oceania MENA Architectural Services Market Revenue (Million) Forecast, by Application 2019 & 2032
- Table 88: Rest of Asia Pacific MENA Architectural Services Market Revenue (Million) Forecast, by Application 2019 & 2032
Frequently Asked Questions
1. What is the projected Compound Annual Growth Rate (CAGR) of the MENA Architectural Services Market?
The projected CAGR is approximately 7.61%.
2. Which companies are prominent players in the MENA Architectural Services Market?
Key companies in the market include Naga Architects, SaudConsult, RMJM Inc, DARB Architects & Engineers, Mounir Hajjiri & Associates (Hajjiri Group), Sabbour Consulting, Omrania, Khatib & Alami, DSA Architects Intl, M T Architects, Modern Architectural Design, EHAF Consulting Engineers, Henning Larsen, Saudi Architects, Farris & Farris Architects, Engineering Consultants Group, HKS Inc, Keo International Consultants, Tahhan and Bushnaq, AECOM, U+A, Lacasa Architects & Engineering Consultants.
3. What are the main segments of the MENA Architectural Services Market?
The market segments include Service Type, Building Type.
4. Can you provide details about the market size?
The market size is estimated to be USD XX Million as of 2022.
5. What are some drivers contributing to market growth?
Increasing Demand for Green Buildings; Adoption of 3D Printing.
6. What are the notable trends driving market growth?
Increasing Demand for Green Buildings to Drive the Market.
7. Are there any restraints impacting market growth?
; Data Privacy Concerns and Lack of internet Infrastructure in Emerging Nations.
8. Can you provide examples of recent developments in the market?
September 2023: Henning Larsen announced that it is working on creating a home specially designed for climate-resilient moss. The moss has the ability to create naturally resilient cities. It has one of the finest air cleaning and oxygenating competencies of any other plant. It can also absorb and digest fine dust, transforming particles into harmless and natural biomass. Such innovations are anticipated to help developing cities combat pollution.
9. What pricing options are available for accessing the report?
Pricing options include single-user, multi-user, and enterprise licenses priced at USD 3800, USD 4500, and USD 5800 respectively.
10. Is the market size provided in terms of value or volume?
The market size is provided in terms of value, measured in Million.
11. Are there any specific market keywords associated with the report?
Yes, the market keyword associated with the report is "MENA Architectural Services Market," which aids in identifying and referencing the specific market segment covered.
12. How do I determine which pricing option suits my needs best?
The pricing options vary based on user requirements and access needs. Individual users may opt for single-user licenses, while businesses requiring broader access may choose multi-user or enterprise licenses for cost-effective access to the report.
13. Are there any additional resources or data provided in the MENA Architectural Services Market report?
While the report offers comprehensive insights, it's advisable to review the specific contents or supplementary materials provided to ascertain if additional resources or data are available.
14. How can I stay updated on further developments or reports in the MENA Architectural Services Market?
To stay informed about further developments, trends, and reports in the MENA Architectural Services Market, consider subscribing to industry newsletters, following relevant companies and organizations, or regularly checking reputable industry news sources and publications.
Methodology
Step 1 - Identification of Relevant Samples Size from Population Database


Step 2 - Approaches for Defining Global Market Size (Value, Volume* & Price*)

Note*: In applicable scenarios
Step 3 - Data Sources
Primary Research
- Web Analytics
- Survey Reports
- Research Institute
- Latest Research Reports
- Opinion Leaders
Secondary Research
- Annual Reports
- White Paper
- Latest Press Release
- Industry Association
- Paid Database
- Investor Presentations

Step 4 - Data Triangulation
Involves using different sources of information in order to increase the validity of a study
These sources are likely to be stakeholders in a program - participants, other researchers, program staff, other community members, and so on.
Then we put all data in single framework & apply various statistical tools to find out the dynamic on the market.
During the analysis stage, feedback from the stakeholder groups would be compared to determine areas of agreement as well as areas of divergence


