
Key Insights
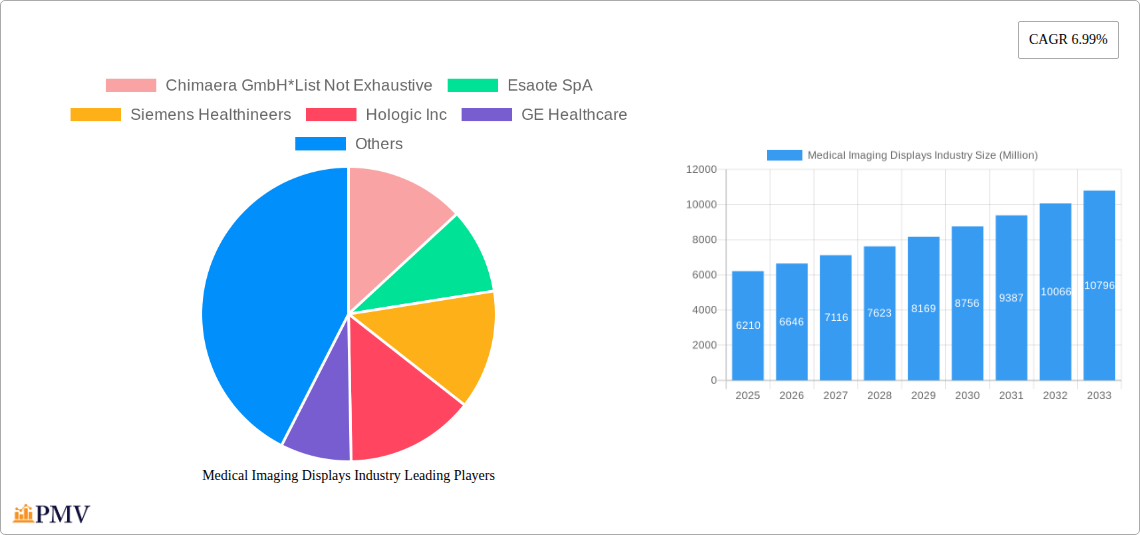
The medical imaging displays market, valued at $6.21 billion in 2025, is projected to experience robust growth, driven by several key factors. Technological advancements, such as the increasing adoption of high-resolution displays with improved image quality and ergonomics, are significantly impacting market expansion. The rising prevalence of chronic diseases like cancer and cardiovascular ailments necessitates more sophisticated diagnostic imaging procedures, fueling demand for advanced display systems. Furthermore, the global push for improved healthcare infrastructure, particularly in developing economies, creates lucrative opportunities for market players. The market is segmented by component (visualization software, display units, others), modality (CT, MRI, ultrasound, mammography, others), and usage mode (thick client, thin client workstations). The dominance of specific modalities and components will likely shift as technology evolves; for example, the increasing use of AI-powered image analysis may lead to higher demand for software solutions integrated with display systems. Growth will also be fueled by the increasing demand for improved workflow efficiency in healthcare settings and the rising adoption of telehealth, requiring efficient remote access to medical images. Geographic expansion, particularly in regions with burgeoning healthcare sectors and increasing investments in medical infrastructure, will contribute substantially to market growth. Competitive pressures from established players and emerging companies are expected, leading to innovative product development and price competitiveness, which will influence market dynamics over the forecast period.
The competitive landscape features a mix of established multinational corporations and specialized smaller firms. Key players are constantly innovating to offer superior imaging quality, enhanced user experience, and advanced features such as DICOM compliance and integration with PACS systems. Strategic alliances, mergers, and acquisitions are common strategies employed to expand market share and technological capabilities. Regional variations in healthcare spending, regulatory landscapes, and technological adoption rates contribute to diverse growth trajectories across North America, Europe, Asia-Pacific, and other regions. The forecast period (2025-2033) anticipates a sustained CAGR of 6.99%, projecting substantial market expansion driven by the factors outlined above. This growth, however, may be subject to potential restraints such as the high initial investment costs for advanced systems and the need for continuous software updates and maintenance.
Medical Imaging Displays Market Report: 2019-2033
This comprehensive report provides a detailed analysis of the Medical Imaging Displays market, offering invaluable insights for stakeholders across the industry. With a study period spanning 2019-2033, a base year of 2025, and a forecast period of 2025-2033, this report delivers a complete understanding of the market's past performance, current state, and future trajectory. The report covers market sizing in Millions, segmentation analysis, competitive landscape, and key growth drivers, ensuring a 360-degree view of this dynamic sector.
Medical Imaging Displays Industry Market Structure & Competitive Dynamics
The Medical Imaging Displays market exhibits a moderately concentrated structure, with several key players holding significant market share. The market share of the top five players, including Siemens Healthineers, GE Healthcare, Koninklijke Philips N V, Hologic Inc, and Esaote SpA, is estimated at approximately xx Million in 2025. Innovation ecosystems are crucial, driven by advancements in display technologies (e.g., higher resolutions, improved color accuracy) and visualization software. Stringent regulatory frameworks, particularly concerning medical device approvals (e.g., FDA clearance in the US), significantly influence market dynamics. Product substitutes, such as traditional film-based imaging, are gradually being replaced, although niche applications remain. End-user trends, including the growing preference for high-resolution displays and advanced image processing capabilities, are shaping market demand. M&A activities have been moderate, with deal values totaling approximately xx Million in the past five years, primarily focusing on strengthening technological capabilities and expanding market reach. The following illustrates these dynamics further:
- Market Concentration: High, with top 5 players accounting for xx% of the market.
- Innovation Ecosystems: Strong focus on improved display technologies and visualization software.
- Regulatory Frameworks: Stringent regulations impacting market entry and product development.
- M&A Activity: Moderate, with a focus on technological advancements and market expansion. Recent deals have involved companies focusing on consolidation and vertical integration.
Medical Imaging Displays Industry Industry Trends & Insights
The Medical Imaging Displays market is experiencing robust growth, projected to reach xx Million by 2033, with a CAGR of xx% during the forecast period. This growth is primarily fueled by several factors: the increasing prevalence of chronic diseases requiring advanced imaging techniques, rising investments in healthcare infrastructure globally, technological advancements in display technologies and visualization software leading to improved diagnostic accuracy, and a growing demand for better image quality and user-friendliness. The market penetration of advanced display technologies, such as high-dynamic-range (HDR) and 4K displays, is steadily increasing, driving premium segment growth. However, pricing pressures, particularly from emerging market players, are affecting profitability margins. The competitive landscape is becoming increasingly intense, with established players focusing on product differentiation through software integration and advanced features while newer entrants are pushing for lower costs.

Dominant Markets & Segments in Medical Imaging Displays Industry
The North American region currently dominates the Medical Imaging Displays market, accounting for xx% of the global market share in 2025, driven by high healthcare expenditure, advanced medical infrastructure, and a relatively high prevalence of chronic diseases. Within the segments:
- By Component: Display Units represent the largest segment, driven by higher demand. Visualization Software is rapidly expanding.
- By Modality: Computed Tomography (CT) and Magnetic Resonance Imaging (MRI) account for the largest market share, reflecting the widespread adoption of these advanced imaging techniques.
- By Usage Mode: Thick client workstations currently dominate due to their processing power but thin client is showing strong growth due to their lower cost and easier maintenance.
Key Drivers:
- North America: High healthcare expenditure, advanced infrastructure, and strong regulatory support for technological advancements.
- Europe: Growing adoption of advanced imaging technologies and significant government initiatives promoting healthcare innovation.
- Asia-Pacific: Rapidly growing healthcare sector, increasing disposable incomes, and rising healthcare awareness.
The dominance of specific regions and segments is expected to remain consistent during the forecast period, although growth rates may vary.
Medical Imaging Displays Industry Product Innovations
Recent product innovations focus on higher resolution displays (4K, 8K), improved color accuracy, higher brightness for better visibility, and enhanced ergonomics. These advancements improve diagnostic accuracy, reduce physician fatigue, and enhance workflow efficiency. Integration with advanced image processing software and AI-powered tools further enhances the diagnostic capabilities, delivering a competitive advantage for manufacturers. The focus is on improving user experience and efficiency, catering to the evolving needs of medical professionals.
Report Segmentation & Scope
This report segments the Medical Imaging Displays market across various parameters:
- By Component: Visualization Software, Display Units, and Others. Growth projections vary significantly across these segments, with visualization software experiencing higher growth.
- By Modality: Computed Tomography (CT), Magnetic Resonance Imaging (MRI), Ultrasound, Mammography, and Others. The CT and MRI segments hold the largest market share and are expected to experience consistent growth.
- By Usage Mode: Thick Client Workstation and Thin Client Workstation. Each segment shows specific growth projections based on technological trends and user preference shifts.
Key Drivers of Medical Imaging Displays Industry Growth
The Medical Imaging Displays market is driven by several key factors:
- Technological advancements: Improved display technologies (4K, HDR), advanced visualization software, and integration with AI-powered tools.
- Rising prevalence of chronic diseases: Increased demand for accurate and timely diagnosis.
- Government initiatives: Funding for healthcare infrastructure development and technological upgrades.
Challenges in the Medical Imaging Displays Industry Sector
Several challenges hinder market growth:
- High initial investment costs: Limiting accessibility in resource-constrained settings.
- Stringent regulatory requirements: Increasing the time and cost associated with product development and approval.
- Intense competition: Pricing pressures and the need for continuous innovation to maintain market share. This creates a very competitive landscape.
Leading Players in the Medical Imaging Displays Industry Market
- Chimaera GmbH
- Esaote SpA
- Siemens Healthineers
- Hologic Inc
- GE Healthcare
- Koninklijke Philips N V
- PaxeraHealth
- Carestream Health
- NGI Group
- Medicor Imaging
- Carl Zeiss AG
- Capsa Healthcare
Key Developments in Medical Imaging Displays Industry Sector
- 2023 Q3: Siemens Healthineers launched a new range of high-resolution displays with integrated AI capabilities.
- 2022 Q4: GE Healthcare acquired a smaller medical display company, enhancing its market share. (Further details would be needed for specific dates and company names.)
- 2021 Q1: Several key players announced partnerships to improve data integration across medical imaging systems. (Further details would be needed for specific dates and company names.)
Strategic Medical Imaging Displays Industry Market Outlook
The Medical Imaging Displays market presents significant growth opportunities. The continued advancements in display technologies, software integration with AI, and increasing demand for advanced diagnostic capabilities will propel market expansion. Strategic partnerships, focus on product differentiation, and efficient supply chain management will be crucial for success in this competitive landscape. The focus on innovative user interfaces and increased accessibility will drive further market growth in the long term.
Medical Imaging Displays Industry Segmentation
-
1. Component
- 1.1. Visualization Software
- 1.2. Display Units
- 1.3. Others
-
2. Modality
- 2.1. Computed Tomography (CT)
- 2.2. Magnetic Resonance Imaging
- 2.3. Ultrasound
- 2.4. Mammography
- 2.5. Others
-
3. Usage Mode
- 3.1. Thick Client Workstation
- 3.2. Thin Client Workstation
Medical Imaging Displays Industry Segmentation By Geography
-
1. North America
- 1.1. United States
- 1.2. Canada
- 1.3. Mexico
-
2. Europe
- 2.1. Germany
- 2.2. United Kingdom
- 2.3. France
- 2.4. Italy
- 2.5. Spain
- 2.6. Rest of Europe
-
3. Asia Pacific
- 3.1. China
- 3.2. Japan
- 3.3. India
- 3.4. Australia
- 3.5. South Korea
- 3.6. Rest of Asia Pacific
-
4. Middle East and Africa
- 4.1. GCC
- 4.2. South Africa
- 4.3. Rest of Middle East and Africa
-
5. South America
- 5.1. Brazil
- 5.2. Argentina
- 5.3. Rest of South America

Medical Imaging Displays Industry REPORT HIGHLIGHTS
| Aspects | Details |
|---|---|
| Study Period | 2019-2033 |
| Base Year | 2024 |
| Estimated Year | 2025 |
| Forecast Period | 2025-2033 |
| Historical Period | 2019-2024 |
| Growth Rate | CAGR of 6.99% from 2019-2033 |
| Segmentation |
|
Table of Contents
- 1. Introduction
- 1.1. Research Scope
- 1.2. Market Segmentation
- 1.3. Research Methodology
- 1.4. Definitions and Assumptions
- 2. Executive Summary
- 2.1. Introduction
- 3. Market Dynamics
- 3.1. Introduction
- 3.2. Market Drivers
- 3.2.1. Technological Advancements in The Imaging Technologies and Use of Artificial Intelligence; Rising Healthcare Expenditure Coupled with Rising Disease Burden
- 3.3. Market Restrains
- 3.3.1. High Cost of Medical Imaging Equipment; Lack of Skilled Professionals
- 3.4. Market Trends
- 3.4.1. Ultrasound is Expected to Hold the Major Market Share in the Medical Imaging Workstation Market
- 4. Market Factor Analysis
- 4.1. Porters Five Forces
- 4.2. Supply/Value Chain
- 4.3. PESTEL analysis
- 4.4. Market Entropy
- 4.5. Patent/Trademark Analysis
- 5. Global Medical Imaging Displays Industry Analysis, Insights and Forecast, 2019-2031
- 5.1. Market Analysis, Insights and Forecast - by Component
- 5.1.1. Visualization Software
- 5.1.2. Display Units
- 5.1.3. Others
- 5.2. Market Analysis, Insights and Forecast - by Modality
- 5.2.1. Computed Tomography (CT)
- 5.2.2. Magnetic Resonance Imaging
- 5.2.3. Ultrasound
- 5.2.4. Mammography
- 5.2.5. Others
- 5.3. Market Analysis, Insights and Forecast - by Usage Mode
- 5.3.1. Thick Client Workstation
- 5.3.2. Thin Client Workstation
- 5.4. Market Analysis, Insights and Forecast - by Region
- 5.4.1. North America
- 5.4.2. Europe
- 5.4.3. Asia Pacific
- 5.4.4. Middle East and Africa
- 5.4.5. South America
- 5.1. Market Analysis, Insights and Forecast - by Component
- 6. North America Medical Imaging Displays Industry Analysis, Insights and Forecast, 2019-2031
- 6.1. Market Analysis, Insights and Forecast - by Component
- 6.1.1. Visualization Software
- 6.1.2. Display Units
- 6.1.3. Others
- 6.2. Market Analysis, Insights and Forecast - by Modality
- 6.2.1. Computed Tomography (CT)
- 6.2.2. Magnetic Resonance Imaging
- 6.2.3. Ultrasound
- 6.2.4. Mammography
- 6.2.5. Others
- 6.3. Market Analysis, Insights and Forecast - by Usage Mode
- 6.3.1. Thick Client Workstation
- 6.3.2. Thin Client Workstation
- 6.1. Market Analysis, Insights and Forecast - by Component
- 7. Europe Medical Imaging Displays Industry Analysis, Insights and Forecast, 2019-2031
- 7.1. Market Analysis, Insights and Forecast - by Component
- 7.1.1. Visualization Software
- 7.1.2. Display Units
- 7.1.3. Others
- 7.2. Market Analysis, Insights and Forecast - by Modality
- 7.2.1. Computed Tomography (CT)
- 7.2.2. Magnetic Resonance Imaging
- 7.2.3. Ultrasound
- 7.2.4. Mammography
- 7.2.5. Others
- 7.3. Market Analysis, Insights and Forecast - by Usage Mode
- 7.3.1. Thick Client Workstation
- 7.3.2. Thin Client Workstation
- 7.1. Market Analysis, Insights and Forecast - by Component
- 8. Asia Pacific Medical Imaging Displays Industry Analysis, Insights and Forecast, 2019-2031
- 8.1. Market Analysis, Insights and Forecast - by Component
- 8.1.1. Visualization Software
- 8.1.2. Display Units
- 8.1.3. Others
- 8.2. Market Analysis, Insights and Forecast - by Modality
- 8.2.1. Computed Tomography (CT)
- 8.2.2. Magnetic Resonance Imaging
- 8.2.3. Ultrasound
- 8.2.4. Mammography
- 8.2.5. Others
- 8.3. Market Analysis, Insights and Forecast - by Usage Mode
- 8.3.1. Thick Client Workstation
- 8.3.2. Thin Client Workstation
- 8.1. Market Analysis, Insights and Forecast - by Component
- 9. Middle East and Africa Medical Imaging Displays Industry Analysis, Insights and Forecast, 2019-2031
- 9.1. Market Analysis, Insights and Forecast - by Component
- 9.1.1. Visualization Software
- 9.1.2. Display Units
- 9.1.3. Others
- 9.2. Market Analysis, Insights and Forecast - by Modality
- 9.2.1. Computed Tomography (CT)
- 9.2.2. Magnetic Resonance Imaging
- 9.2.3. Ultrasound
- 9.2.4. Mammography
- 9.2.5. Others
- 9.3. Market Analysis, Insights and Forecast - by Usage Mode
- 9.3.1. Thick Client Workstation
- 9.3.2. Thin Client Workstation
- 9.1. Market Analysis, Insights and Forecast - by Component
- 10. South America Medical Imaging Displays Industry Analysis, Insights and Forecast, 2019-2031
- 10.1. Market Analysis, Insights and Forecast - by Component
- 10.1.1. Visualization Software
- 10.1.2. Display Units
- 10.1.3. Others
- 10.2. Market Analysis, Insights and Forecast - by Modality
- 10.2.1. Computed Tomography (CT)
- 10.2.2. Magnetic Resonance Imaging
- 10.2.3. Ultrasound
- 10.2.4. Mammography
- 10.2.5. Others
- 10.3. Market Analysis, Insights and Forecast - by Usage Mode
- 10.3.1. Thick Client Workstation
- 10.3.2. Thin Client Workstation
- 10.1. Market Analysis, Insights and Forecast - by Component
- 11. North America Medical Imaging Displays Industry Analysis, Insights and Forecast, 2019-2031
- 11.1. Market Analysis, Insights and Forecast - By Country/Sub-region
- 11.1.1 United States
- 11.1.2 Canada
- 11.1.3 Mexico
- 12. Europe Medical Imaging Displays Industry Analysis, Insights and Forecast, 2019-2031
- 12.1. Market Analysis, Insights and Forecast - By Country/Sub-region
- 12.1.1 Germany
- 12.1.2 United Kingdom
- 12.1.3 France
- 12.1.4 Italy
- 12.1.5 Spain
- 12.1.6 Rest of Europe
- 13. Asia Pacific Medical Imaging Displays Industry Analysis, Insights and Forecast, 2019-2031
- 13.1. Market Analysis, Insights and Forecast - By Country/Sub-region
- 13.1.1 China
- 13.1.2 Japan
- 13.1.3 India
- 13.1.4 Australia
- 13.1.5 South Korea
- 13.1.6 Rest of Asia Pacific
- 14. Middle East and Africa Medical Imaging Displays Industry Analysis, Insights and Forecast, 2019-2031
- 14.1. Market Analysis, Insights and Forecast - By Country/Sub-region
- 14.1.1 GCC
- 14.1.2 South Africa
- 14.1.3 Rest of Middle East and Africa
- 15. South America Medical Imaging Displays Industry Analysis, Insights and Forecast, 2019-2031
- 15.1. Market Analysis, Insights and Forecast - By Country/Sub-region
- 15.1.1 Brazil
- 15.1.2 Argentina
- 15.1.3 Rest of South America
- 16. Competitive Analysis
- 16.1. Global Market Share Analysis 2024
- 16.2. Company Profiles
- 16.2.1 Chimaera GmbH*List Not Exhaustive
- 16.2.1.1. Overview
- 16.2.1.2. Products
- 16.2.1.3. SWOT Analysis
- 16.2.1.4. Recent Developments
- 16.2.1.5. Financials (Based on Availability)
- 16.2.2 Esaote SpA
- 16.2.2.1. Overview
- 16.2.2.2. Products
- 16.2.2.3. SWOT Analysis
- 16.2.2.4. Recent Developments
- 16.2.2.5. Financials (Based on Availability)
- 16.2.3 Siemens Healthineers
- 16.2.3.1. Overview
- 16.2.3.2. Products
- 16.2.3.3. SWOT Analysis
- 16.2.3.4. Recent Developments
- 16.2.3.5. Financials (Based on Availability)
- 16.2.4 Hologic Inc
- 16.2.4.1. Overview
- 16.2.4.2. Products
- 16.2.4.3. SWOT Analysis
- 16.2.4.4. Recent Developments
- 16.2.4.5. Financials (Based on Availability)
- 16.2.5 GE Healthcare
- 16.2.5.1. Overview
- 16.2.5.2. Products
- 16.2.5.3. SWOT Analysis
- 16.2.5.4. Recent Developments
- 16.2.5.5. Financials (Based on Availability)
- 16.2.6 Koninklijke Philips N V
- 16.2.6.1. Overview
- 16.2.6.2. Products
- 16.2.6.3. SWOT Analysis
- 16.2.6.4. Recent Developments
- 16.2.6.5. Financials (Based on Availability)
- 16.2.7 PaxeraHealth
- 16.2.7.1. Overview
- 16.2.7.2. Products
- 16.2.7.3. SWOT Analysis
- 16.2.7.4. Recent Developments
- 16.2.7.5. Financials (Based on Availability)
- 16.2.8 Carestream Health
- 16.2.8.1. Overview
- 16.2.8.2. Products
- 16.2.8.3. SWOT Analysis
- 16.2.8.4. Recent Developments
- 16.2.8.5. Financials (Based on Availability)
- 16.2.9 NGI Group
- 16.2.9.1. Overview
- 16.2.9.2. Products
- 16.2.9.3. SWOT Analysis
- 16.2.9.4. Recent Developments
- 16.2.9.5. Financials (Based on Availability)
- 16.2.10 Medicor Imaging
- 16.2.10.1. Overview
- 16.2.10.2. Products
- 16.2.10.3. SWOT Analysis
- 16.2.10.4. Recent Developments
- 16.2.10.5. Financials (Based on Availability)
- 16.2.11 Carl Zeiss AG
- 16.2.11.1. Overview
- 16.2.11.2. Products
- 16.2.11.3. SWOT Analysis
- 16.2.11.4. Recent Developments
- 16.2.11.5. Financials (Based on Availability)
- 16.2.12 Capsa Healthcare
- 16.2.12.1. Overview
- 16.2.12.2. Products
- 16.2.12.3. SWOT Analysis
- 16.2.12.4. Recent Developments
- 16.2.12.5. Financials (Based on Availability)
- 16.2.1 Chimaera GmbH*List Not Exhaustive
List of Figures
- Figure 1: Global Medical Imaging Displays Industry Revenue Breakdown (Million, %) by Region 2024 & 2032
- Figure 2: North America Medical Imaging Displays Industry Revenue (Million), by Country 2024 & 2032
- Figure 3: North America Medical Imaging Displays Industry Revenue Share (%), by Country 2024 & 2032
- Figure 4: Europe Medical Imaging Displays Industry Revenue (Million), by Country 2024 & 2032
- Figure 5: Europe Medical Imaging Displays Industry Revenue Share (%), by Country 2024 & 2032
- Figure 6: Asia Pacific Medical Imaging Displays Industry Revenue (Million), by Country 2024 & 2032
- Figure 7: Asia Pacific Medical Imaging Displays Industry Revenue Share (%), by Country 2024 & 2032
- Figure 8: Middle East and Africa Medical Imaging Displays Industry Revenue (Million), by Country 2024 & 2032
- Figure 9: Middle East and Africa Medical Imaging Displays Industry Revenue Share (%), by Country 2024 & 2032
- Figure 10: South America Medical Imaging Displays Industry Revenue (Million), by Country 2024 & 2032
- Figure 11: South America Medical Imaging Displays Industry Revenue Share (%), by Country 2024 & 2032
- Figure 12: North America Medical Imaging Displays Industry Revenue (Million), by Component 2024 & 2032
- Figure 13: North America Medical Imaging Displays Industry Revenue Share (%), by Component 2024 & 2032
- Figure 14: North America Medical Imaging Displays Industry Revenue (Million), by Modality 2024 & 2032
- Figure 15: North America Medical Imaging Displays Industry Revenue Share (%), by Modality 2024 & 2032
- Figure 16: North America Medical Imaging Displays Industry Revenue (Million), by Usage Mode 2024 & 2032
- Figure 17: North America Medical Imaging Displays Industry Revenue Share (%), by Usage Mode 2024 & 2032
- Figure 18: North America Medical Imaging Displays Industry Revenue (Million), by Country 2024 & 2032
- Figure 19: North America Medical Imaging Displays Industry Revenue Share (%), by Country 2024 & 2032
- Figure 20: Europe Medical Imaging Displays Industry Revenue (Million), by Component 2024 & 2032
- Figure 21: Europe Medical Imaging Displays Industry Revenue Share (%), by Component 2024 & 2032
- Figure 22: Europe Medical Imaging Displays Industry Revenue (Million), by Modality 2024 & 2032
- Figure 23: Europe Medical Imaging Displays Industry Revenue Share (%), by Modality 2024 & 2032
- Figure 24: Europe Medical Imaging Displays Industry Revenue (Million), by Usage Mode 2024 & 2032
- Figure 25: Europe Medical Imaging Displays Industry Revenue Share (%), by Usage Mode 2024 & 2032
- Figure 26: Europe Medical Imaging Displays Industry Revenue (Million), by Country 2024 & 2032
- Figure 27: Europe Medical Imaging Displays Industry Revenue Share (%), by Country 2024 & 2032
- Figure 28: Asia Pacific Medical Imaging Displays Industry Revenue (Million), by Component 2024 & 2032
- Figure 29: Asia Pacific Medical Imaging Displays Industry Revenue Share (%), by Component 2024 & 2032
- Figure 30: Asia Pacific Medical Imaging Displays Industry Revenue (Million), by Modality 2024 & 2032
- Figure 31: Asia Pacific Medical Imaging Displays Industry Revenue Share (%), by Modality 2024 & 2032
- Figure 32: Asia Pacific Medical Imaging Displays Industry Revenue (Million), by Usage Mode 2024 & 2032
- Figure 33: Asia Pacific Medical Imaging Displays Industry Revenue Share (%), by Usage Mode 2024 & 2032
- Figure 34: Asia Pacific Medical Imaging Displays Industry Revenue (Million), by Country 2024 & 2032
- Figure 35: Asia Pacific Medical Imaging Displays Industry Revenue Share (%), by Country 2024 & 2032
- Figure 36: Middle East and Africa Medical Imaging Displays Industry Revenue (Million), by Component 2024 & 2032
- Figure 37: Middle East and Africa Medical Imaging Displays Industry Revenue Share (%), by Component 2024 & 2032
- Figure 38: Middle East and Africa Medical Imaging Displays Industry Revenue (Million), by Modality 2024 & 2032
- Figure 39: Middle East and Africa Medical Imaging Displays Industry Revenue Share (%), by Modality 2024 & 2032
- Figure 40: Middle East and Africa Medical Imaging Displays Industry Revenue (Million), by Usage Mode 2024 & 2032
- Figure 41: Middle East and Africa Medical Imaging Displays Industry Revenue Share (%), by Usage Mode 2024 & 2032
- Figure 42: Middle East and Africa Medical Imaging Displays Industry Revenue (Million), by Country 2024 & 2032
- Figure 43: Middle East and Africa Medical Imaging Displays Industry Revenue Share (%), by Country 2024 & 2032
- Figure 44: South America Medical Imaging Displays Industry Revenue (Million), by Component 2024 & 2032
- Figure 45: South America Medical Imaging Displays Industry Revenue Share (%), by Component 2024 & 2032
- Figure 46: South America Medical Imaging Displays Industry Revenue (Million), by Modality 2024 & 2032
- Figure 47: South America Medical Imaging Displays Industry Revenue Share (%), by Modality 2024 & 2032
- Figure 48: South America Medical Imaging Displays Industry Revenue (Million), by Usage Mode 2024 & 2032
- Figure 49: South America Medical Imaging Displays Industry Revenue Share (%), by Usage Mode 2024 & 2032
- Figure 50: South America Medical Imaging Displays Industry Revenue (Million), by Country 2024 & 2032
- Figure 51: South America Medical Imaging Displays Industry Revenue Share (%), by Country 2024 & 2032
List of Tables
- Table 1: Global Medical Imaging Displays Industry Revenue Million Forecast, by Region 2019 & 2032
- Table 2: Global Medical Imaging Displays Industry Revenue Million Forecast, by Component 2019 & 2032
- Table 3: Global Medical Imaging Displays Industry Revenue Million Forecast, by Modality 2019 & 2032
- Table 4: Global Medical Imaging Displays Industry Revenue Million Forecast, by Usage Mode 2019 & 2032
- Table 5: Global Medical Imaging Displays Industry Revenue Million Forecast, by Region 2019 & 2032
- Table 6: Global Medical Imaging Displays Industry Revenue Million Forecast, by Country 2019 & 2032
- Table 7: United States Medical Imaging Displays Industry Revenue (Million) Forecast, by Application 2019 & 2032
- Table 8: Canada Medical Imaging Displays Industry Revenue (Million) Forecast, by Application 2019 & 2032
- Table 9: Mexico Medical Imaging Displays Industry Revenue (Million) Forecast, by Application 2019 & 2032
- Table 10: Global Medical Imaging Displays Industry Revenue Million Forecast, by Country 2019 & 2032
- Table 11: Germany Medical Imaging Displays Industry Revenue (Million) Forecast, by Application 2019 & 2032
- Table 12: United Kingdom Medical Imaging Displays Industry Revenue (Million) Forecast, by Application 2019 & 2032
- Table 13: France Medical Imaging Displays Industry Revenue (Million) Forecast, by Application 2019 & 2032
- Table 14: Italy Medical Imaging Displays Industry Revenue (Million) Forecast, by Application 2019 & 2032
- Table 15: Spain Medical Imaging Displays Industry Revenue (Million) Forecast, by Application 2019 & 2032
- Table 16: Rest of Europe Medical Imaging Displays Industry Revenue (Million) Forecast, by Application 2019 & 2032
- Table 17: Global Medical Imaging Displays Industry Revenue Million Forecast, by Country 2019 & 2032
- Table 18: China Medical Imaging Displays Industry Revenue (Million) Forecast, by Application 2019 & 2032
- Table 19: Japan Medical Imaging Displays Industry Revenue (Million) Forecast, by Application 2019 & 2032
- Table 20: India Medical Imaging Displays Industry Revenue (Million) Forecast, by Application 2019 & 2032
- Table 21: Australia Medical Imaging Displays Industry Revenue (Million) Forecast, by Application 2019 & 2032
- Table 22: South Korea Medical Imaging Displays Industry Revenue (Million) Forecast, by Application 2019 & 2032
- Table 23: Rest of Asia Pacific Medical Imaging Displays Industry Revenue (Million) Forecast, by Application 2019 & 2032
- Table 24: Global Medical Imaging Displays Industry Revenue Million Forecast, by Country 2019 & 2032
- Table 25: GCC Medical Imaging Displays Industry Revenue (Million) Forecast, by Application 2019 & 2032
- Table 26: South Africa Medical Imaging Displays Industry Revenue (Million) Forecast, by Application 2019 & 2032
- Table 27: Rest of Middle East and Africa Medical Imaging Displays Industry Revenue (Million) Forecast, by Application 2019 & 2032
- Table 28: Global Medical Imaging Displays Industry Revenue Million Forecast, by Country 2019 & 2032
- Table 29: Brazil Medical Imaging Displays Industry Revenue (Million) Forecast, by Application 2019 & 2032
- Table 30: Argentina Medical Imaging Displays Industry Revenue (Million) Forecast, by Application 2019 & 2032
- Table 31: Rest of South America Medical Imaging Displays Industry Revenue (Million) Forecast, by Application 2019 & 2032
- Table 32: Global Medical Imaging Displays Industry Revenue Million Forecast, by Component 2019 & 2032
- Table 33: Global Medical Imaging Displays Industry Revenue Million Forecast, by Modality 2019 & 2032
- Table 34: Global Medical Imaging Displays Industry Revenue Million Forecast, by Usage Mode 2019 & 2032
- Table 35: Global Medical Imaging Displays Industry Revenue Million Forecast, by Country 2019 & 2032
- Table 36: United States Medical Imaging Displays Industry Revenue (Million) Forecast, by Application 2019 & 2032
- Table 37: Canada Medical Imaging Displays Industry Revenue (Million) Forecast, by Application 2019 & 2032
- Table 38: Mexico Medical Imaging Displays Industry Revenue (Million) Forecast, by Application 2019 & 2032
- Table 39: Global Medical Imaging Displays Industry Revenue Million Forecast, by Component 2019 & 2032
- Table 40: Global Medical Imaging Displays Industry Revenue Million Forecast, by Modality 2019 & 2032
- Table 41: Global Medical Imaging Displays Industry Revenue Million Forecast, by Usage Mode 2019 & 2032
- Table 42: Global Medical Imaging Displays Industry Revenue Million Forecast, by Country 2019 & 2032
- Table 43: Germany Medical Imaging Displays Industry Revenue (Million) Forecast, by Application 2019 & 2032
- Table 44: United Kingdom Medical Imaging Displays Industry Revenue (Million) Forecast, by Application 2019 & 2032
- Table 45: France Medical Imaging Displays Industry Revenue (Million) Forecast, by Application 2019 & 2032
- Table 46: Italy Medical Imaging Displays Industry Revenue (Million) Forecast, by Application 2019 & 2032
- Table 47: Spain Medical Imaging Displays Industry Revenue (Million) Forecast, by Application 2019 & 2032
- Table 48: Rest of Europe Medical Imaging Displays Industry Revenue (Million) Forecast, by Application 2019 & 2032
- Table 49: Global Medical Imaging Displays Industry Revenue Million Forecast, by Component 2019 & 2032
- Table 50: Global Medical Imaging Displays Industry Revenue Million Forecast, by Modality 2019 & 2032
- Table 51: Global Medical Imaging Displays Industry Revenue Million Forecast, by Usage Mode 2019 & 2032
- Table 52: Global Medical Imaging Displays Industry Revenue Million Forecast, by Country 2019 & 2032
- Table 53: China Medical Imaging Displays Industry Revenue (Million) Forecast, by Application 2019 & 2032
- Table 54: Japan Medical Imaging Displays Industry Revenue (Million) Forecast, by Application 2019 & 2032
- Table 55: India Medical Imaging Displays Industry Revenue (Million) Forecast, by Application 2019 & 2032
- Table 56: Australia Medical Imaging Displays Industry Revenue (Million) Forecast, by Application 2019 & 2032
- Table 57: South Korea Medical Imaging Displays Industry Revenue (Million) Forecast, by Application 2019 & 2032
- Table 58: Rest of Asia Pacific Medical Imaging Displays Industry Revenue (Million) Forecast, by Application 2019 & 2032
- Table 59: Global Medical Imaging Displays Industry Revenue Million Forecast, by Component 2019 & 2032
- Table 60: Global Medical Imaging Displays Industry Revenue Million Forecast, by Modality 2019 & 2032
- Table 61: Global Medical Imaging Displays Industry Revenue Million Forecast, by Usage Mode 2019 & 2032
- Table 62: Global Medical Imaging Displays Industry Revenue Million Forecast, by Country 2019 & 2032
- Table 63: GCC Medical Imaging Displays Industry Revenue (Million) Forecast, by Application 2019 & 2032
- Table 64: South Africa Medical Imaging Displays Industry Revenue (Million) Forecast, by Application 2019 & 2032
- Table 65: Rest of Middle East and Africa Medical Imaging Displays Industry Revenue (Million) Forecast, by Application 2019 & 2032
- Table 66: Global Medical Imaging Displays Industry Revenue Million Forecast, by Component 2019 & 2032
- Table 67: Global Medical Imaging Displays Industry Revenue Million Forecast, by Modality 2019 & 2032
- Table 68: Global Medical Imaging Displays Industry Revenue Million Forecast, by Usage Mode 2019 & 2032
- Table 69: Global Medical Imaging Displays Industry Revenue Million Forecast, by Country 2019 & 2032
- Table 70: Brazil Medical Imaging Displays Industry Revenue (Million) Forecast, by Application 2019 & 2032
- Table 71: Argentina Medical Imaging Displays Industry Revenue (Million) Forecast, by Application 2019 & 2032
- Table 72: Rest of South America Medical Imaging Displays Industry Revenue (Million) Forecast, by Application 2019 & 2032
Frequently Asked Questions
1. What is the projected Compound Annual Growth Rate (CAGR) of the Medical Imaging Displays Industry?
The projected CAGR is approximately 6.99%.
2. Which companies are prominent players in the Medical Imaging Displays Industry?
Key companies in the market include Chimaera GmbH*List Not Exhaustive, Esaote SpA, Siemens Healthineers, Hologic Inc, GE Healthcare, Koninklijke Philips N V, PaxeraHealth, Carestream Health, NGI Group, Medicor Imaging, Carl Zeiss AG, Capsa Healthcare.
3. What are the main segments of the Medical Imaging Displays Industry?
The market segments include Component, Modality, Usage Mode.
4. Can you provide details about the market size?
The market size is estimated to be USD 6.21 Million as of 2022.
5. What are some drivers contributing to market growth?
Technological Advancements in The Imaging Technologies and Use of Artificial Intelligence; Rising Healthcare Expenditure Coupled with Rising Disease Burden.
6. What are the notable trends driving market growth?
Ultrasound is Expected to Hold the Major Market Share in the Medical Imaging Workstation Market.
7. Are there any restraints impacting market growth?
High Cost of Medical Imaging Equipment; Lack of Skilled Professionals.
8. Can you provide examples of recent developments in the market?
N/A
9. What pricing options are available for accessing the report?
Pricing options include single-user, multi-user, and enterprise licenses priced at USD 4750, USD 5250, and USD 8750 respectively.
10. Is the market size provided in terms of value or volume?
The market size is provided in terms of value, measured in Million.
11. Are there any specific market keywords associated with the report?
Yes, the market keyword associated with the report is "Medical Imaging Displays Industry," which aids in identifying and referencing the specific market segment covered.
12. How do I determine which pricing option suits my needs best?
The pricing options vary based on user requirements and access needs. Individual users may opt for single-user licenses, while businesses requiring broader access may choose multi-user or enterprise licenses for cost-effective access to the report.
13. Are there any additional resources or data provided in the Medical Imaging Displays Industry report?
While the report offers comprehensive insights, it's advisable to review the specific contents or supplementary materials provided to ascertain if additional resources or data are available.
14. How can I stay updated on further developments or reports in the Medical Imaging Displays Industry?
To stay informed about further developments, trends, and reports in the Medical Imaging Displays Industry, consider subscribing to industry newsletters, following relevant companies and organizations, or regularly checking reputable industry news sources and publications.
Methodology
Step 1 - Identification of Relevant Samples Size from Population Database


Step 2 - Approaches for Defining Global Market Size (Value, Volume* & Price*)

Note*: In applicable scenarios
Step 3 - Data Sources
Primary Research
- Web Analytics
- Survey Reports
- Research Institute
- Latest Research Reports
- Opinion Leaders
Secondary Research
- Annual Reports
- White Paper
- Latest Press Release
- Industry Association
- Paid Database
- Investor Presentations

Step 4 - Data Triangulation
Involves using different sources of information in order to increase the validity of a study
These sources are likely to be stakeholders in a program - participants, other researchers, program staff, other community members, and so on.
Then we put all data in single framework & apply various statistical tools to find out the dynamic on the market.
During the analysis stage, feedback from the stakeholder groups would be compared to determine areas of agreement as well as areas of divergence


