
Key Insights
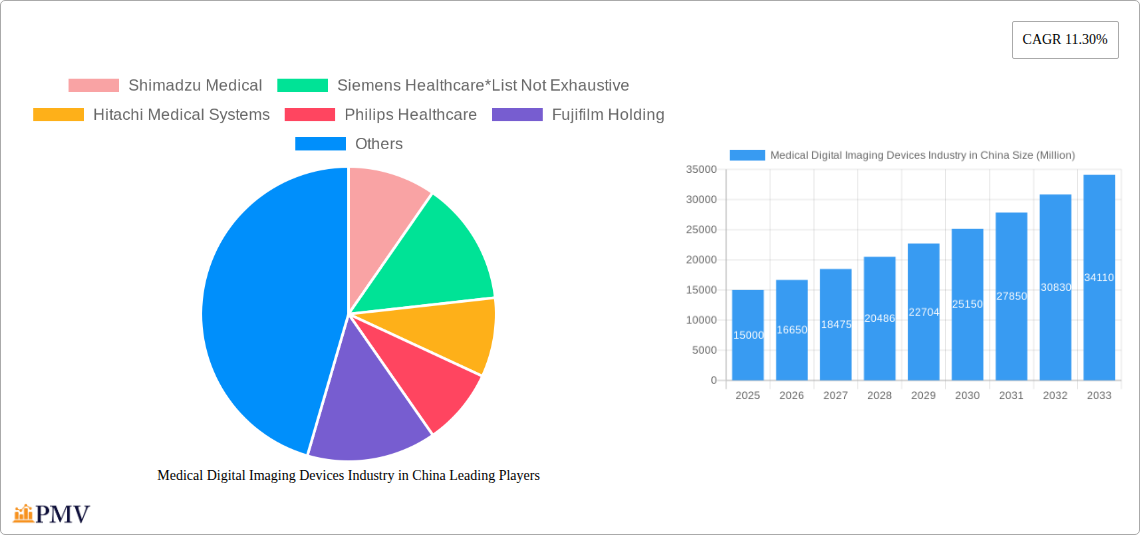
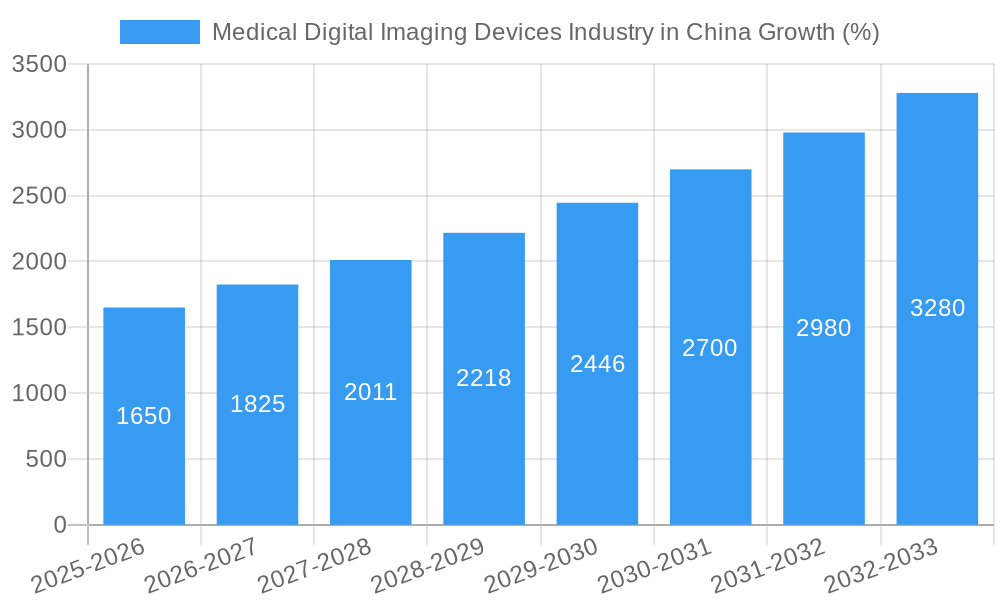
The Chinese medical digital imaging devices market is experiencing robust growth, projected to reach a substantial size by 2033. Driven by factors such as increasing prevalence of chronic diseases, rising geriatric population, expanding healthcare infrastructure, and government initiatives promoting advanced medical technology adoption, the market exhibits a Compound Annual Growth Rate (CAGR) of 11.30% from 2019-2033. Key segments contributing to this growth include Computed Tomography (CT), Magnetic Resonance Imaging (MRI) – particularly high and ultra-high field systems (3T and above) – and Ultrasound, fueled by their superior diagnostic capabilities and increasing affordability. The market is largely dominated by multinational players like Siemens Healthcare, GE Healthcare, and Philips Healthcare, alongside significant contributions from domestic manufacturers like Shimadzu Medical and Canon Medical Systems Corporation. However, market penetration for advanced imaging modalities remains relatively lower in certain regions compared to urban centers, presenting an opportunity for expansion. Furthermore, the ongoing integration of artificial intelligence (AI) in image analysis and the development of more portable and cost-effective imaging devices are shaping market trends. Regulatory approvals and pricing policies also influence market dynamics. Competition is intense, with companies focusing on technological innovation, strategic partnerships, and distribution network expansion to secure market share.
The segmentation of the Chinese medical digital imaging devices market reveals varied growth rates across modalities and applications. Cardiology, oncology, and neurology applications are major drivers, reflecting the high prevalence of related diseases. Hospitals and diagnostic centers constitute the largest end-users, reflecting the concentration of imaging services in centralized healthcare facilities. Future growth will likely be driven by the increasing adoption of advanced technologies such as AI-powered diagnostic tools, miniaturized and portable imaging systems, and improved image quality and resolution. The continued expansion of private healthcare facilities and an increase in outpatient diagnostic procedures will further contribute to market expansion. The government's focus on improving healthcare access across rural regions presents a significant opportunity for growth in less-developed areas, while potential challenges include cost-effectiveness concerns and regulatory compliance.
Medical Digital Imaging Devices Industry in China: A Comprehensive Market Report (2019-2033)
This comprehensive report provides an in-depth analysis of the Medical Digital Imaging Devices industry in China, covering the period from 2019 to 2033. It offers invaluable insights into market structure, competitive dynamics, technological advancements, and future growth prospects, empowering businesses to make informed strategic decisions. The report incorporates detailed segmentation analysis, incorporating market size estimations (in Millions) and forecasts for various segments and key players.
Medical Digital Imaging Devices Industry in China Market Structure & Competitive Dynamics
The Chinese medical digital imaging devices market is characterized by a moderately concentrated structure with both domestic and international players vying for market share. Key players such as Shimadzu Medical, Siemens Healthcare, Hitachi Medical Systems, Philips Healthcare, Fujifilm Holding, Canon Medical Systems Corporation, Carestream Health Inc, GE Healthcare (GE Company), and Hologic Corporation hold significant market shares, collectively accounting for approximately xx% of the total market in 2025. However, the market also features several smaller, specialized companies focusing on niche segments.
The competitive landscape is dynamic, driven by continuous technological innovation, strategic partnerships, and mergers & acquisitions (M&A). Significant M&A activity has been observed in recent years, with deal values exceeding xx Million in 2024 alone. These activities often aim to expand product portfolios, enhance technological capabilities, and gain access to wider market segments. The regulatory framework plays a vital role, influencing market entry and product approvals. Stringent regulatory requirements are driving the adoption of high-quality, safe, and effective devices. Substitution effects are minimal due to the specialized nature of the products and the necessity of advanced medical imaging for accurate diagnosis. End-user trends indicate a growing preference for sophisticated systems with improved image quality, advanced analytical capabilities, and streamlined workflows.
- Market Concentration: xx% market share held by top 8 players in 2025.
- M&A Activity: Deal value exceeding xx Million in 2024.
- Regulatory Landscape: Stringent regulations driving adoption of high-quality devices.
- End-User Trends: Increasing preference for advanced systems with improved image quality and analytical capabilities.
Medical Digital Imaging Devices Industry in China Industry Trends & Insights
The Chinese medical digital imaging devices market exhibits robust growth, driven by several key factors. The rising prevalence of chronic diseases, an aging population, expanding healthcare infrastructure, and increasing government initiatives to improve healthcare accessibility are major catalysts for market expansion. Technological advancements, such as the development of AI-powered image analysis and high-resolution imaging systems, are significantly improving diagnostic capabilities and efficiency, fueling market growth. Consumer preferences are shifting towards non-invasive procedures and minimally invasive diagnostics, leading to increased demand for advanced imaging technologies. The market is experiencing a compound annual growth rate (CAGR) of xx% during the forecast period (2025-2033), with the market penetration of advanced imaging technologies expected to reach xx% by 2033. Competitive dynamics, marked by continuous innovation and the emergence of new players, are further shaping market evolution. The market shows a strong preference for high-end scanners and advanced digital systems which leads to a faster growth in the respective segments.
Dominant Markets & Segments in Medical Digital Imaging Devices Industry in China
The largest segment within the Chinese medical digital imaging devices market is Computed Tomography (CT), specifically high-end scanners (128-slice and more), driven by the increasing demand for precise and detailed diagnostic images in various medical specializations. The dominant regions are concentrated in the eastern coastal areas of China, which benefit from higher healthcare expenditure and advanced medical infrastructure. The oncology application segment is also experiencing significant growth, reflecting the rising incidence of cancer in the country.
Key Drivers of Dominance:
- Technological Advancements: High-resolution imaging, AI-powered image analysis, and improved workflow efficiency.
- Economic Factors: Increasing healthcare expenditure and insurance coverage.
- Government Policies: Initiatives to upgrade healthcare infrastructure and improve healthcare access.
- Infrastructure Development: Investment in advanced medical facilities and diagnostic centers across tier-1 and tier-2 cities.
Dominant Segment Analysis:
The dominance of CT high-end scanners is linked to their superior image quality and diagnostic capabilities, vital for complex medical cases. The rising prevalence of cancer and the resulting need for accurate diagnosis further fuel this segment’s growth. Hospitals remain the largest end-users, due to their extensive diagnostic requirements and capabilities.
Medical Digital Imaging Devices Industry in China Product Innovations
Recent innovations include the integration of Artificial Intelligence (AI) for automated image analysis and improved diagnostic accuracy, the development of portable and more compact imaging systems for improved accessibility in rural areas, and advanced 3D and 4D imaging techniques. These advancements enhance the efficiency and effectiveness of diagnostic procedures, significantly impacting market growth by improving the quality of care and reducing diagnostic times.
Report Segmentation & Scope
The report segments the market by modality (MRI, CT, Ultrasound, X-Ray, Nuclear Imaging), application (Cardiology, Oncology, Neurology, Orthopedics, Gastroenterology, Gynecology, Other Applications), end-user (Hospitals, Diagnostic Centers, Other End-Users), and specific device types (Single Photon Emission Computed Tomography (SPECT), Fluoroscopy, Mammography, Very High, and Ultra High Field MRI Systems (3T and more), High End Scanners (128-Slice and More)). Each segment’s growth projections, market sizes, and competitive dynamics are thoroughly analyzed throughout the study period (2019–2033). The detailed segmentation facilitates a granular understanding of the market's diverse components.
Key Drivers of Medical Digital Imaging Devices Industry in China Growth
Technological advancements, such as AI-powered image analysis and improved resolution imaging, drive significant growth. The rising prevalence of chronic diseases and an aging population increase the demand for advanced diagnostics. Government initiatives focused on healthcare infrastructure development and expanding healthcare access across the country further stimulate market growth. Increased healthcare expenditure and insurance coverage make advanced imaging technologies more accessible.
Challenges in the Medical Digital Imaging Devices Industry in China Sector
Regulatory hurdles for product approvals and stringent safety standards present challenges for market entry and expansion. Supply chain disruptions due to geopolitical factors can impact product availability and pricing. Intense competition from both domestic and international players necessitates continuous innovation and strategic partnerships. High device costs can limit accessibility, particularly in lower-tier cities. These factors collectively contribute to market complexities and require strategic adaptation by industry players.
Leading Players in the Medical Digital Imaging Devices Industry in China Market
- Shimadzu Medical
- Siemens Healthcare
- Hitachi Medical Systems
- Philips Healthcare
- Fujifilm Holding
- Canon Medical Systems Corporation
- Carestream Health Inc
- GE Healthcare (GE Company)
- Hologic Corporation
Key Developments in Medical Digital Imaging Devices Industry in China Sector
- 2023-Q4: Launch of a new AI-powered CT scanner by a leading domestic company.
- 2024-Q1: Strategic partnership between a multinational medical device company and a Chinese hospital network.
- 2024-Q3: Acquisition of a smaller imaging device company by a major international player.
- 2025-Q2: Regulatory approval granted for a new high-end MRI system.
(Further developments to be added in the final report)
Strategic Medical Digital Imaging Devices Industry in China Market Outlook
The Chinese medical digital imaging devices market holds significant future potential, fueled by sustained growth in healthcare expenditure, continued technological advancements, and expanding healthcare infrastructure. Strategic opportunities exist in focusing on innovative solutions, expanding into underserved regions, and capitalizing on the increasing demand for high-end and specialized imaging technologies. Companies with a strong focus on R&D, regulatory compliance, and strategic partnerships will be best positioned for success in this dynamic market.
Medical Digital Imaging Devices Industry in China Segmentation
-
1. Modality
-
1.1. MRI
- 1.1.1. Low and mid field MRI systems (less than 1.5 T)
- 1.1.2. High field MRI systems (1.5-3 T)
- 1.1.3. Very Hig
-
1.2. Computed Tomography
- 1.2.1. Low End Scanners (~16-Slice)
- 1.2.2. Mid Range Scanners (~64-Slice)
- 1.2.3. High End Scanners (128-Slice and More)
-
1.3. Ultrasound
- 1.3.1. 2D Ultrasound
- 1.3.2. 3D Ultrasound
- 1.3.3. Others
-
1.4. X-Ray
- 1.4.1. Analog Systems
- 1.4.2. Digital Systems
-
1.5. Nuclear Imaging
- 1.5.1. Positron Emission Tomography (PET)
- 1.5.2. Single Photon Emission Computed Tomography (SPECT)
- 1.6. Fluoroscopy
- 1.7. Mammography
-
1.1. MRI
-
2. Application
- 2.1. Cardiology
- 2.2. Oncology
- 2.3. Neurology
- 2.4. Orthopedics
- 2.5. Gastroenterology
- 2.6. Gynecology
- 2.7. Other Applications
-
3. End-User
- 3.1. Hospitals
- 3.2. Diagnostic Centers
- 3.3. Other End-Users
Medical Digital Imaging Devices Industry in China Segmentation By Geography
-
1. North America
- 1.1. United States
- 1.2. Canada
- 1.3. Mexico
-
2. South America
- 2.1. Brazil
- 2.2. Argentina
- 2.3. Rest of South America
-
3. Europe
- 3.1. United Kingdom
- 3.2. Germany
- 3.3. France
- 3.4. Italy
- 3.5. Spain
- 3.6. Russia
- 3.7. Benelux
- 3.8. Nordics
- 3.9. Rest of Europe
-
4. Middle East & Africa
- 4.1. Turkey
- 4.2. Israel
- 4.3. GCC
- 4.4. North Africa
- 4.5. South Africa
- 4.6. Rest of Middle East & Africa
-
5. Asia Pacific
- 5.1. China
- 5.2. India
- 5.3. Japan
- 5.4. South Korea
- 5.5. ASEAN
- 5.6. Oceania
- 5.7. Rest of Asia Pacific
Medical Digital Imaging Devices Industry in China REPORT HIGHLIGHTS
| Aspects | Details |
|---|---|
| Study Period | 2019-2033 |
| Base Year | 2024 |
| Estimated Year | 2025 |
| Forecast Period | 2025-2033 |
| Historical Period | 2019-2024 |
| Growth Rate | CAGR of 11.30% from 2019-2033 |
| Segmentation |
|
Table of Contents
- 1. Introduction
- 1.1. Research Scope
- 1.2. Market Segmentation
- 1.3. Research Methodology
- 1.4. Definitions and Assumptions
- 2. Executive Summary
- 2.1. Introduction
- 3. Market Dynamics
- 3.1. Introduction
- 3.2. Market Drivers
- 3.2.1. ; Rise in the Prevalence of Chronic Diseases; Growing Geriatric Population; Increased Adoption of Advanced Technologies in Medical Imaging
- 3.3. Market Restrains
- 3.3.1. ; High Costs Associated With the Devices; Side Effects of Diagnostic Imaging Procedures
- 3.4. Market Trends
- 3.4.1. Oncology Segment is Expected to Hold a Major Market Share in the China Diagnostic Imaging Market
- 4. Market Factor Analysis
- 4.1. Porters Five Forces
- 4.2. Supply/Value Chain
- 4.3. PESTEL analysis
- 4.4. Market Entropy
- 4.5. Patent/Trademark Analysis
- 5. Global Medical Digital Imaging Devices Industry in China Analysis, Insights and Forecast, 2019-2031
- 5.1. Market Analysis, Insights and Forecast - by Modality
- 5.1.1. MRI
- 5.1.1.1. Low and mid field MRI systems (less than 1.5 T)
- 5.1.1.2. High field MRI systems (1.5-3 T)
- 5.1.1.3. Very Hig
- 5.1.2. Computed Tomography
- 5.1.2.1. Low End Scanners (~16-Slice)
- 5.1.2.2. Mid Range Scanners (~64-Slice)
- 5.1.2.3. High End Scanners (128-Slice and More)
- 5.1.3. Ultrasound
- 5.1.3.1. 2D Ultrasound
- 5.1.3.2. 3D Ultrasound
- 5.1.3.3. Others
- 5.1.4. X-Ray
- 5.1.4.1. Analog Systems
- 5.1.4.2. Digital Systems
- 5.1.5. Nuclear Imaging
- 5.1.5.1. Positron Emission Tomography (PET)
- 5.1.5.2. Single Photon Emission Computed Tomography (SPECT)
- 5.1.6. Fluoroscopy
- 5.1.7. Mammography
- 5.1.1. MRI
- 5.2. Market Analysis, Insights and Forecast - by Application
- 5.2.1. Cardiology
- 5.2.2. Oncology
- 5.2.3. Neurology
- 5.2.4. Orthopedics
- 5.2.5. Gastroenterology
- 5.2.6. Gynecology
- 5.2.7. Other Applications
- 5.3. Market Analysis, Insights and Forecast - by End-User
- 5.3.1. Hospitals
- 5.3.2. Diagnostic Centers
- 5.3.3. Other End-Users
- 5.4. Market Analysis, Insights and Forecast - by Region
- 5.4.1. North America
- 5.4.2. South America
- 5.4.3. Europe
- 5.4.4. Middle East & Africa
- 5.4.5. Asia Pacific
- 5.1. Market Analysis, Insights and Forecast - by Modality
- 6. North America Medical Digital Imaging Devices Industry in China Analysis, Insights and Forecast, 2019-2031
- 6.1. Market Analysis, Insights and Forecast - by Modality
- 6.1.1. MRI
- 6.1.1.1. Low and mid field MRI systems (less than 1.5 T)
- 6.1.1.2. High field MRI systems (1.5-3 T)
- 6.1.1.3. Very Hig
- 6.1.2. Computed Tomography
- 6.1.2.1. Low End Scanners (~16-Slice)
- 6.1.2.2. Mid Range Scanners (~64-Slice)
- 6.1.2.3. High End Scanners (128-Slice and More)
- 6.1.3. Ultrasound
- 6.1.3.1. 2D Ultrasound
- 6.1.3.2. 3D Ultrasound
- 6.1.3.3. Others
- 6.1.4. X-Ray
- 6.1.4.1. Analog Systems
- 6.1.4.2. Digital Systems
- 6.1.5. Nuclear Imaging
- 6.1.5.1. Positron Emission Tomography (PET)
- 6.1.5.2. Single Photon Emission Computed Tomography (SPECT)
- 6.1.6. Fluoroscopy
- 6.1.7. Mammography
- 6.1.1. MRI
- 6.2. Market Analysis, Insights and Forecast - by Application
- 6.2.1. Cardiology
- 6.2.2. Oncology
- 6.2.3. Neurology
- 6.2.4. Orthopedics
- 6.2.5. Gastroenterology
- 6.2.6. Gynecology
- 6.2.7. Other Applications
- 6.3. Market Analysis, Insights and Forecast - by End-User
- 6.3.1. Hospitals
- 6.3.2. Diagnostic Centers
- 6.3.3. Other End-Users
- 6.1. Market Analysis, Insights and Forecast - by Modality
- 7. South America Medical Digital Imaging Devices Industry in China Analysis, Insights and Forecast, 2019-2031
- 7.1. Market Analysis, Insights and Forecast - by Modality
- 7.1.1. MRI
- 7.1.1.1. Low and mid field MRI systems (less than 1.5 T)
- 7.1.1.2. High field MRI systems (1.5-3 T)
- 7.1.1.3. Very Hig
- 7.1.2. Computed Tomography
- 7.1.2.1. Low End Scanners (~16-Slice)
- 7.1.2.2. Mid Range Scanners (~64-Slice)
- 7.1.2.3. High End Scanners (128-Slice and More)
- 7.1.3. Ultrasound
- 7.1.3.1. 2D Ultrasound
- 7.1.3.2. 3D Ultrasound
- 7.1.3.3. Others
- 7.1.4. X-Ray
- 7.1.4.1. Analog Systems
- 7.1.4.2. Digital Systems
- 7.1.5. Nuclear Imaging
- 7.1.5.1. Positron Emission Tomography (PET)
- 7.1.5.2. Single Photon Emission Computed Tomography (SPECT)
- 7.1.6. Fluoroscopy
- 7.1.7. Mammography
- 7.1.1. MRI
- 7.2. Market Analysis, Insights and Forecast - by Application
- 7.2.1. Cardiology
- 7.2.2. Oncology
- 7.2.3. Neurology
- 7.2.4. Orthopedics
- 7.2.5. Gastroenterology
- 7.2.6. Gynecology
- 7.2.7. Other Applications
- 7.3. Market Analysis, Insights and Forecast - by End-User
- 7.3.1. Hospitals
- 7.3.2. Diagnostic Centers
- 7.3.3. Other End-Users
- 7.1. Market Analysis, Insights and Forecast - by Modality
- 8. Europe Medical Digital Imaging Devices Industry in China Analysis, Insights and Forecast, 2019-2031
- 8.1. Market Analysis, Insights and Forecast - by Modality
- 8.1.1. MRI
- 8.1.1.1. Low and mid field MRI systems (less than 1.5 T)
- 8.1.1.2. High field MRI systems (1.5-3 T)
- 8.1.1.3. Very Hig
- 8.1.2. Computed Tomography
- 8.1.2.1. Low End Scanners (~16-Slice)
- 8.1.2.2. Mid Range Scanners (~64-Slice)
- 8.1.2.3. High End Scanners (128-Slice and More)
- 8.1.3. Ultrasound
- 8.1.3.1. 2D Ultrasound
- 8.1.3.2. 3D Ultrasound
- 8.1.3.3. Others
- 8.1.4. X-Ray
- 8.1.4.1. Analog Systems
- 8.1.4.2. Digital Systems
- 8.1.5. Nuclear Imaging
- 8.1.5.1. Positron Emission Tomography (PET)
- 8.1.5.2. Single Photon Emission Computed Tomography (SPECT)
- 8.1.6. Fluoroscopy
- 8.1.7. Mammography
- 8.1.1. MRI
- 8.2. Market Analysis, Insights and Forecast - by Application
- 8.2.1. Cardiology
- 8.2.2. Oncology
- 8.2.3. Neurology
- 8.2.4. Orthopedics
- 8.2.5. Gastroenterology
- 8.2.6. Gynecology
- 8.2.7. Other Applications
- 8.3. Market Analysis, Insights and Forecast - by End-User
- 8.3.1. Hospitals
- 8.3.2. Diagnostic Centers
- 8.3.3. Other End-Users
- 8.1. Market Analysis, Insights and Forecast - by Modality
- 9. Middle East & Africa Medical Digital Imaging Devices Industry in China Analysis, Insights and Forecast, 2019-2031
- 9.1. Market Analysis, Insights and Forecast - by Modality
- 9.1.1. MRI
- 9.1.1.1. Low and mid field MRI systems (less than 1.5 T)
- 9.1.1.2. High field MRI systems (1.5-3 T)
- 9.1.1.3. Very Hig
- 9.1.2. Computed Tomography
- 9.1.2.1. Low End Scanners (~16-Slice)
- 9.1.2.2. Mid Range Scanners (~64-Slice)
- 9.1.2.3. High End Scanners (128-Slice and More)
- 9.1.3. Ultrasound
- 9.1.3.1. 2D Ultrasound
- 9.1.3.2. 3D Ultrasound
- 9.1.3.3. Others
- 9.1.4. X-Ray
- 9.1.4.1. Analog Systems
- 9.1.4.2. Digital Systems
- 9.1.5. Nuclear Imaging
- 9.1.5.1. Positron Emission Tomography (PET)
- 9.1.5.2. Single Photon Emission Computed Tomography (SPECT)
- 9.1.6. Fluoroscopy
- 9.1.7. Mammography
- 9.1.1. MRI
- 9.2. Market Analysis, Insights and Forecast - by Application
- 9.2.1. Cardiology
- 9.2.2. Oncology
- 9.2.3. Neurology
- 9.2.4. Orthopedics
- 9.2.5. Gastroenterology
- 9.2.6. Gynecology
- 9.2.7. Other Applications
- 9.3. Market Analysis, Insights and Forecast - by End-User
- 9.3.1. Hospitals
- 9.3.2. Diagnostic Centers
- 9.3.3. Other End-Users
- 9.1. Market Analysis, Insights and Forecast - by Modality
- 10. Asia Pacific Medical Digital Imaging Devices Industry in China Analysis, Insights and Forecast, 2019-2031
- 10.1. Market Analysis, Insights and Forecast - by Modality
- 10.1.1. MRI
- 10.1.1.1. Low and mid field MRI systems (less than 1.5 T)
- 10.1.1.2. High field MRI systems (1.5-3 T)
- 10.1.1.3. Very Hig
- 10.1.2. Computed Tomography
- 10.1.2.1. Low End Scanners (~16-Slice)
- 10.1.2.2. Mid Range Scanners (~64-Slice)
- 10.1.2.3. High End Scanners (128-Slice and More)
- 10.1.3. Ultrasound
- 10.1.3.1. 2D Ultrasound
- 10.1.3.2. 3D Ultrasound
- 10.1.3.3. Others
- 10.1.4. X-Ray
- 10.1.4.1. Analog Systems
- 10.1.4.2. Digital Systems
- 10.1.5. Nuclear Imaging
- 10.1.5.1. Positron Emission Tomography (PET)
- 10.1.5.2. Single Photon Emission Computed Tomography (SPECT)
- 10.1.6. Fluoroscopy
- 10.1.7. Mammography
- 10.1.1. MRI
- 10.2. Market Analysis, Insights and Forecast - by Application
- 10.2.1. Cardiology
- 10.2.2. Oncology
- 10.2.3. Neurology
- 10.2.4. Orthopedics
- 10.2.5. Gastroenterology
- 10.2.6. Gynecology
- 10.2.7. Other Applications
- 10.3. Market Analysis, Insights and Forecast - by End-User
- 10.3.1. Hospitals
- 10.3.2. Diagnostic Centers
- 10.3.3. Other End-Users
- 10.1. Market Analysis, Insights and Forecast - by Modality
- 11. Competitive Analysis
- 11.1. Global Market Share Analysis 2024
- 11.2. Company Profiles
- 11.2.1 Shimadzu Medical
- 11.2.1.1. Overview
- 11.2.1.2. Products
- 11.2.1.3. SWOT Analysis
- 11.2.1.4. Recent Developments
- 11.2.1.5. Financials (Based on Availability)
- 11.2.2 Siemens Healthcare*List Not Exhaustive
- 11.2.2.1. Overview
- 11.2.2.2. Products
- 11.2.2.3. SWOT Analysis
- 11.2.2.4. Recent Developments
- 11.2.2.5. Financials (Based on Availability)
- 11.2.3 Hitachi Medical Systems
- 11.2.3.1. Overview
- 11.2.3.2. Products
- 11.2.3.3. SWOT Analysis
- 11.2.3.4. Recent Developments
- 11.2.3.5. Financials (Based on Availability)
- 11.2.4 Philips Healthcare
- 11.2.4.1. Overview
- 11.2.4.2. Products
- 11.2.4.3. SWOT Analysis
- 11.2.4.4. Recent Developments
- 11.2.4.5. Financials (Based on Availability)
- 11.2.5 Fujifilm Holding
- 11.2.5.1. Overview
- 11.2.5.2. Products
- 11.2.5.3. SWOT Analysis
- 11.2.5.4. Recent Developments
- 11.2.5.5. Financials (Based on Availability)
- 11.2.6 Canon Medical Systems Corporation
- 11.2.6.1. Overview
- 11.2.6.2. Products
- 11.2.6.3. SWOT Analysis
- 11.2.6.4. Recent Developments
- 11.2.6.5. Financials (Based on Availability)
- 11.2.7 Carestream Health Inc
- 11.2.7.1. Overview
- 11.2.7.2. Products
- 11.2.7.3. SWOT Analysis
- 11.2.7.4. Recent Developments
- 11.2.7.5. Financials (Based on Availability)
- 11.2.8 GE Healthcare (GE Company)
- 11.2.8.1. Overview
- 11.2.8.2. Products
- 11.2.8.3. SWOT Analysis
- 11.2.8.4. Recent Developments
- 11.2.8.5. Financials (Based on Availability)
- 11.2.9 Hologic Corporation
- 11.2.9.1. Overview
- 11.2.9.2. Products
- 11.2.9.3. SWOT Analysis
- 11.2.9.4. Recent Developments
- 11.2.9.5. Financials (Based on Availability)
- 11.2.1 Shimadzu Medical
List of Figures
- Figure 1: Global Medical Digital Imaging Devices Industry in China Revenue Breakdown (Million, %) by Region 2024 & 2032
- Figure 2: China Medical Digital Imaging Devices Industry in China Revenue (Million), by Country 2024 & 2032
- Figure 3: China Medical Digital Imaging Devices Industry in China Revenue Share (%), by Country 2024 & 2032
- Figure 4: North America Medical Digital Imaging Devices Industry in China Revenue (Million), by Modality 2024 & 2032
- Figure 5: North America Medical Digital Imaging Devices Industry in China Revenue Share (%), by Modality 2024 & 2032
- Figure 6: North America Medical Digital Imaging Devices Industry in China Revenue (Million), by Application 2024 & 2032
- Figure 7: North America Medical Digital Imaging Devices Industry in China Revenue Share (%), by Application 2024 & 2032
- Figure 8: North America Medical Digital Imaging Devices Industry in China Revenue (Million), by End-User 2024 & 2032
- Figure 9: North America Medical Digital Imaging Devices Industry in China Revenue Share (%), by End-User 2024 & 2032
- Figure 10: North America Medical Digital Imaging Devices Industry in China Revenue (Million), by Country 2024 & 2032
- Figure 11: North America Medical Digital Imaging Devices Industry in China Revenue Share (%), by Country 2024 & 2032
- Figure 12: South America Medical Digital Imaging Devices Industry in China Revenue (Million), by Modality 2024 & 2032
- Figure 13: South America Medical Digital Imaging Devices Industry in China Revenue Share (%), by Modality 2024 & 2032
- Figure 14: South America Medical Digital Imaging Devices Industry in China Revenue (Million), by Application 2024 & 2032
- Figure 15: South America Medical Digital Imaging Devices Industry in China Revenue Share (%), by Application 2024 & 2032
- Figure 16: South America Medical Digital Imaging Devices Industry in China Revenue (Million), by End-User 2024 & 2032
- Figure 17: South America Medical Digital Imaging Devices Industry in China Revenue Share (%), by End-User 2024 & 2032
- Figure 18: South America Medical Digital Imaging Devices Industry in China Revenue (Million), by Country 2024 & 2032
- Figure 19: South America Medical Digital Imaging Devices Industry in China Revenue Share (%), by Country 2024 & 2032
- Figure 20: Europe Medical Digital Imaging Devices Industry in China Revenue (Million), by Modality 2024 & 2032
- Figure 21: Europe Medical Digital Imaging Devices Industry in China Revenue Share (%), by Modality 2024 & 2032
- Figure 22: Europe Medical Digital Imaging Devices Industry in China Revenue (Million), by Application 2024 & 2032
- Figure 23: Europe Medical Digital Imaging Devices Industry in China Revenue Share (%), by Application 2024 & 2032
- Figure 24: Europe Medical Digital Imaging Devices Industry in China Revenue (Million), by End-User 2024 & 2032
- Figure 25: Europe Medical Digital Imaging Devices Industry in China Revenue Share (%), by End-User 2024 & 2032
- Figure 26: Europe Medical Digital Imaging Devices Industry in China Revenue (Million), by Country 2024 & 2032
- Figure 27: Europe Medical Digital Imaging Devices Industry in China Revenue Share (%), by Country 2024 & 2032
- Figure 28: Middle East & Africa Medical Digital Imaging Devices Industry in China Revenue (Million), by Modality 2024 & 2032
- Figure 29: Middle East & Africa Medical Digital Imaging Devices Industry in China Revenue Share (%), by Modality 2024 & 2032
- Figure 30: Middle East & Africa Medical Digital Imaging Devices Industry in China Revenue (Million), by Application 2024 & 2032
- Figure 31: Middle East & Africa Medical Digital Imaging Devices Industry in China Revenue Share (%), by Application 2024 & 2032
- Figure 32: Middle East & Africa Medical Digital Imaging Devices Industry in China Revenue (Million), by End-User 2024 & 2032
- Figure 33: Middle East & Africa Medical Digital Imaging Devices Industry in China Revenue Share (%), by End-User 2024 & 2032
- Figure 34: Middle East & Africa Medical Digital Imaging Devices Industry in China Revenue (Million), by Country 2024 & 2032
- Figure 35: Middle East & Africa Medical Digital Imaging Devices Industry in China Revenue Share (%), by Country 2024 & 2032
- Figure 36: Asia Pacific Medical Digital Imaging Devices Industry in China Revenue (Million), by Modality 2024 & 2032
- Figure 37: Asia Pacific Medical Digital Imaging Devices Industry in China Revenue Share (%), by Modality 2024 & 2032
- Figure 38: Asia Pacific Medical Digital Imaging Devices Industry in China Revenue (Million), by Application 2024 & 2032
- Figure 39: Asia Pacific Medical Digital Imaging Devices Industry in China Revenue Share (%), by Application 2024 & 2032
- Figure 40: Asia Pacific Medical Digital Imaging Devices Industry in China Revenue (Million), by End-User 2024 & 2032
- Figure 41: Asia Pacific Medical Digital Imaging Devices Industry in China Revenue Share (%), by End-User 2024 & 2032
- Figure 42: Asia Pacific Medical Digital Imaging Devices Industry in China Revenue (Million), by Country 2024 & 2032
- Figure 43: Asia Pacific Medical Digital Imaging Devices Industry in China Revenue Share (%), by Country 2024 & 2032
List of Tables
- Table 1: Global Medical Digital Imaging Devices Industry in China Revenue Million Forecast, by Region 2019 & 2032
- Table 2: Global Medical Digital Imaging Devices Industry in China Revenue Million Forecast, by Modality 2019 & 2032
- Table 3: Global Medical Digital Imaging Devices Industry in China Revenue Million Forecast, by Application 2019 & 2032
- Table 4: Global Medical Digital Imaging Devices Industry in China Revenue Million Forecast, by End-User 2019 & 2032
- Table 5: Global Medical Digital Imaging Devices Industry in China Revenue Million Forecast, by Region 2019 & 2032
- Table 6: Global Medical Digital Imaging Devices Industry in China Revenue Million Forecast, by Country 2019 & 2032
- Table 7: Global Medical Digital Imaging Devices Industry in China Revenue Million Forecast, by Modality 2019 & 2032
- Table 8: Global Medical Digital Imaging Devices Industry in China Revenue Million Forecast, by Application 2019 & 2032
- Table 9: Global Medical Digital Imaging Devices Industry in China Revenue Million Forecast, by End-User 2019 & 2032
- Table 10: Global Medical Digital Imaging Devices Industry in China Revenue Million Forecast, by Country 2019 & 2032
- Table 11: United States Medical Digital Imaging Devices Industry in China Revenue (Million) Forecast, by Application 2019 & 2032
- Table 12: Canada Medical Digital Imaging Devices Industry in China Revenue (Million) Forecast, by Application 2019 & 2032
- Table 13: Mexico Medical Digital Imaging Devices Industry in China Revenue (Million) Forecast, by Application 2019 & 2032
- Table 14: Global Medical Digital Imaging Devices Industry in China Revenue Million Forecast, by Modality 2019 & 2032
- Table 15: Global Medical Digital Imaging Devices Industry in China Revenue Million Forecast, by Application 2019 & 2032
- Table 16: Global Medical Digital Imaging Devices Industry in China Revenue Million Forecast, by End-User 2019 & 2032
- Table 17: Global Medical Digital Imaging Devices Industry in China Revenue Million Forecast, by Country 2019 & 2032
- Table 18: Brazil Medical Digital Imaging Devices Industry in China Revenue (Million) Forecast, by Application 2019 & 2032
- Table 19: Argentina Medical Digital Imaging Devices Industry in China Revenue (Million) Forecast, by Application 2019 & 2032
- Table 20: Rest of South America Medical Digital Imaging Devices Industry in China Revenue (Million) Forecast, by Application 2019 & 2032
- Table 21: Global Medical Digital Imaging Devices Industry in China Revenue Million Forecast, by Modality 2019 & 2032
- Table 22: Global Medical Digital Imaging Devices Industry in China Revenue Million Forecast, by Application 2019 & 2032
- Table 23: Global Medical Digital Imaging Devices Industry in China Revenue Million Forecast, by End-User 2019 & 2032
- Table 24: Global Medical Digital Imaging Devices Industry in China Revenue Million Forecast, by Country 2019 & 2032
- Table 25: United Kingdom Medical Digital Imaging Devices Industry in China Revenue (Million) Forecast, by Application 2019 & 2032
- Table 26: Germany Medical Digital Imaging Devices Industry in China Revenue (Million) Forecast, by Application 2019 & 2032
- Table 27: France Medical Digital Imaging Devices Industry in China Revenue (Million) Forecast, by Application 2019 & 2032
- Table 28: Italy Medical Digital Imaging Devices Industry in China Revenue (Million) Forecast, by Application 2019 & 2032
- Table 29: Spain Medical Digital Imaging Devices Industry in China Revenue (Million) Forecast, by Application 2019 & 2032
- Table 30: Russia Medical Digital Imaging Devices Industry in China Revenue (Million) Forecast, by Application 2019 & 2032
- Table 31: Benelux Medical Digital Imaging Devices Industry in China Revenue (Million) Forecast, by Application 2019 & 2032
- Table 32: Nordics Medical Digital Imaging Devices Industry in China Revenue (Million) Forecast, by Application 2019 & 2032
- Table 33: Rest of Europe Medical Digital Imaging Devices Industry in China Revenue (Million) Forecast, by Application 2019 & 2032
- Table 34: Global Medical Digital Imaging Devices Industry in China Revenue Million Forecast, by Modality 2019 & 2032
- Table 35: Global Medical Digital Imaging Devices Industry in China Revenue Million Forecast, by Application 2019 & 2032
- Table 36: Global Medical Digital Imaging Devices Industry in China Revenue Million Forecast, by End-User 2019 & 2032
- Table 37: Global Medical Digital Imaging Devices Industry in China Revenue Million Forecast, by Country 2019 & 2032
- Table 38: Turkey Medical Digital Imaging Devices Industry in China Revenue (Million) Forecast, by Application 2019 & 2032
- Table 39: Israel Medical Digital Imaging Devices Industry in China Revenue (Million) Forecast, by Application 2019 & 2032
- Table 40: GCC Medical Digital Imaging Devices Industry in China Revenue (Million) Forecast, by Application 2019 & 2032
- Table 41: North Africa Medical Digital Imaging Devices Industry in China Revenue (Million) Forecast, by Application 2019 & 2032
- Table 42: South Africa Medical Digital Imaging Devices Industry in China Revenue (Million) Forecast, by Application 2019 & 2032
- Table 43: Rest of Middle East & Africa Medical Digital Imaging Devices Industry in China Revenue (Million) Forecast, by Application 2019 & 2032
- Table 44: Global Medical Digital Imaging Devices Industry in China Revenue Million Forecast, by Modality 2019 & 2032
- Table 45: Global Medical Digital Imaging Devices Industry in China Revenue Million Forecast, by Application 2019 & 2032
- Table 46: Global Medical Digital Imaging Devices Industry in China Revenue Million Forecast, by End-User 2019 & 2032
- Table 47: Global Medical Digital Imaging Devices Industry in China Revenue Million Forecast, by Country 2019 & 2032
- Table 48: China Medical Digital Imaging Devices Industry in China Revenue (Million) Forecast, by Application 2019 & 2032
- Table 49: India Medical Digital Imaging Devices Industry in China Revenue (Million) Forecast, by Application 2019 & 2032
- Table 50: Japan Medical Digital Imaging Devices Industry in China Revenue (Million) Forecast, by Application 2019 & 2032
- Table 51: South Korea Medical Digital Imaging Devices Industry in China Revenue (Million) Forecast, by Application 2019 & 2032
- Table 52: ASEAN Medical Digital Imaging Devices Industry in China Revenue (Million) Forecast, by Application 2019 & 2032
- Table 53: Oceania Medical Digital Imaging Devices Industry in China Revenue (Million) Forecast, by Application 2019 & 2032
- Table 54: Rest of Asia Pacific Medical Digital Imaging Devices Industry in China Revenue (Million) Forecast, by Application 2019 & 2032
Frequently Asked Questions
1. What is the projected Compound Annual Growth Rate (CAGR) of the Medical Digital Imaging Devices Industry in China?
The projected CAGR is approximately 11.30%.
2. Which companies are prominent players in the Medical Digital Imaging Devices Industry in China?
Key companies in the market include Shimadzu Medical, Siemens Healthcare*List Not Exhaustive, Hitachi Medical Systems, Philips Healthcare, Fujifilm Holding, Canon Medical Systems Corporation, Carestream Health Inc, GE Healthcare (GE Company), Hologic Corporation.
3. What are the main segments of the Medical Digital Imaging Devices Industry in China?
The market segments include Modality, Application, End-User.
4. Can you provide details about the market size?
The market size is estimated to be USD XX Million as of 2022.
5. What are some drivers contributing to market growth?
; Rise in the Prevalence of Chronic Diseases; Growing Geriatric Population; Increased Adoption of Advanced Technologies in Medical Imaging.
6. What are the notable trends driving market growth?
Oncology Segment is Expected to Hold a Major Market Share in the China Diagnostic Imaging Market.
7. Are there any restraints impacting market growth?
; High Costs Associated With the Devices; Side Effects of Diagnostic Imaging Procedures.
8. Can you provide examples of recent developments in the market?
N/A
9. What pricing options are available for accessing the report?
Pricing options include single-user, multi-user, and enterprise licenses priced at USD 3800, USD 4500, and USD 5800 respectively.
10. Is the market size provided in terms of value or volume?
The market size is provided in terms of value, measured in Million.
11. Are there any specific market keywords associated with the report?
Yes, the market keyword associated with the report is "Medical Digital Imaging Devices Industry in China," which aids in identifying and referencing the specific market segment covered.
12. How do I determine which pricing option suits my needs best?
The pricing options vary based on user requirements and access needs. Individual users may opt for single-user licenses, while businesses requiring broader access may choose multi-user or enterprise licenses for cost-effective access to the report.
13. Are there any additional resources or data provided in the Medical Digital Imaging Devices Industry in China report?
While the report offers comprehensive insights, it's advisable to review the specific contents or supplementary materials provided to ascertain if additional resources or data are available.
14. How can I stay updated on further developments or reports in the Medical Digital Imaging Devices Industry in China?
To stay informed about further developments, trends, and reports in the Medical Digital Imaging Devices Industry in China, consider subscribing to industry newsletters, following relevant companies and organizations, or regularly checking reputable industry news sources and publications.
Methodology
Step 1 - Identification of Relevant Samples Size from Population Database


Step 2 - Approaches for Defining Global Market Size (Value, Volume* & Price*)

Note*: In applicable scenarios
Step 3 - Data Sources
Primary Research
- Web Analytics
- Survey Reports
- Research Institute
- Latest Research Reports
- Opinion Leaders
Secondary Research
- Annual Reports
- White Paper
- Latest Press Release
- Industry Association
- Paid Database
- Investor Presentations

Step 4 - Data Triangulation
Involves using different sources of information in order to increase the validity of a study
These sources are likely to be stakeholders in a program - participants, other researchers, program staff, other community members, and so on.
Then we put all data in single framework & apply various statistical tools to find out the dynamic on the market.
During the analysis stage, feedback from the stakeholder groups would be compared to determine areas of agreement as well as areas of divergence


