
Key Insights
The global medical biomimetics market is experiencing robust growth, projected to reach a substantial size driven by increasing demand for advanced medical treatments and innovative healthcare solutions. The market's 5.70% CAGR from 2019-2033 indicates a significant expansion, fueled primarily by advancements in materials science and bioengineering, enabling the creation of biocompatible implants and devices that closely mimic natural tissues and organs. Key application areas, such as orthopedic, ophthalmology, and dental biomimetics, are witnessing rapid adoption due to improved patient outcomes and reduced recovery times compared to traditional methods. The rising prevalence of chronic diseases and an aging global population further contribute to market expansion. Significant investments in research and development by both established pharmaceutical companies and emerging biotech firms are accelerating innovation and driving the development of novel biomimetic products. The market is segmented by product type (orthopedic, ophthalmology, dental, and others) and application (plastic surgery, wound healing, tissue engineering, and others), providing diverse avenues for growth. Geographic distribution reveals strong growth across North America and Europe, with emerging markets in Asia-Pacific showing significant potential. Regulatory approvals and intellectual property protection present challenges, alongside the high cost of research and development and potential manufacturing complexities. However, the overall market outlook remains highly positive, with continued technological advancements and increasing healthcare spending contributing to sustained growth.
The orthopedic segment within medical biomimetics currently dominates the market share, driven by the high prevalence of bone fractures and joint replacements, followed by the ophthalmology sector focusing on corneal implants and other vision-correcting devices. The increasing focus on minimally invasive procedures and personalized medicine is further stimulating growth. The tissue engineering segment is expected to witness substantial growth in the coming years, owing to its potential for regenerative medicine applications. While North America holds the largest regional market share currently due to robust healthcare infrastructure and advanced medical technology, the Asia-Pacific region, particularly China and India, is poised for rapid expansion due to the rising middle class and improving healthcare access. Strategic partnerships between research institutions, medical device companies and pharmaceutical companies are crucial for driving innovation, fostering collaborative research, and accelerating the commercialization of new biomimetic technologies. This collaborative approach will be essential in overcoming hurdles associated with regulatory approvals and high development costs.
Medical Biomimetics Market: A Billion-Dollar Growth Forecast (2019-2033)
This comprehensive report provides an in-depth analysis of the global medical biomimetics market, projecting a multi-billion-dollar valuation by 2033. We delve into market structure, competitive dynamics, industry trends, and key players, offering actionable insights for businesses and investors. The study period covers 2019-2033, with 2025 as the base and estimated year. This report is invaluable for understanding the evolving landscape of medical biomimetics and capitalizing on its immense potential.
Medical Biomimetics Market Structure & Competitive Dynamics
The medical biomimetics market is characterized by a dynamic interplay of established players and emerging innovators. Market concentration is currently moderate, with several key players holding significant shares, but a fragmented landscape offering opportunities for new entrants. Innovation ecosystems are vibrant, fueled by collaborative research initiatives between universities, research institutions like Forschungszentrum Jülich, and private companies. Regulatory frameworks vary across geographies, influencing product development and market access. Product substitutes, such as traditional medical implants and treatments, exert competitive pressure, requiring biomimetic solutions to demonstrate clear advantages in terms of efficacy and safety. End-user trends favor minimally invasive procedures and personalized medicine, driving demand for advanced biomimetic devices and therapies. M&A activity in the sector is expected to increase as larger companies seek to acquire smaller, innovative firms. In the past five years (2019-2024), the estimated value of M&A deals totaled approximately $xx billion, with an average deal size of $xx billion. Key players such as Abbott are actively involved in strategic acquisitions to expand their portfolios and market share.
- Market Share Concentration: Moderate (xx%)
- Average M&A Deal Value (2019-2024): $xx billion
- Number of M&A Deals (2019-2024): xx
- Major Players: Abbott, Blatchford Ltd, Applied Biomimetic, Biomimetic Solutions, SynTouch Inc, Skyland Brand Ventures, CellCore, Avinent Science and Technology, Veryan Medical
Medical Biomimetics Industry Trends & Insights
The medical biomimetics market is experiencing robust growth, driven by factors such as the increasing prevalence of chronic diseases, rising demand for minimally invasive surgeries, and advancements in materials science and nanotechnology. The compound annual growth rate (CAGR) from 2025 to 2033 is projected to be xx%, reaching a market value of $xx billion by 2033. Technological advancements, including 3D printing and bioprinting, are revolutionizing the design and manufacturing of biomimetic implants and scaffolds. Consumer preferences are shifting towards personalized therapies and improved patient outcomes, which are being met by customized biomimetic devices and regenerative medicine solutions. The market penetration of biomimetic solutions varies across different applications, with higher penetration rates observed in areas like orthopedic implants and wound healing. However, opportunities exist in expanding into new application areas, particularly in tissue engineering and drug delivery. Competitive dynamics are intensifying with both established players and start-ups innovating rapidly. The development of new biomaterials with enhanced biocompatibility and functionality is a critical area of focus for several companies.
Dominant Markets & Segments in Medical Biomimetics
The orthopedic segment currently holds the largest market share within medical biomimetics, driven by a high incidence of musculoskeletal disorders and the increasing demand for advanced implants. The North American region is projected to lead in market value, fueled by robust healthcare infrastructure, higher healthcare spending, and significant R&D investments.
Key Drivers for Orthopedic Dominance:
- High prevalence of osteoarthritis and other musculoskeletal disorders.
- Demand for minimally invasive surgical procedures and improved implant designs.
- Technological advancements in biomaterials and implant design.
- Significant R&D investment in the region.
Other Dominant Segments and Their Drivers:
- Ophthalmology: Growing prevalence of age-related macular degeneration and other eye diseases, demand for advanced intraocular lenses, and improved visual acuity.
- Dental: Increasing demand for dental implants and restorative materials, preference for minimally invasive procedures, and aesthetic considerations.
- Wound Healing: High prevalence of chronic wounds, demand for faster healing times, and reduced scarring, along with advanced wound care products.
- Tissue Engineering: Growing interest in regenerative medicine, advances in cell therapies, and demand for customized tissue grafts.
- Plastic Surgery: Increased demand for cosmetic procedures, improved aesthetic outcomes, and minimally invasive techniques.
Medical Biomimetics Product Innovations
Recent advancements in medical biomimetics have focused on developing biocompatible materials with enhanced mechanical properties, integrating smart sensors into implants for real-time monitoring, and utilizing 3D printing for customized medical devices. The integration of nanotechnology enables the creation of highly functional and responsive materials, improving biointegration and drug delivery. These innovations address market needs for enhanced efficacy, improved patient outcomes, and reduced risks associated with traditional medical implants.
Report Segmentation & Scope
This report segments the medical biomimetics market by product type (orthopedic, ophthalmology, dental, others) and application (plastic surgery, wound healing, tissue engineering, others). Each segment is analyzed based on its market size, growth projections, and competitive landscape. The report also considers regional variations and identifies key drivers and challenges for each segment. Growth projections are provided for each segment from 2025 to 2033, detailing market size and competitive intensity.
Key Drivers of Medical Biomimetics Growth
The medical biomimetics market is experiencing rapid growth due to several factors:
- Technological advancements in biomaterials science, nanotechnology, and 3D printing.
- Increasing prevalence of chronic diseases necessitating advanced medical treatments.
- Growing demand for minimally invasive surgical procedures and personalized medicine.
- Favorable regulatory environments in several key markets accelerating product approvals.
Challenges in the Medical Biomimetics Sector
Despite the high growth potential, the medical biomimetics sector faces several challenges including:
- High R&D costs and long approval timelines for new products.
- Stringent regulatory requirements for medical devices and biomaterials.
- Potential supply chain disruptions affecting the availability of raw materials.
- Competition from existing medical technologies and therapies. The estimated impact of these challenges on market growth is approximately xx% reduction in CAGR.
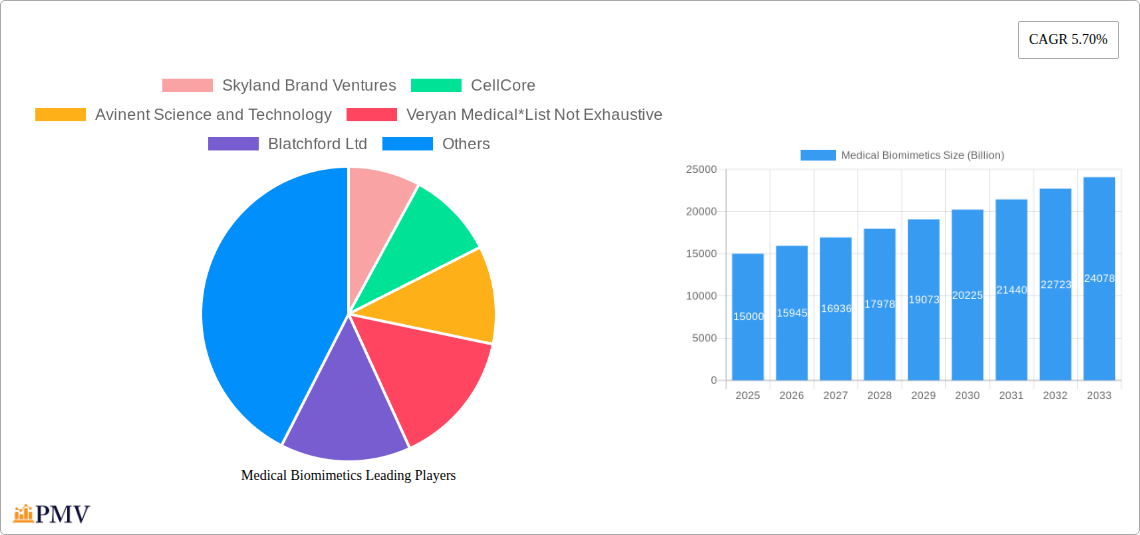
Leading Players in the Medical Biomimetics Market
- Skyland Brand Ventures
- CellCore
- Avinent Science and Technology
- Veryan Medical
- Blatchford Ltd
- Applied Biomimetic
- Biomimetic Solutions
- SynTouch Inc
- Abbott
- Forschungszentrum Jülich
Key Developments in Medical Biomimetics Sector
- 2022 Q4: Abbott announces a significant investment in biomimetic stent technology.
- 2023 Q1: Avinent Science and Technology launches a new line of biomimetic dental implants.
- 2023 Q3: Blatchford Ltd secures a patent for a novel biomimetic prosthetic material.
- 2024 Q2: Collaboration between Forschungszentrum Jülich and a private company leads to a breakthrough in biomaterial development. (Further details are not available, please refer to the complete report.)
Strategic Medical Biomimetics Market Outlook
The future of the medical biomimetics market is promising, with continued growth driven by technological innovation and expanding applications. Strategic opportunities exist in developing next-generation biomaterials, expanding into new therapeutic areas, and fostering collaborations to accelerate product development. The market's potential is significant, presenting lucrative investment prospects for businesses willing to navigate the challenges and capitalize on emerging trends. The projected market size will exceed $xx billion by 2033, offering substantial growth potential for strategic investors and market participants.
Medical Biomimetics Segmentation
-
1. Product Type
- 1.1. Orthopedic
- 1.2. Ophthalmology
- 1.3. Dental
- 1.4. Others
-
2. Application
- 2.1. Plastic Surgery
- 2.2. Wound Healing
- 2.3. Tissue Engineering
- 2.4. Others
Medical Biomimetics Segmentation By Geography
-
1. North America
- 1.1. United States
- 1.2. Canada
- 1.3. Mexico
-
2. Europe
- 2.1. Germany
- 2.2. United Kingdom
- 2.3. France
- 2.4. Italy
- 2.5. Spain
- 2.6. Rest of Europe
-
3. Asia Pacific
- 3.1. China
- 3.2. Japan
- 3.3. India
- 3.4. Australia
- 3.5. South Korea
- 3.6. Rest of Asia Pacific
- 4. Rest of the World
Medical Biomimetics REPORT HIGHLIGHTS
| Aspects | Details |
|---|---|
| Study Period | 2019-2033 |
| Base Year | 2024 |
| Estimated Year | 2025 |
| Forecast Period | 2025-2033 |
| Historical Period | 2019-2024 |
| Growth Rate | CAGR of 5.70% from 2019-2033 |
| Segmentation |
|
Table of Contents
- 1. Introduction
- 1.1. Research Scope
- 1.2. Market Segmentation
- 1.3. Research Methodology
- 1.4. Definitions and Assumptions
- 2. Executive Summary
- 2.1. Introduction
- 3. Market Dynamics
- 3.1. Introduction
- 3.2. Market Drivers
- 3.2.1. ; Growing Advancement in Nanotechnology; Growing Tissue Engineering Market
- 3.3. Market Restrains
- 3.3.1. Stringent Regulatory Framework
- 3.4. Market Trends
- 3.4.1. Orthopaedic is Expected to Exhibit a Significant Growth Over the Forecast Period
- 4. Market Factor Analysis
- 4.1. Porters Five Forces
- 4.2. Supply/Value Chain
- 4.3. PESTEL analysis
- 4.4. Market Entropy
- 4.5. Patent/Trademark Analysis
- 5. Global Medical Biomimetics Analysis, Insights and Forecast, 2019-2031
- 5.1. Market Analysis, Insights and Forecast - by Product Type
- 5.1.1. Orthopedic
- 5.1.2. Ophthalmology
- 5.1.3. Dental
- 5.1.4. Others
- 5.2. Market Analysis, Insights and Forecast - by Application
- 5.2.1. Plastic Surgery
- 5.2.2. Wound Healing
- 5.2.3. Tissue Engineering
- 5.2.4. Others
- 5.3. Market Analysis, Insights and Forecast - by Region
- 5.3.1. North America
- 5.3.2. Europe
- 5.3.3. Asia Pacific
- 5.3.4. Rest of the World
- 5.1. Market Analysis, Insights and Forecast - by Product Type
- 6. North America Medical Biomimetics Analysis, Insights and Forecast, 2019-2031
- 6.1. Market Analysis, Insights and Forecast - by Product Type
- 6.1.1. Orthopedic
- 6.1.2. Ophthalmology
- 6.1.3. Dental
- 6.1.4. Others
- 6.2. Market Analysis, Insights and Forecast - by Application
- 6.2.1. Plastic Surgery
- 6.2.2. Wound Healing
- 6.2.3. Tissue Engineering
- 6.2.4. Others
- 6.1. Market Analysis, Insights and Forecast - by Product Type
- 7. Europe Medical Biomimetics Analysis, Insights and Forecast, 2019-2031
- 7.1. Market Analysis, Insights and Forecast - by Product Type
- 7.1.1. Orthopedic
- 7.1.2. Ophthalmology
- 7.1.3. Dental
- 7.1.4. Others
- 7.2. Market Analysis, Insights and Forecast - by Application
- 7.2.1. Plastic Surgery
- 7.2.2. Wound Healing
- 7.2.3. Tissue Engineering
- 7.2.4. Others
- 7.1. Market Analysis, Insights and Forecast - by Product Type
- 8. Asia Pacific Medical Biomimetics Analysis, Insights and Forecast, 2019-2031
- 8.1. Market Analysis, Insights and Forecast - by Product Type
- 8.1.1. Orthopedic
- 8.1.2. Ophthalmology
- 8.1.3. Dental
- 8.1.4. Others
- 8.2. Market Analysis, Insights and Forecast - by Application
- 8.2.1. Plastic Surgery
- 8.2.2. Wound Healing
- 8.2.3. Tissue Engineering
- 8.2.4. Others
- 8.1. Market Analysis, Insights and Forecast - by Product Type
- 9. Rest of the World Medical Biomimetics Analysis, Insights and Forecast, 2019-2031
- 9.1. Market Analysis, Insights and Forecast - by Product Type
- 9.1.1. Orthopedic
- 9.1.2. Ophthalmology
- 9.1.3. Dental
- 9.1.4. Others
- 9.2. Market Analysis, Insights and Forecast - by Application
- 9.2.1. Plastic Surgery
- 9.2.2. Wound Healing
- 9.2.3. Tissue Engineering
- 9.2.4. Others
- 9.1. Market Analysis, Insights and Forecast - by Product Type
- 10. North America Medical Biomimetics Analysis, Insights and Forecast, 2019-2031
- 10.1. Market Analysis, Insights and Forecast - By Country/Sub-region
- 10.1.1 United States
- 10.1.2 Canada
- 10.1.3 Mexico
- 11. South America Medical Biomimetics Analysis, Insights and Forecast, 2019-2031
- 11.1. Market Analysis, Insights and Forecast - By Country/Sub-region
- 11.1.1 Brazil
- 11.1.2 Mexico
- 11.1.3 Rest of South America
- 12. Europe Medical Biomimetics Analysis, Insights and Forecast, 2019-2031
- 12.1. Market Analysis, Insights and Forecast - By Country/Sub-region
- 12.1.1 Germany
- 12.1.2 United Kingdom
- 12.1.3 France
- 12.1.4 Italy
- 12.1.5 Spain
- 12.1.6 Rest of Europe
- 13. Asia Pacific Medical Biomimetics Analysis, Insights and Forecast, 2019-2031
- 13.1. Market Analysis, Insights and Forecast - By Country/Sub-region
- 13.1.1 China
- 13.1.2 Japan
- 13.1.3 India
- 13.1.4 South Korea
- 13.1.5 Taiwan
- 13.1.6 Australia
- 13.1.7 Rest of Asia-Pacific
- 14. MEA Medical Biomimetics Analysis, Insights and Forecast, 2019-2031
- 14.1. Market Analysis, Insights and Forecast - By Country/Sub-region
- 14.1.1 Middle East
- 14.1.2 Africa
- 15. Competitive Analysis
- 15.1. Global Market Share Analysis 2024
- 15.2. Company Profiles
- 15.2.1 Skyland Brand Ventures
- 15.2.1.1. Overview
- 15.2.1.2. Products
- 15.2.1.3. SWOT Analysis
- 15.2.1.4. Recent Developments
- 15.2.1.5. Financials (Based on Availability)
- 15.2.2 CellCore
- 15.2.2.1. Overview
- 15.2.2.2. Products
- 15.2.2.3. SWOT Analysis
- 15.2.2.4. Recent Developments
- 15.2.2.5. Financials (Based on Availability)
- 15.2.3 Avinent Science and Technology
- 15.2.3.1. Overview
- 15.2.3.2. Products
- 15.2.3.3. SWOT Analysis
- 15.2.3.4. Recent Developments
- 15.2.3.5. Financials (Based on Availability)
- 15.2.4 Veryan Medical*List Not Exhaustive
- 15.2.4.1. Overview
- 15.2.4.2. Products
- 15.2.4.3. SWOT Analysis
- 15.2.4.4. Recent Developments
- 15.2.4.5. Financials (Based on Availability)
- 15.2.5 Blatchford Ltd
- 15.2.5.1. Overview
- 15.2.5.2. Products
- 15.2.5.3. SWOT Analysis
- 15.2.5.4. Recent Developments
- 15.2.5.5. Financials (Based on Availability)
- 15.2.6 Applied Biomimetic
- 15.2.6.1. Overview
- 15.2.6.2. Products
- 15.2.6.3. SWOT Analysis
- 15.2.6.4. Recent Developments
- 15.2.6.5. Financials (Based on Availability)
- 15.2.7 Biomimetic Solutions
- 15.2.7.1. Overview
- 15.2.7.2. Products
- 15.2.7.3. SWOT Analysis
- 15.2.7.4. Recent Developments
- 15.2.7.5. Financials (Based on Availability)
- 15.2.8 SynTouch Inc
- 15.2.8.1. Overview
- 15.2.8.2. Products
- 15.2.8.3. SWOT Analysis
- 15.2.8.4. Recent Developments
- 15.2.8.5. Financials (Based on Availability)
- 15.2.9 Abbott
- 15.2.9.1. Overview
- 15.2.9.2. Products
- 15.2.9.3. SWOT Analysis
- 15.2.9.4. Recent Developments
- 15.2.9.5. Financials (Based on Availability)
- 15.2.10 Forschungszentrum Jlich
- 15.2.10.1. Overview
- 15.2.10.2. Products
- 15.2.10.3. SWOT Analysis
- 15.2.10.4. Recent Developments
- 15.2.10.5. Financials (Based on Availability)
- 15.2.1 Skyland Brand Ventures
List of Figures
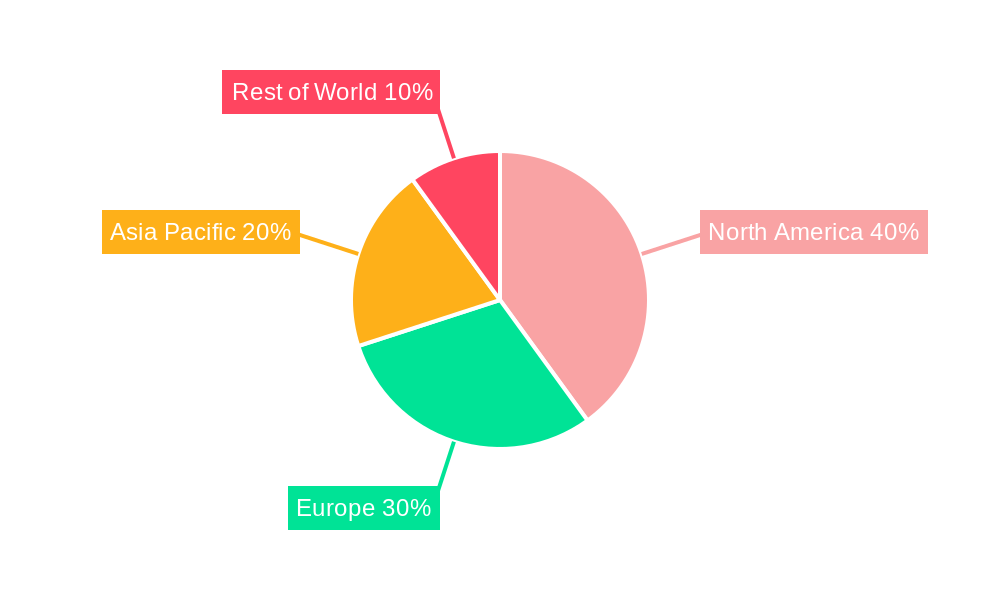
- Figure 1: Global Medical Biomimetics Revenue Breakdown (Billion, %) by Region 2024 & 2032
- Figure 2: North America Medical Biomimetics Revenue (Billion), by Country 2024 & 2032
- Figure 3: North America Medical Biomimetics Revenue Share (%), by Country 2024 & 2032
- Figure 4: South America Medical Biomimetics Revenue (Billion), by Country 2024 & 2032
- Figure 5: South America Medical Biomimetics Revenue Share (%), by Country 2024 & 2032
- Figure 6: Europe Medical Biomimetics Revenue (Billion), by Country 2024 & 2032
- Figure 7: Europe Medical Biomimetics Revenue Share (%), by Country 2024 & 2032
- Figure 8: Asia Pacific Medical Biomimetics Revenue (Billion), by Country 2024 & 2032
- Figure 9: Asia Pacific Medical Biomimetics Revenue Share (%), by Country 2024 & 2032
- Figure 10: MEA Medical Biomimetics Revenue (Billion), by Country 2024 & 2032
- Figure 11: MEA Medical Biomimetics Revenue Share (%), by Country 2024 & 2032
- Figure 12: North America Medical Biomimetics Revenue (Billion), by Product Type 2024 & 2032
- Figure 13: North America Medical Biomimetics Revenue Share (%), by Product Type 2024 & 2032
- Figure 14: North America Medical Biomimetics Revenue (Billion), by Application 2024 & 2032
- Figure 15: North America Medical Biomimetics Revenue Share (%), by Application 2024 & 2032
- Figure 16: North America Medical Biomimetics Revenue (Billion), by Country 2024 & 2032
- Figure 17: North America Medical Biomimetics Revenue Share (%), by Country 2024 & 2032
- Figure 18: Europe Medical Biomimetics Revenue (Billion), by Product Type 2024 & 2032
- Figure 19: Europe Medical Biomimetics Revenue Share (%), by Product Type 2024 & 2032
- Figure 20: Europe Medical Biomimetics Revenue (Billion), by Application 2024 & 2032
- Figure 21: Europe Medical Biomimetics Revenue Share (%), by Application 2024 & 2032
- Figure 22: Europe Medical Biomimetics Revenue (Billion), by Country 2024 & 2032
- Figure 23: Europe Medical Biomimetics Revenue Share (%), by Country 2024 & 2032
- Figure 24: Asia Pacific Medical Biomimetics Revenue (Billion), by Product Type 2024 & 2032
- Figure 25: Asia Pacific Medical Biomimetics Revenue Share (%), by Product Type 2024 & 2032
- Figure 26: Asia Pacific Medical Biomimetics Revenue (Billion), by Application 2024 & 2032
- Figure 27: Asia Pacific Medical Biomimetics Revenue Share (%), by Application 2024 & 2032
- Figure 28: Asia Pacific Medical Biomimetics Revenue (Billion), by Country 2024 & 2032
- Figure 29: Asia Pacific Medical Biomimetics Revenue Share (%), by Country 2024 & 2032
- Figure 30: Rest of the World Medical Biomimetics Revenue (Billion), by Product Type 2024 & 2032
- Figure 31: Rest of the World Medical Biomimetics Revenue Share (%), by Product Type 2024 & 2032
- Figure 32: Rest of the World Medical Biomimetics Revenue (Billion), by Application 2024 & 2032
- Figure 33: Rest of the World Medical Biomimetics Revenue Share (%), by Application 2024 & 2032
- Figure 34: Rest of the World Medical Biomimetics Revenue (Billion), by Country 2024 & 2032
- Figure 35: Rest of the World Medical Biomimetics Revenue Share (%), by Country 2024 & 2032
List of Tables
- Table 1: Global Medical Biomimetics Revenue Billion Forecast, by Region 2019 & 2032
- Table 2: Global Medical Biomimetics Revenue Billion Forecast, by Product Type 2019 & 2032
- Table 3: Global Medical Biomimetics Revenue Billion Forecast, by Application 2019 & 2032
- Table 4: Global Medical Biomimetics Revenue Billion Forecast, by Region 2019 & 2032
- Table 5: Global Medical Biomimetics Revenue Billion Forecast, by Country 2019 & 2032
- Table 6: United States Medical Biomimetics Revenue (Billion) Forecast, by Application 2019 & 2032
- Table 7: Canada Medical Biomimetics Revenue (Billion) Forecast, by Application 2019 & 2032
- Table 8: Mexico Medical Biomimetics Revenue (Billion) Forecast, by Application 2019 & 2032
- Table 9: Global Medical Biomimetics Revenue Billion Forecast, by Country 2019 & 2032
- Table 10: Brazil Medical Biomimetics Revenue (Billion) Forecast, by Application 2019 & 2032
- Table 11: Mexico Medical Biomimetics Revenue (Billion) Forecast, by Application 2019 & 2032
- Table 12: Rest of South America Medical Biomimetics Revenue (Billion) Forecast, by Application 2019 & 2032
- Table 13: Global Medical Biomimetics Revenue Billion Forecast, by Country 2019 & 2032
- Table 14: Germany Medical Biomimetics Revenue (Billion) Forecast, by Application 2019 & 2032
- Table 15: United Kingdom Medical Biomimetics Revenue (Billion) Forecast, by Application 2019 & 2032
- Table 16: France Medical Biomimetics Revenue (Billion) Forecast, by Application 2019 & 2032
- Table 17: Italy Medical Biomimetics Revenue (Billion) Forecast, by Application 2019 & 2032
- Table 18: Spain Medical Biomimetics Revenue (Billion) Forecast, by Application 2019 & 2032
- Table 19: Rest of Europe Medical Biomimetics Revenue (Billion) Forecast, by Application 2019 & 2032
- Table 20: Global Medical Biomimetics Revenue Billion Forecast, by Country 2019 & 2032
- Table 21: China Medical Biomimetics Revenue (Billion) Forecast, by Application 2019 & 2032
- Table 22: Japan Medical Biomimetics Revenue (Billion) Forecast, by Application 2019 & 2032
- Table 23: India Medical Biomimetics Revenue (Billion) Forecast, by Application 2019 & 2032
- Table 24: South Korea Medical Biomimetics Revenue (Billion) Forecast, by Application 2019 & 2032
- Table 25: Taiwan Medical Biomimetics Revenue (Billion) Forecast, by Application 2019 & 2032
- Table 26: Australia Medical Biomimetics Revenue (Billion) Forecast, by Application 2019 & 2032
- Table 27: Rest of Asia-Pacific Medical Biomimetics Revenue (Billion) Forecast, by Application 2019 & 2032
- Table 28: Global Medical Biomimetics Revenue Billion Forecast, by Country 2019 & 2032
- Table 29: Middle East Medical Biomimetics Revenue (Billion) Forecast, by Application 2019 & 2032
- Table 30: Africa Medical Biomimetics Revenue (Billion) Forecast, by Application 2019 & 2032
- Table 31: Global Medical Biomimetics Revenue Billion Forecast, by Product Type 2019 & 2032
- Table 32: Global Medical Biomimetics Revenue Billion Forecast, by Application 2019 & 2032
- Table 33: Global Medical Biomimetics Revenue Billion Forecast, by Country 2019 & 2032
- Table 34: United States Medical Biomimetics Revenue (Billion) Forecast, by Application 2019 & 2032
- Table 35: Canada Medical Biomimetics Revenue (Billion) Forecast, by Application 2019 & 2032
- Table 36: Mexico Medical Biomimetics Revenue (Billion) Forecast, by Application 2019 & 2032
- Table 37: Global Medical Biomimetics Revenue Billion Forecast, by Product Type 2019 & 2032
- Table 38: Global Medical Biomimetics Revenue Billion Forecast, by Application 2019 & 2032
- Table 39: Global Medical Biomimetics Revenue Billion Forecast, by Country 2019 & 2032
- Table 40: Germany Medical Biomimetics Revenue (Billion) Forecast, by Application 2019 & 2032
- Table 41: United Kingdom Medical Biomimetics Revenue (Billion) Forecast, by Application 2019 & 2032
- Table 42: France Medical Biomimetics Revenue (Billion) Forecast, by Application 2019 & 2032
- Table 43: Italy Medical Biomimetics Revenue (Billion) Forecast, by Application 2019 & 2032
- Table 44: Spain Medical Biomimetics Revenue (Billion) Forecast, by Application 2019 & 2032
- Table 45: Rest of Europe Medical Biomimetics Revenue (Billion) Forecast, by Application 2019 & 2032
- Table 46: Global Medical Biomimetics Revenue Billion Forecast, by Product Type 2019 & 2032
- Table 47: Global Medical Biomimetics Revenue Billion Forecast, by Application 2019 & 2032
- Table 48: Global Medical Biomimetics Revenue Billion Forecast, by Country 2019 & 2032
- Table 49: China Medical Biomimetics Revenue (Billion) Forecast, by Application 2019 & 2032
- Table 50: Japan Medical Biomimetics Revenue (Billion) Forecast, by Application 2019 & 2032
- Table 51: India Medical Biomimetics Revenue (Billion) Forecast, by Application 2019 & 2032
- Table 52: Australia Medical Biomimetics Revenue (Billion) Forecast, by Application 2019 & 2032
- Table 53: South Korea Medical Biomimetics Revenue (Billion) Forecast, by Application 2019 & 2032
- Table 54: Rest of Asia Pacific Medical Biomimetics Revenue (Billion) Forecast, by Application 2019 & 2032
- Table 55: Global Medical Biomimetics Revenue Billion Forecast, by Product Type 2019 & 2032
- Table 56: Global Medical Biomimetics Revenue Billion Forecast, by Application 2019 & 2032
- Table 57: Global Medical Biomimetics Revenue Billion Forecast, by Country 2019 & 2032
Frequently Asked Questions
1. What is the projected Compound Annual Growth Rate (CAGR) of the Medical Biomimetics?
The projected CAGR is approximately 5.70%.
2. Which companies are prominent players in the Medical Biomimetics?
Key companies in the market include Skyland Brand Ventures, CellCore, Avinent Science and Technology, Veryan Medical*List Not Exhaustive, Blatchford Ltd, Applied Biomimetic, Biomimetic Solutions, SynTouch Inc, Abbott, Forschungszentrum Jlich.
3. What are the main segments of the Medical Biomimetics?
The market segments include Product Type, Application.
4. Can you provide details about the market size?
The market size is estimated to be USD XX Billion as of 2022.
5. What are some drivers contributing to market growth?
; Growing Advancement in Nanotechnology; Growing Tissue Engineering Market.
6. What are the notable trends driving market growth?
Orthopaedic is Expected to Exhibit a Significant Growth Over the Forecast Period.
7. Are there any restraints impacting market growth?
Stringent Regulatory Framework.
8. Can you provide examples of recent developments in the market?
N/A
9. What pricing options are available for accessing the report?
Pricing options include single-user, multi-user, and enterprise licenses priced at USD 4750, USD 5250, and USD 8750 respectively.
10. Is the market size provided in terms of value or volume?
The market size is provided in terms of value, measured in Billion.
11. Are there any specific market keywords associated with the report?
Yes, the market keyword associated with the report is "Medical Biomimetics," which aids in identifying and referencing the specific market segment covered.
12. How do I determine which pricing option suits my needs best?
The pricing options vary based on user requirements and access needs. Individual users may opt for single-user licenses, while businesses requiring broader access may choose multi-user or enterprise licenses for cost-effective access to the report.
13. Are there any additional resources or data provided in the Medical Biomimetics report?
While the report offers comprehensive insights, it's advisable to review the specific contents or supplementary materials provided to ascertain if additional resources or data are available.
14. How can I stay updated on further developments or reports in the Medical Biomimetics?
To stay informed about further developments, trends, and reports in the Medical Biomimetics, consider subscribing to industry newsletters, following relevant companies and organizations, or regularly checking reputable industry news sources and publications.
Methodology
Step 1 - Identification of Relevant Samples Size from Population Database


Step 2 - Approaches for Defining Global Market Size (Value, Volume* & Price*)

Note*: In applicable scenarios
Step 3 - Data Sources
Primary Research
- Web Analytics
- Survey Reports
- Research Institute
- Latest Research Reports
- Opinion Leaders
Secondary Research
- Annual Reports
- White Paper
- Latest Press Release
- Industry Association
- Paid Database
- Investor Presentations

Step 4 - Data Triangulation
Involves using different sources of information in order to increase the validity of a study
These sources are likely to be stakeholders in a program - participants, other researchers, program staff, other community members, and so on.
Then we put all data in single framework & apply various statistical tools to find out the dynamic on the market.
During the analysis stage, feedback from the stakeholder groups would be compared to determine areas of agreement as well as areas of divergence


