
Key Insights
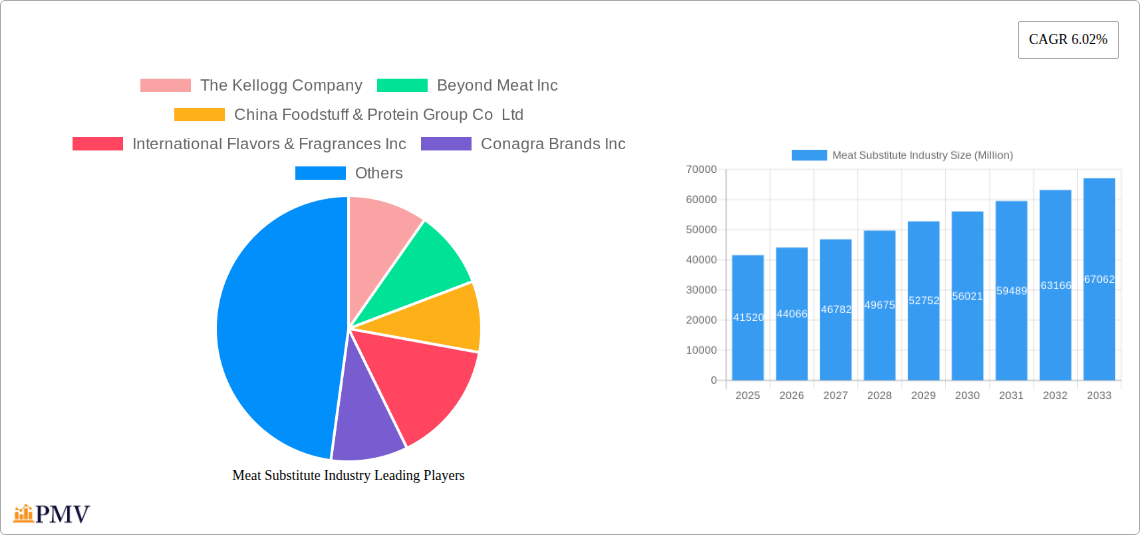
The global meat substitute market, valued at $41.52 billion in 2025, is projected to experience robust growth, driven by a confluence of factors. Increasing consumer awareness of health benefits associated with plant-based diets, growing concerns about the environmental impact of traditional meat production, and the rising popularity of vegetarian and vegan lifestyles are key drivers. Technological advancements leading to improved taste, texture, and nutritional profiles of meat substitutes are further fueling market expansion. The market is segmented by product type (tempeh, textured vegetable protein, tofu, other meat substitutes) and distribution channel (off-trade, on-trade). While off-trade channels (supermarkets, retail stores) currently dominate, the on-trade sector (restaurants, food service) is showing significant growth potential as more establishments incorporate plant-based options into their menus. Key players like Beyond Meat, Impossible Foods, and Kellogg's are actively investing in research and development, expanding their product portfolios, and forging strategic partnerships to capitalize on this burgeoning market. Regional variations exist, with North America and Europe currently leading the market, but Asia-Pacific is poised for substantial growth given its large population and increasing adoption of plant-based diets. The market’s growth is likely to be influenced by factors such as fluctuating raw material prices and consumer perceptions about the cost-effectiveness of meat substitutes compared to traditional meats. Competitive pressures and innovation within the industry will shape the market's future trajectory.
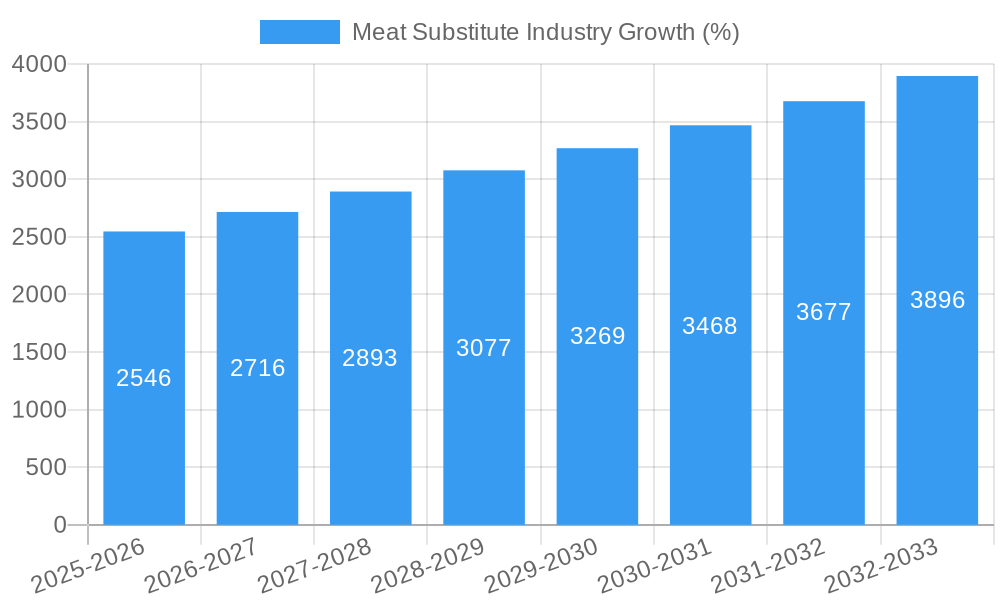
The projected Compound Annual Growth Rate (CAGR) of 6.02% from 2025 to 2033 indicates a substantial expansion. This growth will be fueled by increasing demand for sustainable and ethical food sources, leading to a continuous evolution of product offerings. Companies are focusing on addressing consumer preferences for diverse flavors, textures, and convenient formats. Successful market penetration will depend on effectively communicating the health, environmental, and ethical advantages of meat substitutes, while simultaneously overcoming perceptions about taste and affordability. Future market analysis will need to closely monitor evolving consumer trends, technological advancements, and regulatory changes to accurately assess the long-term growth prospects of this dynamic market. Continued innovation in product development, including the creation of more realistic meat alternatives, will be crucial for sustaining this growth.
Meat Substitute Industry: A Comprehensive Market Report (2019-2033)
This detailed report provides a comprehensive analysis of the global meat substitute industry, offering invaluable insights for businesses, investors, and researchers. The study period spans 2019-2033, with 2025 serving as the base and estimated year. The report forecasts market trends from 2025-2033, leveraging historical data from 2019-2024. The market is segmented by type (Tempeh, Textured Vegetable Protein (TVP), Tofu, Other Meat Substitutes) and distribution channel (Off-Trade, On-Trade). We project a market size exceeding xx Million by 2033, driven by robust growth and innovation.
Meat Substitute Industry Market Structure & Competitive Dynamics
The meat substitute market is characterized by a dynamic interplay of established food giants and innovative startups. Market concentration is moderate, with a few key players holding significant shares, but a fragmented landscape due to numerous smaller players specializing in niche products. The industry witnesses substantial innovation, primarily in product development to mimic the taste and texture of meat. Regulatory frameworks, varying across geographies, impact ingredient sourcing and labeling. Substitute products (e.g., traditional meat) present ongoing competitive pressure. End-user trends reflect a growing preference for plant-based options driven by health, environmental, and ethical concerns. Mergers and acquisitions (M&A) are frequent, with significant deals shaping the industry landscape. For example, the xx Million acquisition of KNH by House Foods Group (detailed below) highlights the strategic importance of tofu in market expansion. The average M&A deal value is estimated at xx Million. Below are some key metrics:
- Market Share: Beyond Meat and Impossible Foods hold significant market shares, while smaller players focus on specialized segments.
- Innovation Ecosystems: Strong collaboration between food tech startups and established players drives innovation.
- Regulatory Frameworks: Regulations regarding labeling, ingredients, and marketing vary globally, impacting market entry and competitiveness.
- M&A Activities: Frequent acquisitions and mergers are reshaping the competitive landscape, boosting scale and product diversification.
Meat Substitute Industry Industry Trends & Insights
The global meat substitute market exhibits robust growth, driven by several converging factors. The Compound Annual Growth Rate (CAGR) during the forecast period (2025-2033) is projected at xx%, indicating substantial market expansion. Key drivers include growing consumer awareness of health and environmental benefits associated with plant-based diets. Technological advancements, such as improved protein extraction and formulation techniques, lead to more realistic meat substitutes. Shifting consumer preferences towards sustainable and ethical food choices are also significant catalysts. Market penetration of meat substitutes is increasing steadily, especially in developed regions with high awareness and disposable income. The competitive landscape is dynamic, characterized by both price competition and product differentiation strategies. Emerging markets present significant growth opportunities, although challenges in consumer education and infrastructure development remain. Furthermore, the industry is witnessing increasing investments in research and development, focusing on improving taste, texture, and nutritional profile of meat alternatives.
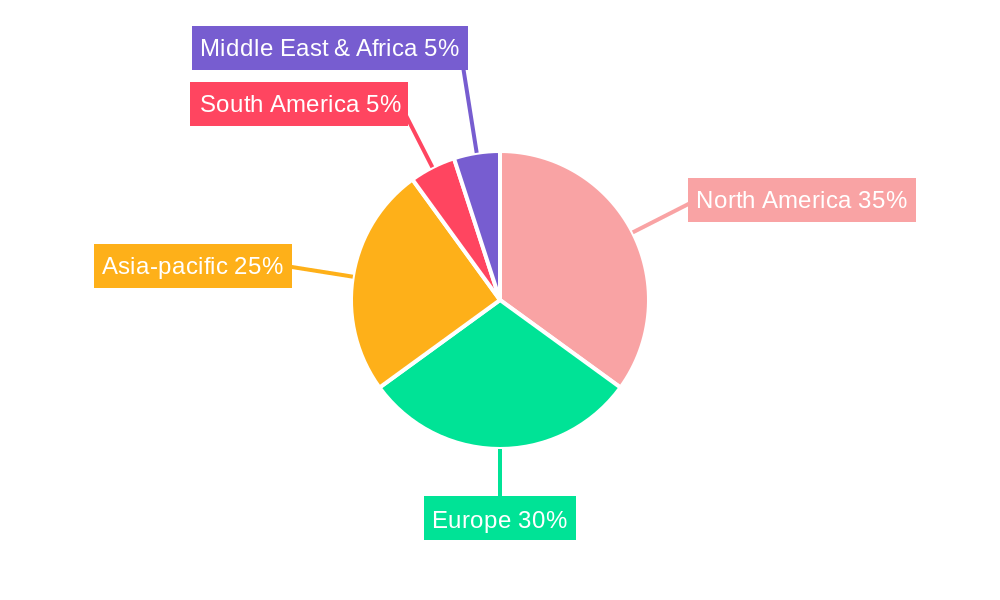
Dominant Markets & Segments in Meat Substitute Industry
The North American and European markets currently dominate the meat substitute industry. Within these regions, consumer adoption of plant-based products is highest.
- Leading Region: North America
- Leading Country: United States
- Dominant Segment (Type): Tofu enjoys robust market share due to its established presence, affordability, and versatility. Other Meat Substitutes show high potential for growth, driven by innovation and product diversification.
- Dominant Segment (Distribution Channel): Off-Trade channels (grocery stores, supermarkets) currently hold the largest share, but On-Trade (restaurants, food service) is experiencing rapid growth, particularly due to the inclusion of meat substitutes in menus.
Key Drivers: In North America, strong consumer demand fuelled by health consciousness and growing environmental concerns plays a major role. Supportive government policies and extensive retail infrastructure also contribute to the region's dominance. In Europe, similar factors are at play, with a growing emphasis on sustainable food systems.
Meat Substitute Industry Product Innovations
The meat substitute industry is characterized by rapid product innovation, driven by advancements in food technology. New products aim to replicate the taste, texture, and nutritional profile of meat, often surpassing traditional alternatives in terms of protein content and reduced saturated fat. The industry is exploring innovative protein sources like pea protein, soy protein, mycoprotein, and other plant-based options. Technological trends focus on improving texture, reducing costs, and creating more diverse product offerings to cater to a wide range of consumer preferences. This results in a more competitive landscape where market fit is determined by product appeal, taste, health factors, and price.
Report Segmentation & Scope
This report segments the meat substitute market along two key dimensions: type and distribution channel.
By Type: The market is segmented into Tempeh, Textured Vegetable Protein (TVP), Tofu, and Other Meat Substitutes (including plant-based burgers, sausages, etc.). Each segment's growth projection varies, with "Other Meat Substitutes" showing the fastest growth. Market size estimates for each segment are detailed within the full report. Competitive dynamics differ depending on the specific segment, with some being more concentrated than others.
By Distribution Channel: The market is categorized into Off-Trade (retail stores, supermarkets, online retailers) and On-Trade (restaurants, food service). Off-Trade channels currently dominate, however, On-Trade demonstrates significant growth potential. The report provides detailed growth projections and market sizes for each channel, highlighting the competitive dynamics within each.
Key Drivers of Meat Substitute Industry Growth
Several factors drive the growth of the meat substitute industry. Firstly, increasing health awareness among consumers fuels demand for low-fat, high-protein alternatives. Secondly, growing environmental concerns about the impact of animal agriculture on climate change promote the adoption of plant-based options. Thirdly, technological advancements in food processing lead to more realistic and appealing meat substitutes. Finally, supportive government policies in some regions encourage the development and adoption of sustainable protein sources. These factors collectively propel the market's expansion.
Challenges in the Meat Substitute Industry Sector
Despite significant growth potential, the meat substitute industry faces several challenges. Regulatory hurdles related to labeling and ingredient approval create complexities for market entry. Supply chain issues, particularly sourcing of raw materials, can affect production and cost. Furthermore, competition from established meat producers and the perception of meat substitutes being inferior to traditional meat pose significant challenges. The cost of production for some substitutes remains higher than conventional meat, also hindering wider adoption.
Leading Players in the Meat Substitute Industry Market
- The Kellogg Company
- Beyond Meat Inc
- China Foodstuff & Protein Group Co Ltd
- International Flavors & Fragrances Inc
- Conagra Brands Inc
- Cargill Inc
- Amy's Kitchen Inc
- Vitasoy International Holdings Lt
- House Foods Group Inc
- Impossible Foods Inc
- Morinaga Milk Industry Co Ltd
Key Developments in Meat Substitute Industry Sector
- September 2023: House Foods Group Inc. acquired 100% of Keystone Natural Holdings, LLC (“KNH”), expanding its presence in the North American and European tofu markets. This significantly strengthens their position in the plant-based sector.
- July 2023: Beyond Meat launched Beyond Nuggets and Beyond Tenders in over 1,600 REWE stores across Germany, boosting its product portfolio and market reach within Europe.
- April 2023: Beyond Meat introduced Beyond Pepperoni and Beyond Chicken Fillet, expanding its product range and solidifying its position as a market leader in plant-based meat alternatives.
Strategic Meat Substitute Industry Market Outlook
The meat substitute market holds immense future potential, driven by continued growth in consumer demand for sustainable and healthy food options. Strategic opportunities exist for companies that invest in research and development, focusing on improving product taste, texture, and affordability. Expansion into emerging markets offers significant growth potential, although market education and infrastructure development are key considerations. Collaborations and strategic partnerships between established food companies and innovative startups are likely to shape future market dynamics, enhancing product offerings and distribution reach. The market presents considerable opportunities for players who can address both consumer preferences and production challenges effectively.
Meat Substitute Industry Segmentation
-
1. Type
- 1.1. Tempeh
- 1.2. Textured Vegetable Protein
- 1.3. Tofu
- 1.4. Other Meat Substitutes
-
2. Distribution Channel
-
2.1. Off-Trade
- 2.1.1. Convenience Stores
- 2.1.2. Online Channel
- 2.1.3. Supermarkets and Hypermarkets
- 2.1.4. Others
- 2.2. On-Trade
-
2.1. Off-Trade
Meat Substitute Industry Segmentation By Geography
-
1. North America
- 1.1. United States
- 1.2. Canada
- 1.3. Mexico
-
2. South America
- 2.1. Brazil
- 2.2. Argentina
- 2.3. Rest of South America
-
3. Europe
- 3.1. United Kingdom
- 3.2. Germany
- 3.3. France
- 3.4. Italy
- 3.5. Spain
- 3.6. Russia
- 3.7. Benelux
- 3.8. Nordics
- 3.9. Rest of Europe
-
4. Middle East & Africa
- 4.1. Turkey
- 4.2. Israel
- 4.3. GCC
- 4.4. North Africa
- 4.5. South Africa
- 4.6. Rest of Middle East & Africa
-
5. Asia Pacific
- 5.1. China
- 5.2. India
- 5.3. Japan
- 5.4. South Korea
- 5.5. ASEAN
- 5.6. Oceania
- 5.7. Rest of Asia Pacific
Meat Substitute Industry REPORT HIGHLIGHTS
| Aspects | Details |
|---|---|
| Study Period | 2019-2033 |
| Base Year | 2024 |
| Estimated Year | 2025 |
| Forecast Period | 2025-2033 |
| Historical Period | 2019-2024 |
| Growth Rate | CAGR of 6.02% from 2019-2033 |
| Segmentation |
|
Table of Contents
- 1. Introduction
- 1.1. Research Scope
- 1.2. Market Segmentation
- 1.3. Research Methodology
- 1.4. Definitions and Assumptions
- 2. Executive Summary
- 2.1. Introduction
- 3. Market Dynamics
- 3.1. Introduction
- 3.2. Market Drivers
- 3.2.1. Growing Demand for Nutricosmetics Among Millennials; Growing Beauty and Wellness Trend
- 3.3. Market Restrains
- 3.3.1. Stringent Government Regulations and Product Guidelines
- 3.4. Market Trends
- 3.4.1. OTHER KEY INDUSTRY TRENDS COVERED IN THE REPORT
- 4. Market Factor Analysis
- 4.1. Porters Five Forces
- 4.2. Supply/Value Chain
- 4.3. PESTEL analysis
- 4.4. Market Entropy
- 4.5. Patent/Trademark Analysis
- 5. Global Meat Substitute Industry Analysis, Insights and Forecast, 2019-2031
- 5.1. Market Analysis, Insights and Forecast - by Type
- 5.1.1. Tempeh
- 5.1.2. Textured Vegetable Protein
- 5.1.3. Tofu
- 5.1.4. Other Meat Substitutes
- 5.2. Market Analysis, Insights and Forecast - by Distribution Channel
- 5.2.1. Off-Trade
- 5.2.1.1. Convenience Stores
- 5.2.1.2. Online Channel
- 5.2.1.3. Supermarkets and Hypermarkets
- 5.2.1.4. Others
- 5.2.2. On-Trade
- 5.2.1. Off-Trade
- 5.3. Market Analysis, Insights and Forecast - by Region
- 5.3.1. North America
- 5.3.2. South America
- 5.3.3. Europe
- 5.3.4. Middle East & Africa
- 5.3.5. Asia Pacific
- 5.1. Market Analysis, Insights and Forecast - by Type
- 6. North America Meat Substitute Industry Analysis, Insights and Forecast, 2019-2031
- 6.1. Market Analysis, Insights and Forecast - by Type
- 6.1.1. Tempeh
- 6.1.2. Textured Vegetable Protein
- 6.1.3. Tofu
- 6.1.4. Other Meat Substitutes
- 6.2. Market Analysis, Insights and Forecast - by Distribution Channel
- 6.2.1. Off-Trade
- 6.2.1.1. Convenience Stores
- 6.2.1.2. Online Channel
- 6.2.1.3. Supermarkets and Hypermarkets
- 6.2.1.4. Others
- 6.2.2. On-Trade
- 6.2.1. Off-Trade
- 6.1. Market Analysis, Insights and Forecast - by Type
- 7. South America Meat Substitute Industry Analysis, Insights and Forecast, 2019-2031
- 7.1. Market Analysis, Insights and Forecast - by Type
- 7.1.1. Tempeh
- 7.1.2. Textured Vegetable Protein
- 7.1.3. Tofu
- 7.1.4. Other Meat Substitutes
- 7.2. Market Analysis, Insights and Forecast - by Distribution Channel
- 7.2.1. Off-Trade
- 7.2.1.1. Convenience Stores
- 7.2.1.2. Online Channel
- 7.2.1.3. Supermarkets and Hypermarkets
- 7.2.1.4. Others
- 7.2.2. On-Trade
- 7.2.1. Off-Trade
- 7.1. Market Analysis, Insights and Forecast - by Type
- 8. Europe Meat Substitute Industry Analysis, Insights and Forecast, 2019-2031
- 8.1. Market Analysis, Insights and Forecast - by Type
- 8.1.1. Tempeh
- 8.1.2. Textured Vegetable Protein
- 8.1.3. Tofu
- 8.1.4. Other Meat Substitutes
- 8.2. Market Analysis, Insights and Forecast - by Distribution Channel
- 8.2.1. Off-Trade
- 8.2.1.1. Convenience Stores
- 8.2.1.2. Online Channel
- 8.2.1.3. Supermarkets and Hypermarkets
- 8.2.1.4. Others
- 8.2.2. On-Trade
- 8.2.1. Off-Trade
- 8.1. Market Analysis, Insights and Forecast - by Type
- 9. Middle East & Africa Meat Substitute Industry Analysis, Insights and Forecast, 2019-2031
- 9.1. Market Analysis, Insights and Forecast - by Type
- 9.1.1. Tempeh
- 9.1.2. Textured Vegetable Protein
- 9.1.3. Tofu
- 9.1.4. Other Meat Substitutes
- 9.2. Market Analysis, Insights and Forecast - by Distribution Channel
- 9.2.1. Off-Trade
- 9.2.1.1. Convenience Stores
- 9.2.1.2. Online Channel
- 9.2.1.3. Supermarkets and Hypermarkets
- 9.2.1.4. Others
- 9.2.2. On-Trade
- 9.2.1. Off-Trade
- 9.1. Market Analysis, Insights and Forecast - by Type
- 10. Asia Pacific Meat Substitute Industry Analysis, Insights and Forecast, 2019-2031
- 10.1. Market Analysis, Insights and Forecast - by Type
- 10.1.1. Tempeh
- 10.1.2. Textured Vegetable Protein
- 10.1.3. Tofu
- 10.1.4. Other Meat Substitutes
- 10.2. Market Analysis, Insights and Forecast - by Distribution Channel
- 10.2.1. Off-Trade
- 10.2.1.1. Convenience Stores
- 10.2.1.2. Online Channel
- 10.2.1.3. Supermarkets and Hypermarkets
- 10.2.1.4. Others
- 10.2.2. On-Trade
- 10.2.1. Off-Trade
- 10.1. Market Analysis, Insights and Forecast - by Type
- 11. North America Meat Substitute Industry Analysis, Insights and Forecast, 2019-2031
- 11.1. Market Analysis, Insights and Forecast - By Country/Sub-region
- 11.1.1 United States
- 11.1.2 Canada
- 11.1.3 Mexico
- 12. South America Meat Substitute Industry Analysis, Insights and Forecast, 2019-2031
- 12.1. Market Analysis, Insights and Forecast - By Country/Sub-region
- 12.1.1 Brazil
- 12.1.2 Argentina
- 12.1.3 Rest of South America
- 13. Europe Meat Substitute Industry Analysis, Insights and Forecast, 2019-2031
- 13.1. Market Analysis, Insights and Forecast - By Country/Sub-region
- 13.1.1 Germany
- 13.1.2 France
- 13.1.3 Italy
- 13.1.4 United Kingdom
- 13.1.5 Netherlands
- 13.1.6 Rest of Europe
- 14. Asia-pacific Meat Substitute Industry Analysis, Insights and Forecast, 2019-2031
- 14.1. Market Analysis, Insights and Forecast - By Country/Sub-region
- 14.1.1 China
- 14.1.2 Japan
- 14.1.3 India
- 14.1.4 South Korea
- 14.1.5 Taiwan
- 14.1.6 Australia
- 14.1.7 Rest of Asia-Pacific
- 15. Middle East & Africa Meat Substitute Industry Analysis, Insights and Forecast, 2019-2031
- 15.1. Market Analysis, Insights and Forecast - By Country/Sub-region
- 15.1.1 UAE
- 15.1.2 South Africa
- 15.1.3 Saudi Arabia
- 15.1.4 Rest of MEA
- 16. Competitive Analysis
- 16.1. Global Market Share Analysis 2024
- 16.2. Company Profiles
- 16.2.1 The Kellogg Company
- 16.2.1.1. Overview
- 16.2.1.2. Products
- 16.2.1.3. SWOT Analysis
- 16.2.1.4. Recent Developments
- 16.2.1.5. Financials (Based on Availability)
- 16.2.2 Beyond Meat Inc
- 16.2.2.1. Overview
- 16.2.2.2. Products
- 16.2.2.3. SWOT Analysis
- 16.2.2.4. Recent Developments
- 16.2.2.5. Financials (Based on Availability)
- 16.2.3 China Foodstuff & Protein Group Co Ltd
- 16.2.3.1. Overview
- 16.2.3.2. Products
- 16.2.3.3. SWOT Analysis
- 16.2.3.4. Recent Developments
- 16.2.3.5. Financials (Based on Availability)
- 16.2.4 International Flavors & Fragrances Inc
- 16.2.4.1. Overview
- 16.2.4.2. Products
- 16.2.4.3. SWOT Analysis
- 16.2.4.4. Recent Developments
- 16.2.4.5. Financials (Based on Availability)
- 16.2.5 Conagra Brands Inc
- 16.2.5.1. Overview
- 16.2.5.2. Products
- 16.2.5.3. SWOT Analysis
- 16.2.5.4. Recent Developments
- 16.2.5.5. Financials (Based on Availability)
- 16.2.6 Cargill Inc
- 16.2.6.1. Overview
- 16.2.6.2. Products
- 16.2.6.3. SWOT Analysis
- 16.2.6.4. Recent Developments
- 16.2.6.5. Financials (Based on Availability)
- 16.2.7 Amy's Kitchen Inc
- 16.2.7.1. Overview
- 16.2.7.2. Products
- 16.2.7.3. SWOT Analysis
- 16.2.7.4. Recent Developments
- 16.2.7.5. Financials (Based on Availability)
- 16.2.8 Vitasoy International Holdings Lt
- 16.2.8.1. Overview
- 16.2.8.2. Products
- 16.2.8.3. SWOT Analysis
- 16.2.8.4. Recent Developments
- 16.2.8.5. Financials (Based on Availability)
- 16.2.9 House Foods Group Inc
- 16.2.9.1. Overview
- 16.2.9.2. Products
- 16.2.9.3. SWOT Analysis
- 16.2.9.4. Recent Developments
- 16.2.9.5. Financials (Based on Availability)
- 16.2.10 Impossible Foods Inc
- 16.2.10.1. Overview
- 16.2.10.2. Products
- 16.2.10.3. SWOT Analysis
- 16.2.10.4. Recent Developments
- 16.2.10.5. Financials (Based on Availability)
- 16.2.11 Morinaga Milk Industry Co Ltd
- 16.2.11.1. Overview
- 16.2.11.2. Products
- 16.2.11.3. SWOT Analysis
- 16.2.11.4. Recent Developments
- 16.2.11.5. Financials (Based on Availability)
- 16.2.1 The Kellogg Company
List of Figures
- Figure 1: Global Meat Substitute Industry Revenue Breakdown (Million, %) by Region 2024 & 2032
- Figure 2: Global Meat Substitute Industry Volume Breakdown (K Units, %) by Region 2024 & 2032
- Figure 3: North America Meat Substitute Industry Revenue (Million), by Country 2024 & 2032
- Figure 4: North America Meat Substitute Industry Volume (K Units), by Country 2024 & 2032
- Figure 5: North America Meat Substitute Industry Revenue Share (%), by Country 2024 & 2032
- Figure 6: North America Meat Substitute Industry Volume Share (%), by Country 2024 & 2032
- Figure 7: South America Meat Substitute Industry Revenue (Million), by Country 2024 & 2032
- Figure 8: South America Meat Substitute Industry Volume (K Units), by Country 2024 & 2032
- Figure 9: South America Meat Substitute Industry Revenue Share (%), by Country 2024 & 2032
- Figure 10: South America Meat Substitute Industry Volume Share (%), by Country 2024 & 2032
- Figure 11: Europe Meat Substitute Industry Revenue (Million), by Country 2024 & 2032
- Figure 12: Europe Meat Substitute Industry Volume (K Units), by Country 2024 & 2032
- Figure 13: Europe Meat Substitute Industry Revenue Share (%), by Country 2024 & 2032
- Figure 14: Europe Meat Substitute Industry Volume Share (%), by Country 2024 & 2032
- Figure 15: Asia-pacific Meat Substitute Industry Revenue (Million), by Country 2024 & 2032
- Figure 16: Asia-pacific Meat Substitute Industry Volume (K Units), by Country 2024 & 2032
- Figure 17: Asia-pacific Meat Substitute Industry Revenue Share (%), by Country 2024 & 2032
- Figure 18: Asia-pacific Meat Substitute Industry Volume Share (%), by Country 2024 & 2032
- Figure 19: Middle East & Africa Meat Substitute Industry Revenue (Million), by Country 2024 & 2032
- Figure 20: Middle East & Africa Meat Substitute Industry Volume (K Units), by Country 2024 & 2032
- Figure 21: Middle East & Africa Meat Substitute Industry Revenue Share (%), by Country 2024 & 2032
- Figure 22: Middle East & Africa Meat Substitute Industry Volume Share (%), by Country 2024 & 2032
- Figure 23: North America Meat Substitute Industry Revenue (Million), by Type 2024 & 2032
- Figure 24: North America Meat Substitute Industry Volume (K Units), by Type 2024 & 2032
- Figure 25: North America Meat Substitute Industry Revenue Share (%), by Type 2024 & 2032
- Figure 26: North America Meat Substitute Industry Volume Share (%), by Type 2024 & 2032
- Figure 27: North America Meat Substitute Industry Revenue (Million), by Distribution Channel 2024 & 2032
- Figure 28: North America Meat Substitute Industry Volume (K Units), by Distribution Channel 2024 & 2032
- Figure 29: North America Meat Substitute Industry Revenue Share (%), by Distribution Channel 2024 & 2032
- Figure 30: North America Meat Substitute Industry Volume Share (%), by Distribution Channel 2024 & 2032
- Figure 31: North America Meat Substitute Industry Revenue (Million), by Country 2024 & 2032
- Figure 32: North America Meat Substitute Industry Volume (K Units), by Country 2024 & 2032
- Figure 33: North America Meat Substitute Industry Revenue Share (%), by Country 2024 & 2032
- Figure 34: North America Meat Substitute Industry Volume Share (%), by Country 2024 & 2032
- Figure 35: South America Meat Substitute Industry Revenue (Million), by Type 2024 & 2032
- Figure 36: South America Meat Substitute Industry Volume (K Units), by Type 2024 & 2032
- Figure 37: South America Meat Substitute Industry Revenue Share (%), by Type 2024 & 2032
- Figure 38: South America Meat Substitute Industry Volume Share (%), by Type 2024 & 2032
- Figure 39: South America Meat Substitute Industry Revenue (Million), by Distribution Channel 2024 & 2032
- Figure 40: South America Meat Substitute Industry Volume (K Units), by Distribution Channel 2024 & 2032
- Figure 41: South America Meat Substitute Industry Revenue Share (%), by Distribution Channel 2024 & 2032
- Figure 42: South America Meat Substitute Industry Volume Share (%), by Distribution Channel 2024 & 2032
- Figure 43: South America Meat Substitute Industry Revenue (Million), by Country 2024 & 2032
- Figure 44: South America Meat Substitute Industry Volume (K Units), by Country 2024 & 2032
- Figure 45: South America Meat Substitute Industry Revenue Share (%), by Country 2024 & 2032
- Figure 46: South America Meat Substitute Industry Volume Share (%), by Country 2024 & 2032
- Figure 47: Europe Meat Substitute Industry Revenue (Million), by Type 2024 & 2032
- Figure 48: Europe Meat Substitute Industry Volume (K Units), by Type 2024 & 2032
- Figure 49: Europe Meat Substitute Industry Revenue Share (%), by Type 2024 & 2032
- Figure 50: Europe Meat Substitute Industry Volume Share (%), by Type 2024 & 2032
- Figure 51: Europe Meat Substitute Industry Revenue (Million), by Distribution Channel 2024 & 2032
- Figure 52: Europe Meat Substitute Industry Volume (K Units), by Distribution Channel 2024 & 2032
- Figure 53: Europe Meat Substitute Industry Revenue Share (%), by Distribution Channel 2024 & 2032
- Figure 54: Europe Meat Substitute Industry Volume Share (%), by Distribution Channel 2024 & 2032
- Figure 55: Europe Meat Substitute Industry Revenue (Million), by Country 2024 & 2032
- Figure 56: Europe Meat Substitute Industry Volume (K Units), by Country 2024 & 2032
- Figure 57: Europe Meat Substitute Industry Revenue Share (%), by Country 2024 & 2032
- Figure 58: Europe Meat Substitute Industry Volume Share (%), by Country 2024 & 2032
- Figure 59: Middle East & Africa Meat Substitute Industry Revenue (Million), by Type 2024 & 2032
- Figure 60: Middle East & Africa Meat Substitute Industry Volume (K Units), by Type 2024 & 2032
- Figure 61: Middle East & Africa Meat Substitute Industry Revenue Share (%), by Type 2024 & 2032
- Figure 62: Middle East & Africa Meat Substitute Industry Volume Share (%), by Type 2024 & 2032
- Figure 63: Middle East & Africa Meat Substitute Industry Revenue (Million), by Distribution Channel 2024 & 2032
- Figure 64: Middle East & Africa Meat Substitute Industry Volume (K Units), by Distribution Channel 2024 & 2032
- Figure 65: Middle East & Africa Meat Substitute Industry Revenue Share (%), by Distribution Channel 2024 & 2032
- Figure 66: Middle East & Africa Meat Substitute Industry Volume Share (%), by Distribution Channel 2024 & 2032
- Figure 67: Middle East & Africa Meat Substitute Industry Revenue (Million), by Country 2024 & 2032
- Figure 68: Middle East & Africa Meat Substitute Industry Volume (K Units), by Country 2024 & 2032
- Figure 69: Middle East & Africa Meat Substitute Industry Revenue Share (%), by Country 2024 & 2032
- Figure 70: Middle East & Africa Meat Substitute Industry Volume Share (%), by Country 2024 & 2032
- Figure 71: Asia Pacific Meat Substitute Industry Revenue (Million), by Type 2024 & 2032
- Figure 72: Asia Pacific Meat Substitute Industry Volume (K Units), by Type 2024 & 2032
- Figure 73: Asia Pacific Meat Substitute Industry Revenue Share (%), by Type 2024 & 2032
- Figure 74: Asia Pacific Meat Substitute Industry Volume Share (%), by Type 2024 & 2032
- Figure 75: Asia Pacific Meat Substitute Industry Revenue (Million), by Distribution Channel 2024 & 2032
- Figure 76: Asia Pacific Meat Substitute Industry Volume (K Units), by Distribution Channel 2024 & 2032
- Figure 77: Asia Pacific Meat Substitute Industry Revenue Share (%), by Distribution Channel 2024 & 2032
- Figure 78: Asia Pacific Meat Substitute Industry Volume Share (%), by Distribution Channel 2024 & 2032
- Figure 79: Asia Pacific Meat Substitute Industry Revenue (Million), by Country 2024 & 2032
- Figure 80: Asia Pacific Meat Substitute Industry Volume (K Units), by Country 2024 & 2032
- Figure 81: Asia Pacific Meat Substitute Industry Revenue Share (%), by Country 2024 & 2032
- Figure 82: Asia Pacific Meat Substitute Industry Volume Share (%), by Country 2024 & 2032
List of Tables
- Table 1: Global Meat Substitute Industry Revenue Million Forecast, by Region 2019 & 2032
- Table 2: Global Meat Substitute Industry Volume K Units Forecast, by Region 2019 & 2032
- Table 3: Global Meat Substitute Industry Revenue Million Forecast, by Type 2019 & 2032
- Table 4: Global Meat Substitute Industry Volume K Units Forecast, by Type 2019 & 2032
- Table 5: Global Meat Substitute Industry Revenue Million Forecast, by Distribution Channel 2019 & 2032
- Table 6: Global Meat Substitute Industry Volume K Units Forecast, by Distribution Channel 2019 & 2032
- Table 7: Global Meat Substitute Industry Revenue Million Forecast, by Region 2019 & 2032
- Table 8: Global Meat Substitute Industry Volume K Units Forecast, by Region 2019 & 2032
- Table 9: Global Meat Substitute Industry Revenue Million Forecast, by Country 2019 & 2032
- Table 10: Global Meat Substitute Industry Volume K Units Forecast, by Country 2019 & 2032
- Table 11: United States Meat Substitute Industry Revenue (Million) Forecast, by Application 2019 & 2032
- Table 12: United States Meat Substitute Industry Volume (K Units) Forecast, by Application 2019 & 2032
- Table 13: Canada Meat Substitute Industry Revenue (Million) Forecast, by Application 2019 & 2032
- Table 14: Canada Meat Substitute Industry Volume (K Units) Forecast, by Application 2019 & 2032
- Table 15: Mexico Meat Substitute Industry Revenue (Million) Forecast, by Application 2019 & 2032
- Table 16: Mexico Meat Substitute Industry Volume (K Units) Forecast, by Application 2019 & 2032
- Table 17: Global Meat Substitute Industry Revenue Million Forecast, by Country 2019 & 2032
- Table 18: Global Meat Substitute Industry Volume K Units Forecast, by Country 2019 & 2032
- Table 19: Brazil Meat Substitute Industry Revenue (Million) Forecast, by Application 2019 & 2032
- Table 20: Brazil Meat Substitute Industry Volume (K Units) Forecast, by Application 2019 & 2032
- Table 21: Argentina Meat Substitute Industry Revenue (Million) Forecast, by Application 2019 & 2032
- Table 22: Argentina Meat Substitute Industry Volume (K Units) Forecast, by Application 2019 & 2032
- Table 23: Rest of South America Meat Substitute Industry Revenue (Million) Forecast, by Application 2019 & 2032
- Table 24: Rest of South America Meat Substitute Industry Volume (K Units) Forecast, by Application 2019 & 2032
- Table 25: Global Meat Substitute Industry Revenue Million Forecast, by Country 2019 & 2032
- Table 26: Global Meat Substitute Industry Volume K Units Forecast, by Country 2019 & 2032
- Table 27: Germany Meat Substitute Industry Revenue (Million) Forecast, by Application 2019 & 2032
- Table 28: Germany Meat Substitute Industry Volume (K Units) Forecast, by Application 2019 & 2032
- Table 29: France Meat Substitute Industry Revenue (Million) Forecast, by Application 2019 & 2032
- Table 30: France Meat Substitute Industry Volume (K Units) Forecast, by Application 2019 & 2032
- Table 31: Italy Meat Substitute Industry Revenue (Million) Forecast, by Application 2019 & 2032
- Table 32: Italy Meat Substitute Industry Volume (K Units) Forecast, by Application 2019 & 2032
- Table 33: United Kingdom Meat Substitute Industry Revenue (Million) Forecast, by Application 2019 & 2032
- Table 34: United Kingdom Meat Substitute Industry Volume (K Units) Forecast, by Application 2019 & 2032
- Table 35: Netherlands Meat Substitute Industry Revenue (Million) Forecast, by Application 2019 & 2032
- Table 36: Netherlands Meat Substitute Industry Volume (K Units) Forecast, by Application 2019 & 2032
- Table 37: Rest of Europe Meat Substitute Industry Revenue (Million) Forecast, by Application 2019 & 2032
- Table 38: Rest of Europe Meat Substitute Industry Volume (K Units) Forecast, by Application 2019 & 2032
- Table 39: Global Meat Substitute Industry Revenue Million Forecast, by Country 2019 & 2032
- Table 40: Global Meat Substitute Industry Volume K Units Forecast, by Country 2019 & 2032
- Table 41: China Meat Substitute Industry Revenue (Million) Forecast, by Application 2019 & 2032
- Table 42: China Meat Substitute Industry Volume (K Units) Forecast, by Application 2019 & 2032
- Table 43: Japan Meat Substitute Industry Revenue (Million) Forecast, by Application 2019 & 2032
- Table 44: Japan Meat Substitute Industry Volume (K Units) Forecast, by Application 2019 & 2032
- Table 45: India Meat Substitute Industry Revenue (Million) Forecast, by Application 2019 & 2032
- Table 46: India Meat Substitute Industry Volume (K Units) Forecast, by Application 2019 & 2032
- Table 47: South Korea Meat Substitute Industry Revenue (Million) Forecast, by Application 2019 & 2032
- Table 48: South Korea Meat Substitute Industry Volume (K Units) Forecast, by Application 2019 & 2032
- Table 49: Taiwan Meat Substitute Industry Revenue (Million) Forecast, by Application 2019 & 2032
- Table 50: Taiwan Meat Substitute Industry Volume (K Units) Forecast, by Application 2019 & 2032
- Table 51: Australia Meat Substitute Industry Revenue (Million) Forecast, by Application 2019 & 2032
- Table 52: Australia Meat Substitute Industry Volume (K Units) Forecast, by Application 2019 & 2032
- Table 53: Rest of Asia-Pacific Meat Substitute Industry Revenue (Million) Forecast, by Application 2019 & 2032
- Table 54: Rest of Asia-Pacific Meat Substitute Industry Volume (K Units) Forecast, by Application 2019 & 2032
- Table 55: Global Meat Substitute Industry Revenue Million Forecast, by Country 2019 & 2032
- Table 56: Global Meat Substitute Industry Volume K Units Forecast, by Country 2019 & 2032
- Table 57: UAE Meat Substitute Industry Revenue (Million) Forecast, by Application 2019 & 2032
- Table 58: UAE Meat Substitute Industry Volume (K Units) Forecast, by Application 2019 & 2032
- Table 59: South Africa Meat Substitute Industry Revenue (Million) Forecast, by Application 2019 & 2032
- Table 60: South Africa Meat Substitute Industry Volume (K Units) Forecast, by Application 2019 & 2032
- Table 61: Saudi Arabia Meat Substitute Industry Revenue (Million) Forecast, by Application 2019 & 2032
- Table 62: Saudi Arabia Meat Substitute Industry Volume (K Units) Forecast, by Application 2019 & 2032
- Table 63: Rest of MEA Meat Substitute Industry Revenue (Million) Forecast, by Application 2019 & 2032
- Table 64: Rest of MEA Meat Substitute Industry Volume (K Units) Forecast, by Application 2019 & 2032
- Table 65: Global Meat Substitute Industry Revenue Million Forecast, by Type 2019 & 2032
- Table 66: Global Meat Substitute Industry Volume K Units Forecast, by Type 2019 & 2032
- Table 67: Global Meat Substitute Industry Revenue Million Forecast, by Distribution Channel 2019 & 2032
- Table 68: Global Meat Substitute Industry Volume K Units Forecast, by Distribution Channel 2019 & 2032
- Table 69: Global Meat Substitute Industry Revenue Million Forecast, by Country 2019 & 2032
- Table 70: Global Meat Substitute Industry Volume K Units Forecast, by Country 2019 & 2032
- Table 71: United States Meat Substitute Industry Revenue (Million) Forecast, by Application 2019 & 2032
- Table 72: United States Meat Substitute Industry Volume (K Units) Forecast, by Application 2019 & 2032
- Table 73: Canada Meat Substitute Industry Revenue (Million) Forecast, by Application 2019 & 2032
- Table 74: Canada Meat Substitute Industry Volume (K Units) Forecast, by Application 2019 & 2032
- Table 75: Mexico Meat Substitute Industry Revenue (Million) Forecast, by Application 2019 & 2032
- Table 76: Mexico Meat Substitute Industry Volume (K Units) Forecast, by Application 2019 & 2032
- Table 77: Global Meat Substitute Industry Revenue Million Forecast, by Type 2019 & 2032
- Table 78: Global Meat Substitute Industry Volume K Units Forecast, by Type 2019 & 2032
- Table 79: Global Meat Substitute Industry Revenue Million Forecast, by Distribution Channel 2019 & 2032
- Table 80: Global Meat Substitute Industry Volume K Units Forecast, by Distribution Channel 2019 & 2032
- Table 81: Global Meat Substitute Industry Revenue Million Forecast, by Country 2019 & 2032
- Table 82: Global Meat Substitute Industry Volume K Units Forecast, by Country 2019 & 2032
- Table 83: Brazil Meat Substitute Industry Revenue (Million) Forecast, by Application 2019 & 2032
- Table 84: Brazil Meat Substitute Industry Volume (K Units) Forecast, by Application 2019 & 2032
- Table 85: Argentina Meat Substitute Industry Revenue (Million) Forecast, by Application 2019 & 2032
- Table 86: Argentina Meat Substitute Industry Volume (K Units) Forecast, by Application 2019 & 2032
- Table 87: Rest of South America Meat Substitute Industry Revenue (Million) Forecast, by Application 2019 & 2032
- Table 88: Rest of South America Meat Substitute Industry Volume (K Units) Forecast, by Application 2019 & 2032
- Table 89: Global Meat Substitute Industry Revenue Million Forecast, by Type 2019 & 2032
- Table 90: Global Meat Substitute Industry Volume K Units Forecast, by Type 2019 & 2032
- Table 91: Global Meat Substitute Industry Revenue Million Forecast, by Distribution Channel 2019 & 2032
- Table 92: Global Meat Substitute Industry Volume K Units Forecast, by Distribution Channel 2019 & 2032
- Table 93: Global Meat Substitute Industry Revenue Million Forecast, by Country 2019 & 2032
- Table 94: Global Meat Substitute Industry Volume K Units Forecast, by Country 2019 & 2032
- Table 95: United Kingdom Meat Substitute Industry Revenue (Million) Forecast, by Application 2019 & 2032
- Table 96: United Kingdom Meat Substitute Industry Volume (K Units) Forecast, by Application 2019 & 2032
- Table 97: Germany Meat Substitute Industry Revenue (Million) Forecast, by Application 2019 & 2032
- Table 98: Germany Meat Substitute Industry Volume (K Units) Forecast, by Application 2019 & 2032
- Table 99: France Meat Substitute Industry Revenue (Million) Forecast, by Application 2019 & 2032
- Table 100: France Meat Substitute Industry Volume (K Units) Forecast, by Application 2019 & 2032
- Table 101: Italy Meat Substitute Industry Revenue (Million) Forecast, by Application 2019 & 2032
- Table 102: Italy Meat Substitute Industry Volume (K Units) Forecast, by Application 2019 & 2032
- Table 103: Spain Meat Substitute Industry Revenue (Million) Forecast, by Application 2019 & 2032
- Table 104: Spain Meat Substitute Industry Volume (K Units) Forecast, by Application 2019 & 2032
- Table 105: Russia Meat Substitute Industry Revenue (Million) Forecast, by Application 2019 & 2032
- Table 106: Russia Meat Substitute Industry Volume (K Units) Forecast, by Application 2019 & 2032
- Table 107: Benelux Meat Substitute Industry Revenue (Million) Forecast, by Application 2019 & 2032
- Table 108: Benelux Meat Substitute Industry Volume (K Units) Forecast, by Application 2019 & 2032
- Table 109: Nordics Meat Substitute Industry Revenue (Million) Forecast, by Application 2019 & 2032
- Table 110: Nordics Meat Substitute Industry Volume (K Units) Forecast, by Application 2019 & 2032
- Table 111: Rest of Europe Meat Substitute Industry Revenue (Million) Forecast, by Application 2019 & 2032
- Table 112: Rest of Europe Meat Substitute Industry Volume (K Units) Forecast, by Application 2019 & 2032
- Table 113: Global Meat Substitute Industry Revenue Million Forecast, by Type 2019 & 2032
- Table 114: Global Meat Substitute Industry Volume K Units Forecast, by Type 2019 & 2032
- Table 115: Global Meat Substitute Industry Revenue Million Forecast, by Distribution Channel 2019 & 2032
- Table 116: Global Meat Substitute Industry Volume K Units Forecast, by Distribution Channel 2019 & 2032
- Table 117: Global Meat Substitute Industry Revenue Million Forecast, by Country 2019 & 2032
- Table 118: Global Meat Substitute Industry Volume K Units Forecast, by Country 2019 & 2032
- Table 119: Turkey Meat Substitute Industry Revenue (Million) Forecast, by Application 2019 & 2032
- Table 120: Turkey Meat Substitute Industry Volume (K Units) Forecast, by Application 2019 & 2032
- Table 121: Israel Meat Substitute Industry Revenue (Million) Forecast, by Application 2019 & 2032
- Table 122: Israel Meat Substitute Industry Volume (K Units) Forecast, by Application 2019 & 2032
- Table 123: GCC Meat Substitute Industry Revenue (Million) Forecast, by Application 2019 & 2032
- Table 124: GCC Meat Substitute Industry Volume (K Units) Forecast, by Application 2019 & 2032
- Table 125: North Africa Meat Substitute Industry Revenue (Million) Forecast, by Application 2019 & 2032
- Table 126: North Africa Meat Substitute Industry Volume (K Units) Forecast, by Application 2019 & 2032
- Table 127: South Africa Meat Substitute Industry Revenue (Million) Forecast, by Application 2019 & 2032
- Table 128: South Africa Meat Substitute Industry Volume (K Units) Forecast, by Application 2019 & 2032
- Table 129: Rest of Middle East & Africa Meat Substitute Industry Revenue (Million) Forecast, by Application 2019 & 2032
- Table 130: Rest of Middle East & Africa Meat Substitute Industry Volume (K Units) Forecast, by Application 2019 & 2032
- Table 131: Global Meat Substitute Industry Revenue Million Forecast, by Type 2019 & 2032
- Table 132: Global Meat Substitute Industry Volume K Units Forecast, by Type 2019 & 2032
- Table 133: Global Meat Substitute Industry Revenue Million Forecast, by Distribution Channel 2019 & 2032
- Table 134: Global Meat Substitute Industry Volume K Units Forecast, by Distribution Channel 2019 & 2032
- Table 135: Global Meat Substitute Industry Revenue Million Forecast, by Country 2019 & 2032
- Table 136: Global Meat Substitute Industry Volume K Units Forecast, by Country 2019 & 2032
- Table 137: China Meat Substitute Industry Revenue (Million) Forecast, by Application 2019 & 2032
- Table 138: China Meat Substitute Industry Volume (K Units) Forecast, by Application 2019 & 2032
- Table 139: India Meat Substitute Industry Revenue (Million) Forecast, by Application 2019 & 2032
- Table 140: India Meat Substitute Industry Volume (K Units) Forecast, by Application 2019 & 2032
- Table 141: Japan Meat Substitute Industry Revenue (Million) Forecast, by Application 2019 & 2032
- Table 142: Japan Meat Substitute Industry Volume (K Units) Forecast, by Application 2019 & 2032
- Table 143: South Korea Meat Substitute Industry Revenue (Million) Forecast, by Application 2019 & 2032
- Table 144: South Korea Meat Substitute Industry Volume (K Units) Forecast, by Application 2019 & 2032
- Table 145: ASEAN Meat Substitute Industry Revenue (Million) Forecast, by Application 2019 & 2032
- Table 146: ASEAN Meat Substitute Industry Volume (K Units) Forecast, by Application 2019 & 2032
- Table 147: Oceania Meat Substitute Industry Revenue (Million) Forecast, by Application 2019 & 2032
- Table 148: Oceania Meat Substitute Industry Volume (K Units) Forecast, by Application 2019 & 2032
- Table 149: Rest of Asia Pacific Meat Substitute Industry Revenue (Million) Forecast, by Application 2019 & 2032
- Table 150: Rest of Asia Pacific Meat Substitute Industry Volume (K Units) Forecast, by Application 2019 & 2032
Frequently Asked Questions
1. What is the projected Compound Annual Growth Rate (CAGR) of the Meat Substitute Industry?
The projected CAGR is approximately 6.02%.
2. Which companies are prominent players in the Meat Substitute Industry?
Key companies in the market include The Kellogg Company, Beyond Meat Inc, China Foodstuff & Protein Group Co Ltd, International Flavors & Fragrances Inc, Conagra Brands Inc, Cargill Inc, Amy's Kitchen Inc, Vitasoy International Holdings Lt, House Foods Group Inc, Impossible Foods Inc, Morinaga Milk Industry Co Ltd.
3. What are the main segments of the Meat Substitute Industry?
The market segments include Type, Distribution Channel.
4. Can you provide details about the market size?
The market size is estimated to be USD 41.52 Million as of 2022.
5. What are some drivers contributing to market growth?
Growing Demand for Nutricosmetics Among Millennials; Growing Beauty and Wellness Trend.
6. What are the notable trends driving market growth?
OTHER KEY INDUSTRY TRENDS COVERED IN THE REPORT.
7. Are there any restraints impacting market growth?
Stringent Government Regulations and Product Guidelines.
8. Can you provide examples of recent developments in the market?
September 2023: House Food Groups Inc. acquired 100% of Keystone Natural Holdings, LLC (“KNH”), a leading manufacturer of tofu and plant-based foods in North America. The acquisition is meant to assist the company's expansion in United States and Europe with tofu as their core product.July 2023: Beyond Meat expanded its range in Germany with two new plant-based chicken-style products: Beyond Nuggets and Beyond Tenders in over 1,600 REWE stores across Germany.April 2023: Beyond Meat, a leader in plant-based meat, announced the launch of Beyond Pepperoni and Beyond Chicken Fillet, building on their recent rollout of Beyond Steak.
9. What pricing options are available for accessing the report?
Pricing options include single-user, multi-user, and enterprise licenses priced at USD 3800, USD 4500, and USD 5800 respectively.
10. Is the market size provided in terms of value or volume?
The market size is provided in terms of value, measured in Million and volume, measured in K Units.
11. Are there any specific market keywords associated with the report?
Yes, the market keyword associated with the report is "Meat Substitute Industry," which aids in identifying and referencing the specific market segment covered.
12. How do I determine which pricing option suits my needs best?
The pricing options vary based on user requirements and access needs. Individual users may opt for single-user licenses, while businesses requiring broader access may choose multi-user or enterprise licenses for cost-effective access to the report.
13. Are there any additional resources or data provided in the Meat Substitute Industry report?
While the report offers comprehensive insights, it's advisable to review the specific contents or supplementary materials provided to ascertain if additional resources or data are available.
14. How can I stay updated on further developments or reports in the Meat Substitute Industry?
To stay informed about further developments, trends, and reports in the Meat Substitute Industry, consider subscribing to industry newsletters, following relevant companies and organizations, or regularly checking reputable industry news sources and publications.
Methodology
Step 1 - Identification of Relevant Samples Size from Population Database


Step 2 - Approaches for Defining Global Market Size (Value, Volume* & Price*)

Note*: In applicable scenarios
Step 3 - Data Sources
Primary Research
- Web Analytics
- Survey Reports
- Research Institute
- Latest Research Reports
- Opinion Leaders
Secondary Research
- Annual Reports
- White Paper
- Latest Press Release
- Industry Association
- Paid Database
- Investor Presentations

Step 4 - Data Triangulation
Involves using different sources of information in order to increase the validity of a study
These sources are likely to be stakeholders in a program - participants, other researchers, program staff, other community members, and so on.
Then we put all data in single framework & apply various statistical tools to find out the dynamic on the market.
During the analysis stage, feedback from the stakeholder groups would be compared to determine areas of agreement as well as areas of divergence


