
Key Insights
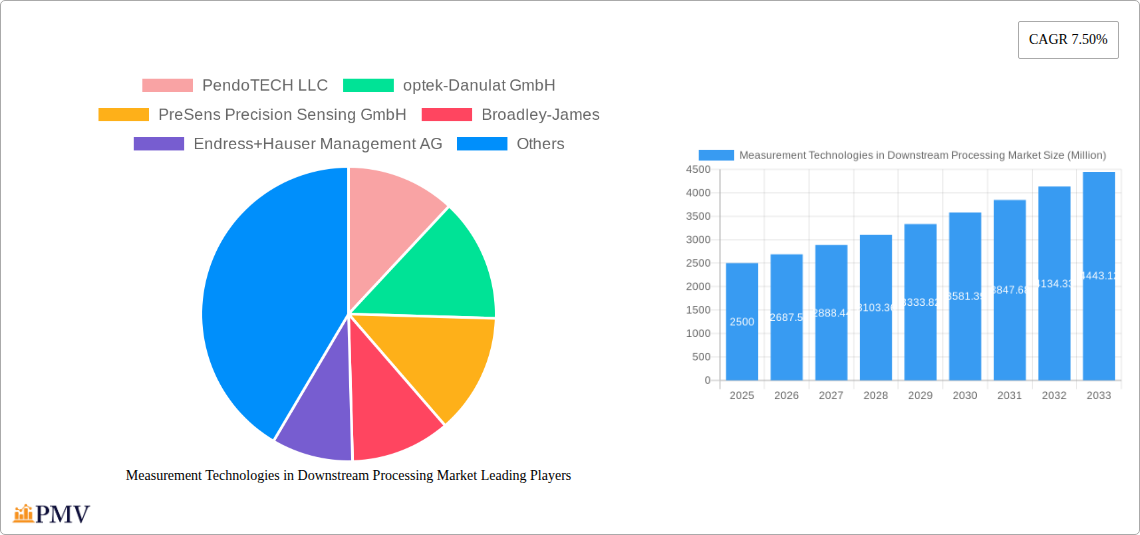
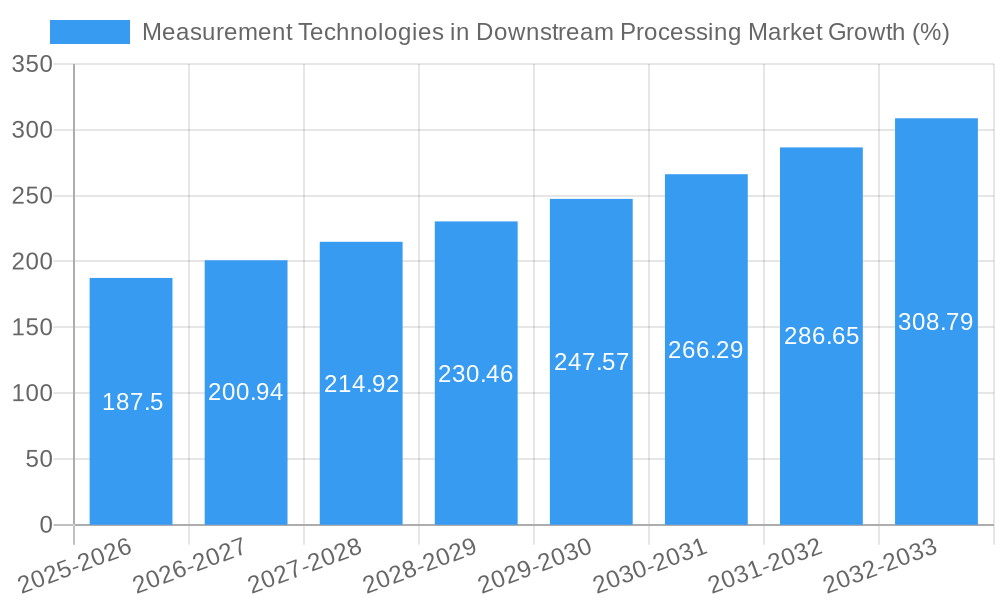
The Measurement Technologies in Downstream Processing market is experiencing robust growth, driven by increasing demand for biopharmaceuticals and advancements in process analytical technologies (PAT). The market, valued at approximately $2.5 billion in 2025, is projected to exhibit a compound annual growth rate (CAGR) of 7.5% from 2025 to 2033, reaching an estimated value exceeding $4.5 billion by 2033. This expansion is fueled by several key factors. Firstly, the rising prevalence of chronic diseases globally is significantly increasing the demand for biologics, driving investment in efficient and precise downstream processing. Secondly, the adoption of single-use technologies is gaining momentum, offering advantages in terms of reduced cleaning validation needs and improved process flexibility. This trend is particularly pronounced in the pharmaceutical and biopharmaceutical sectors, with Contract Manufacturing Organizations (CMOs) playing a crucial role in driving adoption. Furthermore, technological advancements in sensors, transmitters, and controllers are enhancing the accuracy and speed of measurements, leading to improved process optimization and yield. While regulatory hurdles and the high initial investment cost of implementing advanced technologies represent some restraints, the overall market outlook remains strongly positive.
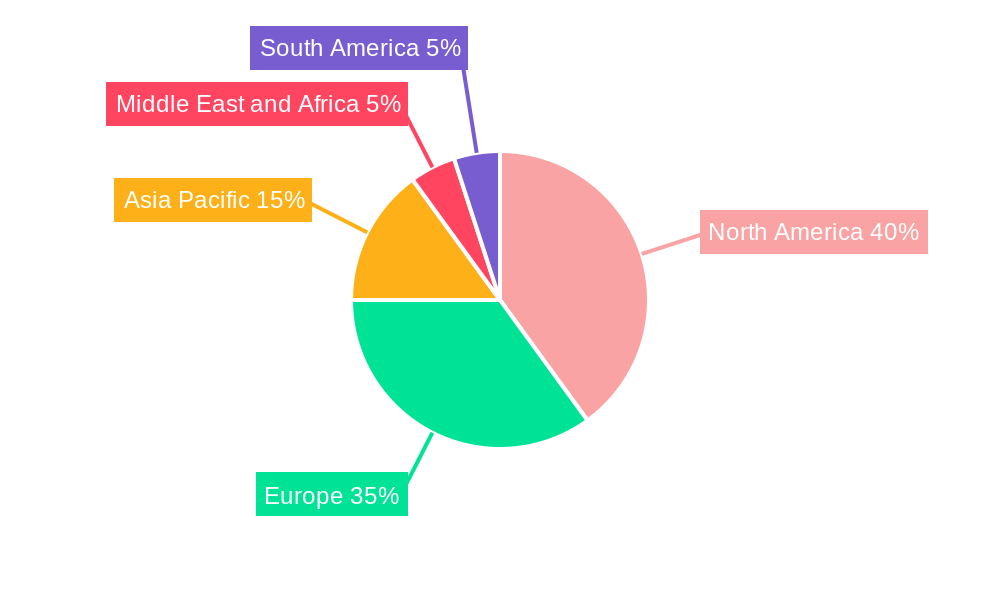
The market segmentation reveals a significant share held by single-use technologies due to their cost-effectiveness and ease of use, particularly in smaller-scale bioprocessing. Pharma and biopharmaceutical companies are the largest end-users, followed by CMOs. Geographically, North America and Europe currently dominate the market, driven by strong research and development activities and established biopharmaceutical industries. However, the Asia-Pacific region is expected to witness substantial growth in the coming years, fueled by increasing investments in pharmaceutical manufacturing infrastructure and a growing demand for biopharmaceuticals in developing economies. The competitive landscape is characterized by both established players like Thermo Fisher Scientific and Mettler Toledo, and specialized companies focused on niche technologies. This competitive dynamic further drives innovation and accessibility within the market, contributing to its continued expansion.
Measurement Technologies in Downstream Processing Market: A Comprehensive Analysis (2019-2033)
This comprehensive report provides an in-depth analysis of the Measurement Technologies in Downstream Processing Market, offering valuable insights for stakeholders across the pharmaceutical and biopharmaceutical industries. Covering the period 2019-2033, with a focus on 2025, this report meticulously examines market dynamics, competitive landscapes, and future growth prospects. The market is projected to reach xx Million by 2033, exhibiting a CAGR of xx% during the forecast period (2025-2033).
Measurement Technologies in Downstream Processing Market Market Structure & Competitive Dynamics
The Measurement Technologies in Downstream Processing market exhibits a moderately consolidated structure, with several key players holding significant market share. The market concentration is influenced by factors such as technological advancements, regulatory approvals, and strategic mergers and acquisitions (M&A) activities. Innovation ecosystems are vibrant, with continuous development of advanced sensors, controllers, and software solutions. Regulatory frameworks, particularly those related to data integrity and GMP compliance, significantly impact market operations. Product substitutes, while limited, include traditional manual methods, which are increasingly being replaced by automated, precise measurement technologies. End-user trends toward increased process efficiency and automation drive demand for sophisticated measurement solutions. M&A activities have played a crucial role in shaping market dynamics, with deal values reaching xx Million in the past five years.
- Market Share: Thermo Fisher Scientific and Mettler Toledo hold the largest market shares, estimated at xx% and xx% respectively in 2025. Other major players such as Endress+Hauser Management AG and Hamilton Company account for a combined xx% share.
- M&A Activity: The last five years witnessed xx significant M&A deals, with a total value exceeding xx Million, driving consolidation and expansion within the market. These deals predominantly involved acquisitions of smaller, specialized technology providers by larger companies seeking to expand their product portfolios and market reach.
Measurement Technologies in Downstream Processing Market Industry Trends & Insights
The Measurement Technologies in Downstream Processing market is experiencing robust growth driven by several factors. The increasing demand for biologics and advanced therapies, coupled with stringent regulatory requirements for data accuracy and consistency, fuels the adoption of sophisticated measurement technologies. Technological advancements, such as miniaturization, improved sensor accuracy, and real-time data analysis capabilities, are driving innovation and market expansion. The shift towards single-use systems in downstream processing is further boosting demand for compatible measurement solutions. Consumer preference for reliable, efficient, and cost-effective solutions shapes market trends. The market is experiencing significant competitive pressure, prompting companies to invest in R&D, enhance product offerings, and strengthen their market positions. The market penetration of advanced sensors, particularly in bioprocessing, is increasing at a CAGR of xx%.
Dominant Markets & Segments in Measurement Technologies in Downstream Processing Market
The North American region dominates the Measurement Technologies in Downstream Processing market, driven by a strong pharmaceutical and biopharmaceutical industry, coupled with robust R&D investment and technological advancements. Within this region, the United States holds the largest market share.
By Product: Sensors and transmitters and controllers segment accounts for the largest market share, driven by the need for precise and real-time monitoring of critical process parameters. Buffers and standard reagents contribute significantly as crucial components of the measurement process.
By Usage: Single-use systems are experiencing rapid growth due to their advantages in terms of reduced cleaning validation and contamination risks.
By End-User: Pharma and biopharmaceutical companies constitute the primary end-users, followed by Contract Manufacturing Organizations (CMOs).
- Key Drivers for North American Dominance:
- Strong regulatory support for innovation.
- High concentration of pharmaceutical and biopharmaceutical companies.
- Significant investments in R&D.
- Well-established infrastructure for manufacturing and distribution.
Measurement Technologies in Downstream Processing Market Product Innovations
Recent innovations include the development of miniaturized sensors with improved accuracy and sensitivity, enabling real-time monitoring of critical process parameters. Wireless connectivity and data integration capabilities are enhancing operational efficiency and data management. The integration of advanced analytics and AI-powered predictive models is transforming downstream processing, optimizing yields and reducing operational costs. These advancements cater to the industry's growing demand for enhanced process control, improved data integrity, and efficient resource utilization.
Report Segmentation & Scope
This report segments the Measurement Technologies in Downstream Processing market by product (Sensors, Transmitters and Controllers; Buffers and Standard Reagents; Others), by usage (Single-Use; Reusable), and by end-user (Pharma and Biopharmaceutical Companies; Contract Manufacturing Organizations; Others). Each segment's growth projections, market sizes, and competitive dynamics are analyzed. Growth projections vary significantly across segments, with single-use systems and advanced sensors exhibiting the highest growth rates. The competitive landscape is characterized by a mix of established players and emerging innovators, creating both opportunities and challenges.
Key Drivers of Measurement Technologies in Downstream Processing Market Growth
Several factors contribute to the market's growth. Technological advancements such as the development of advanced sensors with improved accuracy, sensitivity, and reliability drive demand. The increasing adoption of single-use technologies in downstream processing streamlines operations and reduces contamination risk. Stringent regulatory requirements for data integrity and process monitoring propel the demand for sophisticated measurement systems. Finally, the increasing production of biologics and advanced therapies significantly contributes to market expansion.
Challenges in the Measurement Technologies in Downstream Processing Market Sector
The market faces challenges, including the high cost of advanced measurement technologies and the need for specialized expertise in system integration and data analysis. Regulatory compliance requirements can be complex and costly. Supply chain disruptions can impact the availability of critical components. Intense competition and pressure to reduce costs further challenge market participants. These factors contribute to price sensitivity and affect profitability.
Leading Players in the Measurement Technologies in Downstream Processing Market Market
- PendoTECH LLC
- optek-Danulat GmbH
- PreSens Precision Sensing GmbH
- Broadley-James
- Endress+Hauser Management AG
- Mettler Toledo
- Hamilton Company
- Applikon Biotechnology BV
- Thermo Fisher Scientific
Key Developments in Measurement Technologies in Downstream Processing Market Sector
- 2022-Q4: Thermo Fisher Scientific launched a new line of advanced sensors for bioprocessing applications.
- 2023-Q1: Mettler Toledo acquired a small sensor technology company, expanding its product portfolio.
- 2023-Q2: Endress+Hauser partnered with a software provider to integrate advanced analytics into its measurement systems. (Further developments can be added here as they occur)
Strategic Measurement Technologies in Downstream Processing Market Market Outlook
The Measurement Technologies in Downstream Processing market is poised for significant growth, driven by continuous technological advancements, increasing demand for biologics and advanced therapies, and the growing adoption of single-use systems. Strategic opportunities exist in developing innovative sensors, improving data analytics capabilities, and expanding into emerging markets. Companies that can successfully navigate regulatory requirements, address supply chain challenges, and offer cost-effective solutions will be well-positioned for success. The market is expected to witness a wave of consolidation and strategic partnerships in the coming years.
Measurement Technologies in Downstream Processing Market Segmentation
-
1. Product
- 1.1. Sensors
- 1.2. Transmitters and Controllers
- 1.3. Buffers and Standard Reagents
- 1.4. Others
-
2. Usage
- 2.1. Single-Use
- 2.2. Reusable
-
3. End-User
- 3.1. Pharma and Biopharmaceutical Companies
- 3.2. Contract Manufacturing Organizations
- 3.3. Others
Measurement Technologies in Downstream Processing Market Segmentation By Geography
-
1. North America
- 1.1. United States
- 1.2. Canada
- 1.3. Mexico
-
2. Europe
- 2.1. Germany
- 2.2. United Kingdom
- 2.3. France
- 2.4. Italy
- 2.5. Spain
- 2.6. Rest of Europe
-
3. Asia Pacific
- 3.1. China
- 3.2. Japan
- 3.3. India
- 3.4. Australia
- 3.5. South Korea
- 3.6. Rest of Asia Pacific
-
4. Middle East and Africa
- 4.1. GCC
- 4.2. South Africa
- 4.3. Rest of Middle East and Africa
-
5. South America
- 5.1. Brazil
- 5.2. Argentina
- 5.3. Rest of South America
Measurement Technologies in Downstream Processing Market REPORT HIGHLIGHTS
| Aspects | Details |
|---|---|
| Study Period | 2019-2033 |
| Base Year | 2024 |
| Estimated Year | 2025 |
| Forecast Period | 2025-2033 |
| Historical Period | 2019-2024 |
| Growth Rate | CAGR of 7.50% from 2019-2033 |
| Segmentation |
|
Table of Contents
- 1. Introduction
- 1.1. Research Scope
- 1.2. Market Segmentation
- 1.3. Research Methodology
- 1.4. Definitions and Assumptions
- 2. Executive Summary
- 2.1. Introduction
- 3. Market Dynamics
- 3.1. Introduction
- 3.2. Market Drivers
- 3.2.1. ; Increasing Demand for Continuous Measurement of Quality in Bio processing; Advancements in Measurement Technologies
- 3.3. Market Restrains
- 3.3.1. ; Lack of Skilled Professionals; High Price of Measurement Solutions
- 3.4. Market Trends
- 3.4.1. Sensors are Anticipated to Have Significant Share
- 4. Market Factor Analysis
- 4.1. Porters Five Forces
- 4.2. Supply/Value Chain
- 4.3. PESTEL analysis
- 4.4. Market Entropy
- 4.5. Patent/Trademark Analysis
- 5. Global Measurement Technologies in Downstream Processing Market Analysis, Insights and Forecast, 2019-2031
- 5.1. Market Analysis, Insights and Forecast - by Product
- 5.1.1. Sensors
- 5.1.2. Transmitters and Controllers
- 5.1.3. Buffers and Standard Reagents
- 5.1.4. Others
- 5.2. Market Analysis, Insights and Forecast - by Usage
- 5.2.1. Single-Use
- 5.2.2. Reusable
- 5.3. Market Analysis, Insights and Forecast - by End-User
- 5.3.1. Pharma and Biopharmaceutical Companies
- 5.3.2. Contract Manufacturing Organizations
- 5.3.3. Others
- 5.4. Market Analysis, Insights and Forecast - by Region
- 5.4.1. North America
- 5.4.2. Europe
- 5.4.3. Asia Pacific
- 5.4.4. Middle East and Africa
- 5.4.5. South America
- 5.1. Market Analysis, Insights and Forecast - by Product
- 6. North America Measurement Technologies in Downstream Processing Market Analysis, Insights and Forecast, 2019-2031
- 6.1. Market Analysis, Insights and Forecast - by Product
- 6.1.1. Sensors
- 6.1.2. Transmitters and Controllers
- 6.1.3. Buffers and Standard Reagents
- 6.1.4. Others
- 6.2. Market Analysis, Insights and Forecast - by Usage
- 6.2.1. Single-Use
- 6.2.2. Reusable
- 6.3. Market Analysis, Insights and Forecast - by End-User
- 6.3.1. Pharma and Biopharmaceutical Companies
- 6.3.2. Contract Manufacturing Organizations
- 6.3.3. Others
- 6.1. Market Analysis, Insights and Forecast - by Product
- 7. Europe Measurement Technologies in Downstream Processing Market Analysis, Insights and Forecast, 2019-2031
- 7.1. Market Analysis, Insights and Forecast - by Product
- 7.1.1. Sensors
- 7.1.2. Transmitters and Controllers
- 7.1.3. Buffers and Standard Reagents
- 7.1.4. Others
- 7.2. Market Analysis, Insights and Forecast - by Usage
- 7.2.1. Single-Use
- 7.2.2. Reusable
- 7.3. Market Analysis, Insights and Forecast - by End-User
- 7.3.1. Pharma and Biopharmaceutical Companies
- 7.3.2. Contract Manufacturing Organizations
- 7.3.3. Others
- 7.1. Market Analysis, Insights and Forecast - by Product
- 8. Asia Pacific Measurement Technologies in Downstream Processing Market Analysis, Insights and Forecast, 2019-2031
- 8.1. Market Analysis, Insights and Forecast - by Product
- 8.1.1. Sensors
- 8.1.2. Transmitters and Controllers
- 8.1.3. Buffers and Standard Reagents
- 8.1.4. Others
- 8.2. Market Analysis, Insights and Forecast - by Usage
- 8.2.1. Single-Use
- 8.2.2. Reusable
- 8.3. Market Analysis, Insights and Forecast - by End-User
- 8.3.1. Pharma and Biopharmaceutical Companies
- 8.3.2. Contract Manufacturing Organizations
- 8.3.3. Others
- 8.1. Market Analysis, Insights and Forecast - by Product
- 9. Middle East and Africa Measurement Technologies in Downstream Processing Market Analysis, Insights and Forecast, 2019-2031
- 9.1. Market Analysis, Insights and Forecast - by Product
- 9.1.1. Sensors
- 9.1.2. Transmitters and Controllers
- 9.1.3. Buffers and Standard Reagents
- 9.1.4. Others
- 9.2. Market Analysis, Insights and Forecast - by Usage
- 9.2.1. Single-Use
- 9.2.2. Reusable
- 9.3. Market Analysis, Insights and Forecast - by End-User
- 9.3.1. Pharma and Biopharmaceutical Companies
- 9.3.2. Contract Manufacturing Organizations
- 9.3.3. Others
- 9.1. Market Analysis, Insights and Forecast - by Product
- 10. South America Measurement Technologies in Downstream Processing Market Analysis, Insights and Forecast, 2019-2031
- 10.1. Market Analysis, Insights and Forecast - by Product
- 10.1.1. Sensors
- 10.1.2. Transmitters and Controllers
- 10.1.3. Buffers and Standard Reagents
- 10.1.4. Others
- 10.2. Market Analysis, Insights and Forecast - by Usage
- 10.2.1. Single-Use
- 10.2.2. Reusable
- 10.3. Market Analysis, Insights and Forecast - by End-User
- 10.3.1. Pharma and Biopharmaceutical Companies
- 10.3.2. Contract Manufacturing Organizations
- 10.3.3. Others
- 10.1. Market Analysis, Insights and Forecast - by Product
- 11. North America Measurement Technologies in Downstream Processing Market Analysis, Insights and Forecast, 2019-2031
- 11.1. Market Analysis, Insights and Forecast - By Country/Sub-region
- 11.1.1 United States
- 11.1.2 Canada
- 11.1.3 Mexico
- 12. Europe Measurement Technologies in Downstream Processing Market Analysis, Insights and Forecast, 2019-2031
- 12.1. Market Analysis, Insights and Forecast - By Country/Sub-region
- 12.1.1 Germany
- 12.1.2 United Kingdom
- 12.1.3 France
- 12.1.4 Italy
- 12.1.5 Spain
- 12.1.6 Rest of Europe
- 13. Asia Pacific Measurement Technologies in Downstream Processing Market Analysis, Insights and Forecast, 2019-2031
- 13.1. Market Analysis, Insights and Forecast - By Country/Sub-region
- 13.1.1 China
- 13.1.2 Japan
- 13.1.3 India
- 13.1.4 Australia
- 13.1.5 South Korea
- 13.1.6 Rest of Asia Pacific
- 14. Middle East and Africa Measurement Technologies in Downstream Processing Market Analysis, Insights and Forecast, 2019-2031
- 14.1. Market Analysis, Insights and Forecast - By Country/Sub-region
- 14.1.1 GCC
- 14.1.2 South Africa
- 14.1.3 Rest of Middle East and Africa
- 15. South America Measurement Technologies in Downstream Processing Market Analysis, Insights and Forecast, 2019-2031
- 15.1. Market Analysis, Insights and Forecast - By Country/Sub-region
- 15.1.1 Brazil
- 15.1.2 Argentina
- 15.1.3 Rest of South America
- 16. Competitive Analysis
- 16.1. Global Market Share Analysis 2024
- 16.2. Company Profiles
- 16.2.1 PendoTECH LLC
- 16.2.1.1. Overview
- 16.2.1.2. Products
- 16.2.1.3. SWOT Analysis
- 16.2.1.4. Recent Developments
- 16.2.1.5. Financials (Based on Availability)
- 16.2.2 optek-Danulat GmbH
- 16.2.2.1. Overview
- 16.2.2.2. Products
- 16.2.2.3. SWOT Analysis
- 16.2.2.4. Recent Developments
- 16.2.2.5. Financials (Based on Availability)
- 16.2.3 PreSens Precision Sensing GmbH
- 16.2.3.1. Overview
- 16.2.3.2. Products
- 16.2.3.3. SWOT Analysis
- 16.2.3.4. Recent Developments
- 16.2.3.5. Financials (Based on Availability)
- 16.2.4 Broadley-James
- 16.2.4.1. Overview
- 16.2.4.2. Products
- 16.2.4.3. SWOT Analysis
- 16.2.4.4. Recent Developments
- 16.2.4.5. Financials (Based on Availability)
- 16.2.5 Endress+Hauser Management AG
- 16.2.5.1. Overview
- 16.2.5.2. Products
- 16.2.5.3. SWOT Analysis
- 16.2.5.4. Recent Developments
- 16.2.5.5. Financials (Based on Availability)
- 16.2.6 Mettler Toledo
- 16.2.6.1. Overview
- 16.2.6.2. Products
- 16.2.6.3. SWOT Analysis
- 16.2.6.4. Recent Developments
- 16.2.6.5. Financials (Based on Availability)
- 16.2.7 Hamilton Company
- 16.2.7.1. Overview
- 16.2.7.2. Products
- 16.2.7.3. SWOT Analysis
- 16.2.7.4. Recent Developments
- 16.2.7.5. Financials (Based on Availability)
- 16.2.8 Applikon Biotechnology BV
- 16.2.8.1. Overview
- 16.2.8.2. Products
- 16.2.8.3. SWOT Analysis
- 16.2.8.4. Recent Developments
- 16.2.8.5. Financials (Based on Availability)
- 16.2.9 Thermo Fisher Scientific
- 16.2.9.1. Overview
- 16.2.9.2. Products
- 16.2.9.3. SWOT Analysis
- 16.2.9.4. Recent Developments
- 16.2.9.5. Financials (Based on Availability)
- 16.2.1 PendoTECH LLC
List of Figures
- Figure 1: Global Measurement Technologies in Downstream Processing Market Revenue Breakdown (Million, %) by Region 2024 & 2032
- Figure 2: North America Measurement Technologies in Downstream Processing Market Revenue (Million), by Country 2024 & 2032
- Figure 3: North America Measurement Technologies in Downstream Processing Market Revenue Share (%), by Country 2024 & 2032
- Figure 4: Europe Measurement Technologies in Downstream Processing Market Revenue (Million), by Country 2024 & 2032
- Figure 5: Europe Measurement Technologies in Downstream Processing Market Revenue Share (%), by Country 2024 & 2032
- Figure 6: Asia Pacific Measurement Technologies in Downstream Processing Market Revenue (Million), by Country 2024 & 2032
- Figure 7: Asia Pacific Measurement Technologies in Downstream Processing Market Revenue Share (%), by Country 2024 & 2032
- Figure 8: Middle East and Africa Measurement Technologies in Downstream Processing Market Revenue (Million), by Country 2024 & 2032
- Figure 9: Middle East and Africa Measurement Technologies in Downstream Processing Market Revenue Share (%), by Country 2024 & 2032
- Figure 10: South America Measurement Technologies in Downstream Processing Market Revenue (Million), by Country 2024 & 2032
- Figure 11: South America Measurement Technologies in Downstream Processing Market Revenue Share (%), by Country 2024 & 2032
- Figure 12: North America Measurement Technologies in Downstream Processing Market Revenue (Million), by Product 2024 & 2032
- Figure 13: North America Measurement Technologies in Downstream Processing Market Revenue Share (%), by Product 2024 & 2032
- Figure 14: North America Measurement Technologies in Downstream Processing Market Revenue (Million), by Usage 2024 & 2032
- Figure 15: North America Measurement Technologies in Downstream Processing Market Revenue Share (%), by Usage 2024 & 2032
- Figure 16: North America Measurement Technologies in Downstream Processing Market Revenue (Million), by End-User 2024 & 2032
- Figure 17: North America Measurement Technologies in Downstream Processing Market Revenue Share (%), by End-User 2024 & 2032
- Figure 18: North America Measurement Technologies in Downstream Processing Market Revenue (Million), by Country 2024 & 2032
- Figure 19: North America Measurement Technologies in Downstream Processing Market Revenue Share (%), by Country 2024 & 2032
- Figure 20: Europe Measurement Technologies in Downstream Processing Market Revenue (Million), by Product 2024 & 2032
- Figure 21: Europe Measurement Technologies in Downstream Processing Market Revenue Share (%), by Product 2024 & 2032
- Figure 22: Europe Measurement Technologies in Downstream Processing Market Revenue (Million), by Usage 2024 & 2032
- Figure 23: Europe Measurement Technologies in Downstream Processing Market Revenue Share (%), by Usage 2024 & 2032
- Figure 24: Europe Measurement Technologies in Downstream Processing Market Revenue (Million), by End-User 2024 & 2032
- Figure 25: Europe Measurement Technologies in Downstream Processing Market Revenue Share (%), by End-User 2024 & 2032
- Figure 26: Europe Measurement Technologies in Downstream Processing Market Revenue (Million), by Country 2024 & 2032
- Figure 27: Europe Measurement Technologies in Downstream Processing Market Revenue Share (%), by Country 2024 & 2032
- Figure 28: Asia Pacific Measurement Technologies in Downstream Processing Market Revenue (Million), by Product 2024 & 2032
- Figure 29: Asia Pacific Measurement Technologies in Downstream Processing Market Revenue Share (%), by Product 2024 & 2032
- Figure 30: Asia Pacific Measurement Technologies in Downstream Processing Market Revenue (Million), by Usage 2024 & 2032
- Figure 31: Asia Pacific Measurement Technologies in Downstream Processing Market Revenue Share (%), by Usage 2024 & 2032
- Figure 32: Asia Pacific Measurement Technologies in Downstream Processing Market Revenue (Million), by End-User 2024 & 2032
- Figure 33: Asia Pacific Measurement Technologies in Downstream Processing Market Revenue Share (%), by End-User 2024 & 2032
- Figure 34: Asia Pacific Measurement Technologies in Downstream Processing Market Revenue (Million), by Country 2024 & 2032
- Figure 35: Asia Pacific Measurement Technologies in Downstream Processing Market Revenue Share (%), by Country 2024 & 2032
- Figure 36: Middle East and Africa Measurement Technologies in Downstream Processing Market Revenue (Million), by Product 2024 & 2032
- Figure 37: Middle East and Africa Measurement Technologies in Downstream Processing Market Revenue Share (%), by Product 2024 & 2032
- Figure 38: Middle East and Africa Measurement Technologies in Downstream Processing Market Revenue (Million), by Usage 2024 & 2032
- Figure 39: Middle East and Africa Measurement Technologies in Downstream Processing Market Revenue Share (%), by Usage 2024 & 2032
- Figure 40: Middle East and Africa Measurement Technologies in Downstream Processing Market Revenue (Million), by End-User 2024 & 2032
- Figure 41: Middle East and Africa Measurement Technologies in Downstream Processing Market Revenue Share (%), by End-User 2024 & 2032
- Figure 42: Middle East and Africa Measurement Technologies in Downstream Processing Market Revenue (Million), by Country 2024 & 2032
- Figure 43: Middle East and Africa Measurement Technologies in Downstream Processing Market Revenue Share (%), by Country 2024 & 2032
- Figure 44: South America Measurement Technologies in Downstream Processing Market Revenue (Million), by Product 2024 & 2032
- Figure 45: South America Measurement Technologies in Downstream Processing Market Revenue Share (%), by Product 2024 & 2032
- Figure 46: South America Measurement Technologies in Downstream Processing Market Revenue (Million), by Usage 2024 & 2032
- Figure 47: South America Measurement Technologies in Downstream Processing Market Revenue Share (%), by Usage 2024 & 2032
- Figure 48: South America Measurement Technologies in Downstream Processing Market Revenue (Million), by End-User 2024 & 2032
- Figure 49: South America Measurement Technologies in Downstream Processing Market Revenue Share (%), by End-User 2024 & 2032
- Figure 50: South America Measurement Technologies in Downstream Processing Market Revenue (Million), by Country 2024 & 2032
- Figure 51: South America Measurement Technologies in Downstream Processing Market Revenue Share (%), by Country 2024 & 2032
List of Tables
- Table 1: Global Measurement Technologies in Downstream Processing Market Revenue Million Forecast, by Region 2019 & 2032
- Table 2: Global Measurement Technologies in Downstream Processing Market Revenue Million Forecast, by Product 2019 & 2032
- Table 3: Global Measurement Technologies in Downstream Processing Market Revenue Million Forecast, by Usage 2019 & 2032
- Table 4: Global Measurement Technologies in Downstream Processing Market Revenue Million Forecast, by End-User 2019 & 2032
- Table 5: Global Measurement Technologies in Downstream Processing Market Revenue Million Forecast, by Region 2019 & 2032
- Table 6: Global Measurement Technologies in Downstream Processing Market Revenue Million Forecast, by Country 2019 & 2032
- Table 7: United States Measurement Technologies in Downstream Processing Market Revenue (Million) Forecast, by Application 2019 & 2032
- Table 8: Canada Measurement Technologies in Downstream Processing Market Revenue (Million) Forecast, by Application 2019 & 2032
- Table 9: Mexico Measurement Technologies in Downstream Processing Market Revenue (Million) Forecast, by Application 2019 & 2032
- Table 10: Global Measurement Technologies in Downstream Processing Market Revenue Million Forecast, by Country 2019 & 2032
- Table 11: Germany Measurement Technologies in Downstream Processing Market Revenue (Million) Forecast, by Application 2019 & 2032
- Table 12: United Kingdom Measurement Technologies in Downstream Processing Market Revenue (Million) Forecast, by Application 2019 & 2032
- Table 13: France Measurement Technologies in Downstream Processing Market Revenue (Million) Forecast, by Application 2019 & 2032
- Table 14: Italy Measurement Technologies in Downstream Processing Market Revenue (Million) Forecast, by Application 2019 & 2032
- Table 15: Spain Measurement Technologies in Downstream Processing Market Revenue (Million) Forecast, by Application 2019 & 2032
- Table 16: Rest of Europe Measurement Technologies in Downstream Processing Market Revenue (Million) Forecast, by Application 2019 & 2032
- Table 17: Global Measurement Technologies in Downstream Processing Market Revenue Million Forecast, by Country 2019 & 2032
- Table 18: China Measurement Technologies in Downstream Processing Market Revenue (Million) Forecast, by Application 2019 & 2032
- Table 19: Japan Measurement Technologies in Downstream Processing Market Revenue (Million) Forecast, by Application 2019 & 2032
- Table 20: India Measurement Technologies in Downstream Processing Market Revenue (Million) Forecast, by Application 2019 & 2032
- Table 21: Australia Measurement Technologies in Downstream Processing Market Revenue (Million) Forecast, by Application 2019 & 2032
- Table 22: South Korea Measurement Technologies in Downstream Processing Market Revenue (Million) Forecast, by Application 2019 & 2032
- Table 23: Rest of Asia Pacific Measurement Technologies in Downstream Processing Market Revenue (Million) Forecast, by Application 2019 & 2032
- Table 24: Global Measurement Technologies in Downstream Processing Market Revenue Million Forecast, by Country 2019 & 2032
- Table 25: GCC Measurement Technologies in Downstream Processing Market Revenue (Million) Forecast, by Application 2019 & 2032
- Table 26: South Africa Measurement Technologies in Downstream Processing Market Revenue (Million) Forecast, by Application 2019 & 2032
- Table 27: Rest of Middle East and Africa Measurement Technologies in Downstream Processing Market Revenue (Million) Forecast, by Application 2019 & 2032
- Table 28: Global Measurement Technologies in Downstream Processing Market Revenue Million Forecast, by Country 2019 & 2032
- Table 29: Brazil Measurement Technologies in Downstream Processing Market Revenue (Million) Forecast, by Application 2019 & 2032
- Table 30: Argentina Measurement Technologies in Downstream Processing Market Revenue (Million) Forecast, by Application 2019 & 2032
- Table 31: Rest of South America Measurement Technologies in Downstream Processing Market Revenue (Million) Forecast, by Application 2019 & 2032
- Table 32: Global Measurement Technologies in Downstream Processing Market Revenue Million Forecast, by Product 2019 & 2032
- Table 33: Global Measurement Technologies in Downstream Processing Market Revenue Million Forecast, by Usage 2019 & 2032
- Table 34: Global Measurement Technologies in Downstream Processing Market Revenue Million Forecast, by End-User 2019 & 2032
- Table 35: Global Measurement Technologies in Downstream Processing Market Revenue Million Forecast, by Country 2019 & 2032
- Table 36: United States Measurement Technologies in Downstream Processing Market Revenue (Million) Forecast, by Application 2019 & 2032
- Table 37: Canada Measurement Technologies in Downstream Processing Market Revenue (Million) Forecast, by Application 2019 & 2032
- Table 38: Mexico Measurement Technologies in Downstream Processing Market Revenue (Million) Forecast, by Application 2019 & 2032
- Table 39: Global Measurement Technologies in Downstream Processing Market Revenue Million Forecast, by Product 2019 & 2032
- Table 40: Global Measurement Technologies in Downstream Processing Market Revenue Million Forecast, by Usage 2019 & 2032
- Table 41: Global Measurement Technologies in Downstream Processing Market Revenue Million Forecast, by End-User 2019 & 2032
- Table 42: Global Measurement Technologies in Downstream Processing Market Revenue Million Forecast, by Country 2019 & 2032
- Table 43: Germany Measurement Technologies in Downstream Processing Market Revenue (Million) Forecast, by Application 2019 & 2032
- Table 44: United Kingdom Measurement Technologies in Downstream Processing Market Revenue (Million) Forecast, by Application 2019 & 2032
- Table 45: France Measurement Technologies in Downstream Processing Market Revenue (Million) Forecast, by Application 2019 & 2032
- Table 46: Italy Measurement Technologies in Downstream Processing Market Revenue (Million) Forecast, by Application 2019 & 2032
- Table 47: Spain Measurement Technologies in Downstream Processing Market Revenue (Million) Forecast, by Application 2019 & 2032
- Table 48: Rest of Europe Measurement Technologies in Downstream Processing Market Revenue (Million) Forecast, by Application 2019 & 2032
- Table 49: Global Measurement Technologies in Downstream Processing Market Revenue Million Forecast, by Product 2019 & 2032
- Table 50: Global Measurement Technologies in Downstream Processing Market Revenue Million Forecast, by Usage 2019 & 2032
- Table 51: Global Measurement Technologies in Downstream Processing Market Revenue Million Forecast, by End-User 2019 & 2032
- Table 52: Global Measurement Technologies in Downstream Processing Market Revenue Million Forecast, by Country 2019 & 2032
- Table 53: China Measurement Technologies in Downstream Processing Market Revenue (Million) Forecast, by Application 2019 & 2032
- Table 54: Japan Measurement Technologies in Downstream Processing Market Revenue (Million) Forecast, by Application 2019 & 2032
- Table 55: India Measurement Technologies in Downstream Processing Market Revenue (Million) Forecast, by Application 2019 & 2032
- Table 56: Australia Measurement Technologies in Downstream Processing Market Revenue (Million) Forecast, by Application 2019 & 2032
- Table 57: South Korea Measurement Technologies in Downstream Processing Market Revenue (Million) Forecast, by Application 2019 & 2032
- Table 58: Rest of Asia Pacific Measurement Technologies in Downstream Processing Market Revenue (Million) Forecast, by Application 2019 & 2032
- Table 59: Global Measurement Technologies in Downstream Processing Market Revenue Million Forecast, by Product 2019 & 2032
- Table 60: Global Measurement Technologies in Downstream Processing Market Revenue Million Forecast, by Usage 2019 & 2032
- Table 61: Global Measurement Technologies in Downstream Processing Market Revenue Million Forecast, by End-User 2019 & 2032
- Table 62: Global Measurement Technologies in Downstream Processing Market Revenue Million Forecast, by Country 2019 & 2032
- Table 63: GCC Measurement Technologies in Downstream Processing Market Revenue (Million) Forecast, by Application 2019 & 2032
- Table 64: South Africa Measurement Technologies in Downstream Processing Market Revenue (Million) Forecast, by Application 2019 & 2032
- Table 65: Rest of Middle East and Africa Measurement Technologies in Downstream Processing Market Revenue (Million) Forecast, by Application 2019 & 2032
- Table 66: Global Measurement Technologies in Downstream Processing Market Revenue Million Forecast, by Product 2019 & 2032
- Table 67: Global Measurement Technologies in Downstream Processing Market Revenue Million Forecast, by Usage 2019 & 2032
- Table 68: Global Measurement Technologies in Downstream Processing Market Revenue Million Forecast, by End-User 2019 & 2032
- Table 69: Global Measurement Technologies in Downstream Processing Market Revenue Million Forecast, by Country 2019 & 2032
- Table 70: Brazil Measurement Technologies in Downstream Processing Market Revenue (Million) Forecast, by Application 2019 & 2032
- Table 71: Argentina Measurement Technologies in Downstream Processing Market Revenue (Million) Forecast, by Application 2019 & 2032
- Table 72: Rest of South America Measurement Technologies in Downstream Processing Market Revenue (Million) Forecast, by Application 2019 & 2032
Frequently Asked Questions
1. What is the projected Compound Annual Growth Rate (CAGR) of the Measurement Technologies in Downstream Processing Market?
The projected CAGR is approximately 7.50%.
2. Which companies are prominent players in the Measurement Technologies in Downstream Processing Market?
Key companies in the market include PendoTECH LLC, optek-Danulat GmbH, PreSens Precision Sensing GmbH, Broadley-James, Endress+Hauser Management AG, Mettler Toledo, Hamilton Company, Applikon Biotechnology BV, Thermo Fisher Scientific.
3. What are the main segments of the Measurement Technologies in Downstream Processing Market?
The market segments include Product, Usage, End-User.
4. Can you provide details about the market size?
The market size is estimated to be USD XX Million as of 2022.
5. What are some drivers contributing to market growth?
; Increasing Demand for Continuous Measurement of Quality in Bio processing; Advancements in Measurement Technologies.
6. What are the notable trends driving market growth?
Sensors are Anticipated to Have Significant Share.
7. Are there any restraints impacting market growth?
; Lack of Skilled Professionals; High Price of Measurement Solutions.
8. Can you provide examples of recent developments in the market?
N/A
9. What pricing options are available for accessing the report?
Pricing options include single-user, multi-user, and enterprise licenses priced at USD 4750, USD 5250, and USD 8750 respectively.
10. Is the market size provided in terms of value or volume?
The market size is provided in terms of value, measured in Million.
11. Are there any specific market keywords associated with the report?
Yes, the market keyword associated with the report is "Measurement Technologies in Downstream Processing Market," which aids in identifying and referencing the specific market segment covered.
12. How do I determine which pricing option suits my needs best?
The pricing options vary based on user requirements and access needs. Individual users may opt for single-user licenses, while businesses requiring broader access may choose multi-user or enterprise licenses for cost-effective access to the report.
13. Are there any additional resources or data provided in the Measurement Technologies in Downstream Processing Market report?
While the report offers comprehensive insights, it's advisable to review the specific contents or supplementary materials provided to ascertain if additional resources or data are available.
14. How can I stay updated on further developments or reports in the Measurement Technologies in Downstream Processing Market?
To stay informed about further developments, trends, and reports in the Measurement Technologies in Downstream Processing Market, consider subscribing to industry newsletters, following relevant companies and organizations, or regularly checking reputable industry news sources and publications.
Methodology
Step 1 - Identification of Relevant Samples Size from Population Database


Step 2 - Approaches for Defining Global Market Size (Value, Volume* & Price*)

Note*: In applicable scenarios
Step 3 - Data Sources
Primary Research
- Web Analytics
- Survey Reports
- Research Institute
- Latest Research Reports
- Opinion Leaders
Secondary Research
- Annual Reports
- White Paper
- Latest Press Release
- Industry Association
- Paid Database
- Investor Presentations

Step 4 - Data Triangulation
Involves using different sources of information in order to increase the validity of a study
These sources are likely to be stakeholders in a program - participants, other researchers, program staff, other community members, and so on.
Then we put all data in single framework & apply various statistical tools to find out the dynamic on the market.
During the analysis stage, feedback from the stakeholder groups would be compared to determine areas of agreement as well as areas of divergence


