
Key Insights
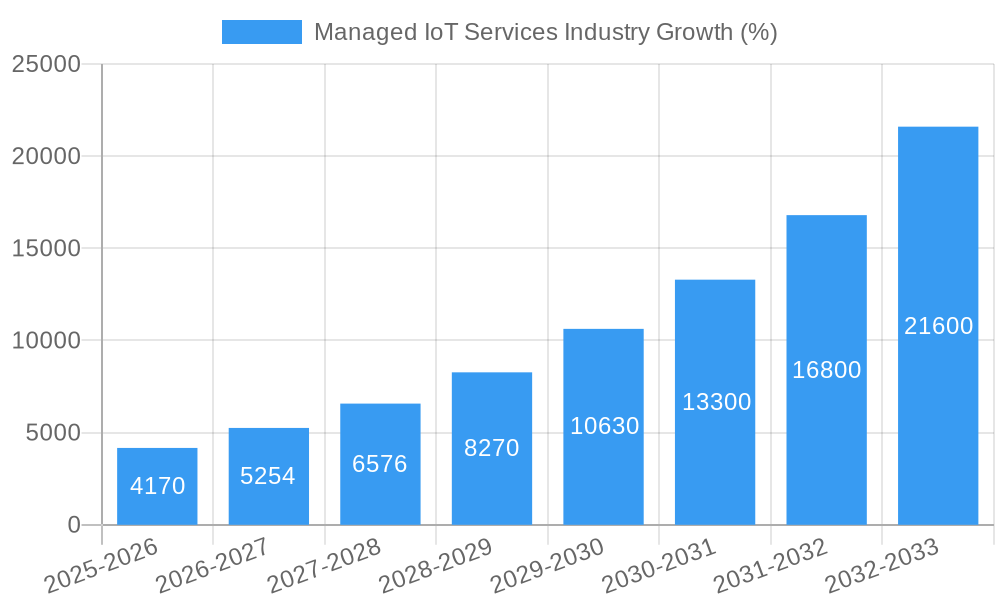
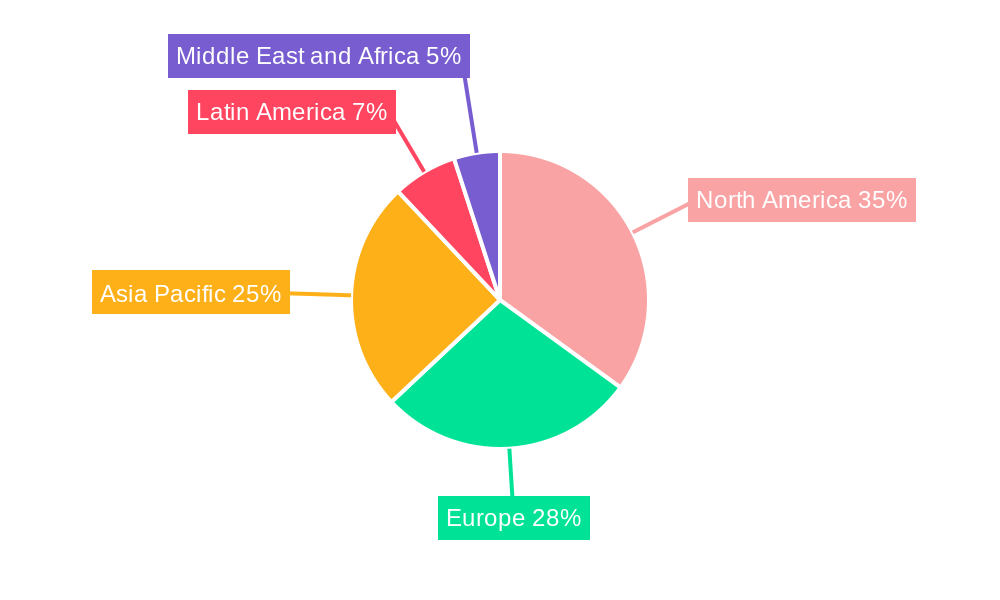
The Managed IoT Services market is experiencing robust growth, driven by the increasing adoption of IoT devices across diverse sectors and the rising need for efficient device management, data analysis, and security. The market's Compound Annual Growth Rate (CAGR) of 27.82% from 2019 to 2024 indicates significant expansion, projected to continue into the forecast period (2025-2033). Key drivers include the proliferation of smart devices, the demand for enhanced operational efficiency, predictive maintenance capabilities, and the growing concerns around data security in interconnected systems. Industries like energy and utilities, manufacturing, and healthcare are leading adopters, leveraging managed IoT services to optimize processes, improve asset management, and enhance customer experiences. The market is segmented by application (network, device, data, and security management) and end-user, reflecting the varied needs and implementation strategies across different sectors. North America and Europe currently hold significant market share, but the Asia-Pacific region is poised for substantial growth due to rapid technological advancements and increasing digitalization. While the initial investment in infrastructure can be a restraint, the long-term cost savings and operational benefits associated with managed IoT services are driving widespread adoption. Competition is intense, with established players like Cisco, Wipro, and TCS competing with specialized providers, leading to innovation and service differentiation.
The forecast for the Managed IoT Services market remains positive, projecting continued expansion through 2033. This growth is fueled by ongoing technological innovations, including advancements in 5G, edge computing, and artificial intelligence, which enhance the capabilities and efficiency of managed IoT services. The increasing focus on data analytics and predictive maintenance will further solidify the market's trajectory. The expansion into new sectors and geographic regions, alongside the emergence of new service models, will contribute to the overall market growth, creating opportunities for both established players and emerging companies. The ongoing development of robust security protocols and solutions will be crucial for maintaining market confidence and fueling broader adoption. The market's evolution is expected to be characterized by increased consolidation, strategic partnerships, and the development of sophisticated solutions catering to specific industry needs.
Managed IoT Services Industry Market Report: 2019-2033
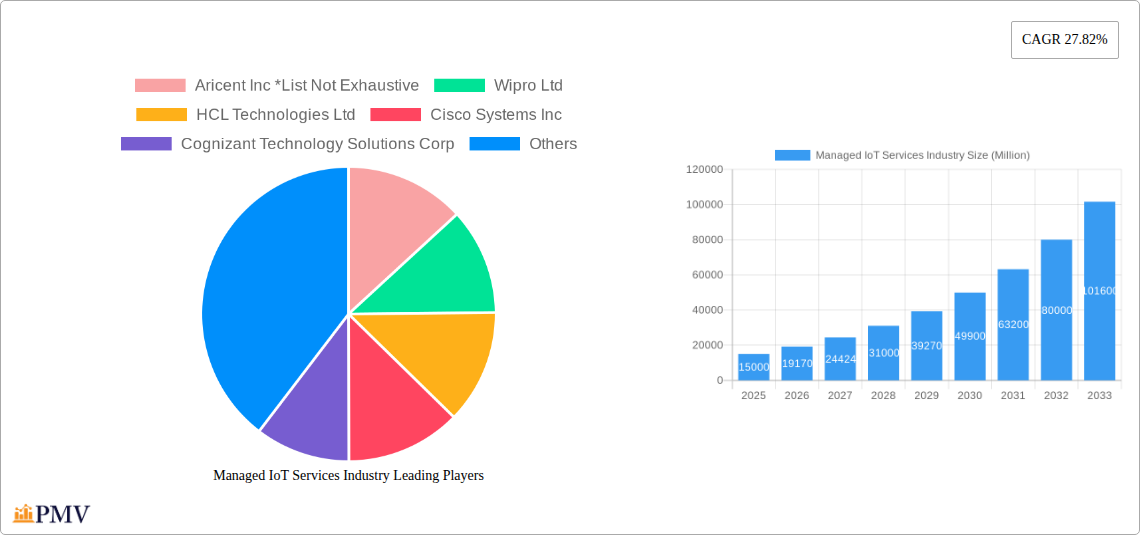
This comprehensive report provides a detailed analysis of the Managed IoT Services industry, offering invaluable insights for businesses, investors, and researchers. The study period spans from 2019 to 2033, with a base year of 2025 and a forecast period from 2025 to 2033. The report utilizes data from the historical period of 2019-2024, and projects a market valuation exceeding xx Million by 2033. Key players analyzed include Aricent Inc, Wipro Ltd, HCL Technologies Ltd, Cisco Systems Inc, Cognizant Technology Solutions Corp, Virtusa Corporation, Tech Mahindra Ltd, Tata Consultancy Services, Infosys Ltd, and Tieto Corporation. This report is indispensable for navigating the complexities and opportunities within this rapidly evolving market.
Managed IoT Services Industry Market Structure & Competitive Dynamics
The Managed IoT Services market exhibits a moderately concentrated structure, with a few large multinational players holding significant market share. The market share distribution is dynamic, influenced by ongoing mergers and acquisitions (M&A) activities, estimated at xx Million in deal value during the historical period. Innovation ecosystems play a crucial role, with continuous development of new technologies and service offerings. Regulatory frameworks vary across regions, impacting market entry and operations. Product substitutes, such as DIY IoT solutions, pose a challenge, while evolving end-user trends toward enhanced security and data analytics are driving demand for sophisticated managed services.
- Market Concentration: Moderate, with top 10 players accounting for approximately xx% of the market.
- M&A Activity: Significant activity in the historical period, with deal values exceeding xx Million.
- Regulatory Landscape: Varies across regions, requiring adaptation of strategies for market entry and operation.
- Innovation Ecosystems: Highly active, driving continuous improvement in service offerings and technological capabilities.
Managed IoT Services Industry Industry Trends & Insights
The Managed IoT Services market is experiencing robust growth, driven by factors such as the increasing adoption of IoT devices across various industries, coupled with the growing need for efficient and secure management of these devices and their generated data. The market exhibits a Compound Annual Growth Rate (CAGR) of xx% during the forecast period, reflecting a high market penetration rate. Technological advancements such as AI and machine learning are enhancing service capabilities, while shifting consumer preferences towards cloud-based solutions are shaping market demand. Competitive dynamics involve strategic partnerships and investments in innovation.
Dominant Markets & Segments in Managed IoT Services Industry
The North American region holds a leading position in the Managed IoT Services market, driven by strong technological advancements, substantial investments in infrastructure development, and a highly developed digital ecosystem. Within the application segments, Network Management and Security Management are experiencing the highest growth due to the increasing need for robust network infrastructure and security protocols in the face of growing cybersecurity threats. The manufacturing and energy and utilities sectors dominate the end-user segment, fueled by the need to improve operational efficiency and enhance predictive maintenance capabilities.
Leading Region: North America
Key Drivers in North America: Advanced technological infrastructure, high adoption of IoT devices, supportive government policies, and extensive research & development efforts.
Leading Application Segment: Network Management and Security Management
Key Drivers in Application Segments: Rising demand for robust network infrastructure and sophisticated security solutions.
Leading End-user Segment: Manufacturing and Energy & Utilities
Key Drivers in End-user Segments: Need for improved efficiency, predictive maintenance, optimized resource management, and enhanced security.
Managed IoT Services Industry Product Innovations
Recent product innovations focus on AI-powered predictive analytics for improved operational efficiency and proactive security measures, including advanced threat detection and response capabilities. The integration of edge computing technologies enables real-time data processing and reduces latency, enhancing overall system performance. These innovations are designed to meet the evolving needs of businesses, providing scalable and secure solutions tailored to specific industry requirements.
Report Segmentation & Scope
The report segments the Managed IoT Services market by application (Network Management, Device Management, Data Management, Security Management, Other Applications) and by end-user (Energy and Utilities, Manufacturing, Retail, Healthcare, BFSI, IT & Telecom, Other End-users). Each segment includes analysis of market size, growth projections, and competitive dynamics. For example, the Network Management segment is projected to grow at a CAGR of xx%, driven by increasing network complexity and the need for effective management solutions.
Key Drivers of Managed IoT Services Industry Growth
Several factors contribute to the growth of the Managed IoT Services market. Technological advancements, such as the development of 5G networks and the increased adoption of cloud computing, have significantly improved the capabilities and accessibility of IoT services. Furthermore, the growing demand for data analytics and AI-driven insights across various industries has accelerated the adoption of Managed IoT services. Favorable government regulations and initiatives that promote the implementation of IoT solutions have further facilitated the market’s expansion.
Challenges in the Managed IoT Services Industry Sector
The Managed IoT Services industry faces challenges, including the complexities of data security and privacy regulations, which vary across regions. Supply chain disruptions and the increasing costs of skilled labor are also impacting industry growth. Furthermore, intense competition from both established players and emerging startups presents a significant hurdle to sustained growth. These challenges, if not managed effectively, could constrain market expansion in the coming years.
Leading Players in the Managed IoT Services Industry Market
- Aricent Inc *List Not Exhaustive
- Wipro Ltd
- HCL Technologies Ltd
- Cisco Systems Inc
- Cognizant Technology Solutions Corp
- Virtusa Corporation
- Tech Mahindra Ltd
- Tata Consultancy Services
- Infosys Ltd
- Tieto Corporation
Key Developments in Managed IoT Services Industry Sector
- December 2022: KORE partners with Google Cloud to enhance global IoT functionality. This strategic partnership significantly expands the reach and capabilities of IoT solutions.
- May 2022: HCL Technologies and SAP collaborate on industry-relevant IoT packaged offerings. This collaboration simplifies the implementation of Industry 4.0 transformations.
Strategic Managed IoT Services Industry Market Outlook
The Managed IoT Services market is poised for substantial growth, driven by increasing demand for secure and efficient IoT management solutions across a wide range of industries. Strategic opportunities exist in expanding into emerging markets, focusing on specialized industry-specific solutions, and investing in cutting-edge technologies such as AI and edge computing. Companies that can effectively address the challenges of data security, interoperability, and scaling will be well-positioned to capitalize on the significant growth potential in this dynamic market.
Managed IoT Services Industry Segmentation
-
1. Application
- 1.1. Network Management
- 1.2. Device Management
- 1.3. Data Management
- 1.4. Security Management
- 1.5. Other Applications
-
2. End-user
- 2.1. Energy and Utilities
- 2.2. Manufacturing
- 2.3. Retail
- 2.4. Healthcare
- 2.5. BFSI
- 2.6. IT & Telecom
- 2.7. Other End-users
Managed IoT Services Industry Segmentation By Geography
-
1. North America
- 1.1. United States
- 1.2. Canada
- 1.3. Rest of North America
-
2. Europe
- 2.1. Germany
- 2.2. United Kingdom
- 2.3. France
- 2.4. Spain
- 2.5. Rest of Europe
-
3. Asia Pacific
- 3.1. India
- 3.2. China
- 3.3. Japan
- 3.4. Rest of Asia Pacific
-
4. Latin America
- 4.1. Brazil
- 4.2. Argentina
- 4.3. Rest of Latin America
-
5. Middle East and Africa
- 5.1. UAE
- 5.2. Saudi Arabia
- 5.3. South Africa
- 5.4. Rest of Middle East and Africa
Managed IoT Services Industry REPORT HIGHLIGHTS
| Aspects | Details |
|---|---|
| Study Period | 2019-2033 |
| Base Year | 2024 |
| Estimated Year | 2025 |
| Forecast Period | 2025-2033 |
| Historical Period | 2019-2024 |
| Growth Rate | CAGR of 27.82% from 2019-2033 |
| Segmentation |
|
Table of Contents
- 1. Introduction
- 1.1. Research Scope
- 1.2. Market Segmentation
- 1.3. Research Methodology
- 1.4. Definitions and Assumptions
- 2. Executive Summary
- 2.1. Introduction
- 3. Market Dynamics
- 3.1. Introduction
- 3.2. Market Drivers
- 3.2.1. Consumer propensity Towards Managed Cloud Services; Growing Adoption of IoT from Industries; Increasing use of IOT in Manufacturing Sector to boost the market
- 3.3. Market Restrains
- 3.3.1. IoT Complexities Combined with Security Concerns
- 3.4. Market Trends
- 3.4.1. Manufacturing Sector to Hold a Significant Market Share
- 4. Market Factor Analysis
- 4.1. Porters Five Forces
- 4.2. Supply/Value Chain
- 4.3. PESTEL analysis
- 4.4. Market Entropy
- 4.5. Patent/Trademark Analysis
- 5. Global Managed IoT Services Industry Analysis, Insights and Forecast, 2019-2031
- 5.1. Market Analysis, Insights and Forecast - by Application
- 5.1.1. Network Management
- 5.1.2. Device Management
- 5.1.3. Data Management
- 5.1.4. Security Management
- 5.1.5. Other Applications
- 5.2. Market Analysis, Insights and Forecast - by End-user
- 5.2.1. Energy and Utilities
- 5.2.2. Manufacturing
- 5.2.3. Retail
- 5.2.4. Healthcare
- 5.2.5. BFSI
- 5.2.6. IT & Telecom
- 5.2.7. Other End-users
- 5.3. Market Analysis, Insights and Forecast - by Region
- 5.3.1. North America
- 5.3.2. Europe
- 5.3.3. Asia Pacific
- 5.3.4. Latin America
- 5.3.5. Middle East and Africa
- 5.1. Market Analysis, Insights and Forecast - by Application
- 6. North America Managed IoT Services Industry Analysis, Insights and Forecast, 2019-2031
- 6.1. Market Analysis, Insights and Forecast - by Application
- 6.1.1. Network Management
- 6.1.2. Device Management
- 6.1.3. Data Management
- 6.1.4. Security Management
- 6.1.5. Other Applications
- 6.2. Market Analysis, Insights and Forecast - by End-user
- 6.2.1. Energy and Utilities
- 6.2.2. Manufacturing
- 6.2.3. Retail
- 6.2.4. Healthcare
- 6.2.5. BFSI
- 6.2.6. IT & Telecom
- 6.2.7. Other End-users
- 6.1. Market Analysis, Insights and Forecast - by Application
- 7. Europe Managed IoT Services Industry Analysis, Insights and Forecast, 2019-2031
- 7.1. Market Analysis, Insights and Forecast - by Application
- 7.1.1. Network Management
- 7.1.2. Device Management
- 7.1.3. Data Management
- 7.1.4. Security Management
- 7.1.5. Other Applications
- 7.2. Market Analysis, Insights and Forecast - by End-user
- 7.2.1. Energy and Utilities
- 7.2.2. Manufacturing
- 7.2.3. Retail
- 7.2.4. Healthcare
- 7.2.5. BFSI
- 7.2.6. IT & Telecom
- 7.2.7. Other End-users
- 7.1. Market Analysis, Insights and Forecast - by Application
- 8. Asia Pacific Managed IoT Services Industry Analysis, Insights and Forecast, 2019-2031
- 8.1. Market Analysis, Insights and Forecast - by Application
- 8.1.1. Network Management
- 8.1.2. Device Management
- 8.1.3. Data Management
- 8.1.4. Security Management
- 8.1.5. Other Applications
- 8.2. Market Analysis, Insights and Forecast - by End-user
- 8.2.1. Energy and Utilities
- 8.2.2. Manufacturing
- 8.2.3. Retail
- 8.2.4. Healthcare
- 8.2.5. BFSI
- 8.2.6. IT & Telecom
- 8.2.7. Other End-users
- 8.1. Market Analysis, Insights and Forecast - by Application
- 9. Latin America Managed IoT Services Industry Analysis, Insights and Forecast, 2019-2031
- 9.1. Market Analysis, Insights and Forecast - by Application
- 9.1.1. Network Management
- 9.1.2. Device Management
- 9.1.3. Data Management
- 9.1.4. Security Management
- 9.1.5. Other Applications
- 9.2. Market Analysis, Insights and Forecast - by End-user
- 9.2.1. Energy and Utilities
- 9.2.2. Manufacturing
- 9.2.3. Retail
- 9.2.4. Healthcare
- 9.2.5. BFSI
- 9.2.6. IT & Telecom
- 9.2.7. Other End-users
- 9.1. Market Analysis, Insights and Forecast - by Application
- 10. Middle East and Africa Managed IoT Services Industry Analysis, Insights and Forecast, 2019-2031
- 10.1. Market Analysis, Insights and Forecast - by Application
- 10.1.1. Network Management
- 10.1.2. Device Management
- 10.1.3. Data Management
- 10.1.4. Security Management
- 10.1.5. Other Applications
- 10.2. Market Analysis, Insights and Forecast - by End-user
- 10.2.1. Energy and Utilities
- 10.2.2. Manufacturing
- 10.2.3. Retail
- 10.2.4. Healthcare
- 10.2.5. BFSI
- 10.2.6. IT & Telecom
- 10.2.7. Other End-users
- 10.1. Market Analysis, Insights and Forecast - by Application
- 11. North America Managed IoT Services Industry Analysis, Insights and Forecast, 2019-2031
- 11.1. Market Analysis, Insights and Forecast - By Country/Sub-region
- 11.1.1 United States
- 11.1.2 Canada
- 11.1.3 Rest of North America
- 12. Europe Managed IoT Services Industry Analysis, Insights and Forecast, 2019-2031
- 12.1. Market Analysis, Insights and Forecast - By Country/Sub-region
- 12.1.1 Germany
- 12.1.2 United Kingdom
- 12.1.3 France
- 12.1.4 Spain
- 12.1.5 Rest of Europe
- 13. Asia Pacific Managed IoT Services Industry Analysis, Insights and Forecast, 2019-2031
- 13.1. Market Analysis, Insights and Forecast - By Country/Sub-region
- 13.1.1 India
- 13.1.2 China
- 13.1.3 Japan
- 13.1.4 Rest of Asia Pacific
- 14. Latin America Managed IoT Services Industry Analysis, Insights and Forecast, 2019-2031
- 14.1. Market Analysis, Insights and Forecast - By Country/Sub-region
- 14.1.1 Brazil
- 14.1.2 Argentina
- 14.1.3 Rest of Latin America
- 15. Middle East and Africa Managed IoT Services Industry Analysis, Insights and Forecast, 2019-2031
- 15.1. Market Analysis, Insights and Forecast - By Country/Sub-region
- 15.1.1 UAE
- 15.1.2 Saudi Arabia
- 15.1.3 South Africa
- 15.1.4 Rest of Middle East and Africa
- 16. Competitive Analysis
- 16.1. Global Market Share Analysis 2024
- 16.2. Company Profiles
- 16.2.1 Aricent Inc *List Not Exhaustive
- 16.2.1.1. Overview
- 16.2.1.2. Products
- 16.2.1.3. SWOT Analysis
- 16.2.1.4. Recent Developments
- 16.2.1.5. Financials (Based on Availability)
- 16.2.2 Wipro Ltd
- 16.2.2.1. Overview
- 16.2.2.2. Products
- 16.2.2.3. SWOT Analysis
- 16.2.2.4. Recent Developments
- 16.2.2.5. Financials (Based on Availability)
- 16.2.3 HCL Technologies Ltd
- 16.2.3.1. Overview
- 16.2.3.2. Products
- 16.2.3.3. SWOT Analysis
- 16.2.3.4. Recent Developments
- 16.2.3.5. Financials (Based on Availability)
- 16.2.4 Cisco Systems Inc
- 16.2.4.1. Overview
- 16.2.4.2. Products
- 16.2.4.3. SWOT Analysis
- 16.2.4.4. Recent Developments
- 16.2.4.5. Financials (Based on Availability)
- 16.2.5 Cognizant Technology Solutions Corp
- 16.2.5.1. Overview
- 16.2.5.2. Products
- 16.2.5.3. SWOT Analysis
- 16.2.5.4. Recent Developments
- 16.2.5.5. Financials (Based on Availability)
- 16.2.6 Virtusa Corporation
- 16.2.6.1. Overview
- 16.2.6.2. Products
- 16.2.6.3. SWOT Analysis
- 16.2.6.4. Recent Developments
- 16.2.6.5. Financials (Based on Availability)
- 16.2.7 Tech Mahindra Ltd
- 16.2.7.1. Overview
- 16.2.7.2. Products
- 16.2.7.3. SWOT Analysis
- 16.2.7.4. Recent Developments
- 16.2.7.5. Financials (Based on Availability)
- 16.2.8 Tata Consultancy Services
- 16.2.8.1. Overview
- 16.2.8.2. Products
- 16.2.8.3. SWOT Analysis
- 16.2.8.4. Recent Developments
- 16.2.8.5. Financials (Based on Availability)
- 16.2.9 Infosys Ltd
- 16.2.9.1. Overview
- 16.2.9.2. Products
- 16.2.9.3. SWOT Analysis
- 16.2.9.4. Recent Developments
- 16.2.9.5. Financials (Based on Availability)
- 16.2.10 Tieto Corporation
- 16.2.10.1. Overview
- 16.2.10.2. Products
- 16.2.10.3. SWOT Analysis
- 16.2.10.4. Recent Developments
- 16.2.10.5. Financials (Based on Availability)
- 16.2.1 Aricent Inc *List Not Exhaustive
List of Figures
- Figure 1: Global Managed IoT Services Industry Revenue Breakdown (Million, %) by Region 2024 & 2032
- Figure 2: North America Managed IoT Services Industry Revenue (Million), by Country 2024 & 2032
- Figure 3: North America Managed IoT Services Industry Revenue Share (%), by Country 2024 & 2032
- Figure 4: Europe Managed IoT Services Industry Revenue (Million), by Country 2024 & 2032
- Figure 5: Europe Managed IoT Services Industry Revenue Share (%), by Country 2024 & 2032
- Figure 6: Asia Pacific Managed IoT Services Industry Revenue (Million), by Country 2024 & 2032
- Figure 7: Asia Pacific Managed IoT Services Industry Revenue Share (%), by Country 2024 & 2032
- Figure 8: Latin America Managed IoT Services Industry Revenue (Million), by Country 2024 & 2032
- Figure 9: Latin America Managed IoT Services Industry Revenue Share (%), by Country 2024 & 2032
- Figure 10: Middle East and Africa Managed IoT Services Industry Revenue (Million), by Country 2024 & 2032
- Figure 11: Middle East and Africa Managed IoT Services Industry Revenue Share (%), by Country 2024 & 2032
- Figure 12: North America Managed IoT Services Industry Revenue (Million), by Application 2024 & 2032
- Figure 13: North America Managed IoT Services Industry Revenue Share (%), by Application 2024 & 2032
- Figure 14: North America Managed IoT Services Industry Revenue (Million), by End-user 2024 & 2032
- Figure 15: North America Managed IoT Services Industry Revenue Share (%), by End-user 2024 & 2032
- Figure 16: North America Managed IoT Services Industry Revenue (Million), by Country 2024 & 2032
- Figure 17: North America Managed IoT Services Industry Revenue Share (%), by Country 2024 & 2032
- Figure 18: Europe Managed IoT Services Industry Revenue (Million), by Application 2024 & 2032
- Figure 19: Europe Managed IoT Services Industry Revenue Share (%), by Application 2024 & 2032
- Figure 20: Europe Managed IoT Services Industry Revenue (Million), by End-user 2024 & 2032
- Figure 21: Europe Managed IoT Services Industry Revenue Share (%), by End-user 2024 & 2032
- Figure 22: Europe Managed IoT Services Industry Revenue (Million), by Country 2024 & 2032
- Figure 23: Europe Managed IoT Services Industry Revenue Share (%), by Country 2024 & 2032
- Figure 24: Asia Pacific Managed IoT Services Industry Revenue (Million), by Application 2024 & 2032
- Figure 25: Asia Pacific Managed IoT Services Industry Revenue Share (%), by Application 2024 & 2032
- Figure 26: Asia Pacific Managed IoT Services Industry Revenue (Million), by End-user 2024 & 2032
- Figure 27: Asia Pacific Managed IoT Services Industry Revenue Share (%), by End-user 2024 & 2032
- Figure 28: Asia Pacific Managed IoT Services Industry Revenue (Million), by Country 2024 & 2032
- Figure 29: Asia Pacific Managed IoT Services Industry Revenue Share (%), by Country 2024 & 2032
- Figure 30: Latin America Managed IoT Services Industry Revenue (Million), by Application 2024 & 2032
- Figure 31: Latin America Managed IoT Services Industry Revenue Share (%), by Application 2024 & 2032
- Figure 32: Latin America Managed IoT Services Industry Revenue (Million), by End-user 2024 & 2032
- Figure 33: Latin America Managed IoT Services Industry Revenue Share (%), by End-user 2024 & 2032
- Figure 34: Latin America Managed IoT Services Industry Revenue (Million), by Country 2024 & 2032
- Figure 35: Latin America Managed IoT Services Industry Revenue Share (%), by Country 2024 & 2032
- Figure 36: Middle East and Africa Managed IoT Services Industry Revenue (Million), by Application 2024 & 2032
- Figure 37: Middle East and Africa Managed IoT Services Industry Revenue Share (%), by Application 2024 & 2032
- Figure 38: Middle East and Africa Managed IoT Services Industry Revenue (Million), by End-user 2024 & 2032
- Figure 39: Middle East and Africa Managed IoT Services Industry Revenue Share (%), by End-user 2024 & 2032
- Figure 40: Middle East and Africa Managed IoT Services Industry Revenue (Million), by Country 2024 & 2032
- Figure 41: Middle East and Africa Managed IoT Services Industry Revenue Share (%), by Country 2024 & 2032
List of Tables
- Table 1: Global Managed IoT Services Industry Revenue Million Forecast, by Region 2019 & 2032
- Table 2: Global Managed IoT Services Industry Revenue Million Forecast, by Application 2019 & 2032
- Table 3: Global Managed IoT Services Industry Revenue Million Forecast, by End-user 2019 & 2032
- Table 4: Global Managed IoT Services Industry Revenue Million Forecast, by Region 2019 & 2032
- Table 5: Global Managed IoT Services Industry Revenue Million Forecast, by Country 2019 & 2032
- Table 6: United States Managed IoT Services Industry Revenue (Million) Forecast, by Application 2019 & 2032
- Table 7: Canada Managed IoT Services Industry Revenue (Million) Forecast, by Application 2019 & 2032
- Table 8: Rest of North America Managed IoT Services Industry Revenue (Million) Forecast, by Application 2019 & 2032
- Table 9: Global Managed IoT Services Industry Revenue Million Forecast, by Country 2019 & 2032
- Table 10: Germany Managed IoT Services Industry Revenue (Million) Forecast, by Application 2019 & 2032
- Table 11: United Kingdom Managed IoT Services Industry Revenue (Million) Forecast, by Application 2019 & 2032
- Table 12: France Managed IoT Services Industry Revenue (Million) Forecast, by Application 2019 & 2032
- Table 13: Spain Managed IoT Services Industry Revenue (Million) Forecast, by Application 2019 & 2032
- Table 14: Rest of Europe Managed IoT Services Industry Revenue (Million) Forecast, by Application 2019 & 2032
- Table 15: Global Managed IoT Services Industry Revenue Million Forecast, by Country 2019 & 2032
- Table 16: India Managed IoT Services Industry Revenue (Million) Forecast, by Application 2019 & 2032
- Table 17: China Managed IoT Services Industry Revenue (Million) Forecast, by Application 2019 & 2032
- Table 18: Japan Managed IoT Services Industry Revenue (Million) Forecast, by Application 2019 & 2032
- Table 19: Rest of Asia Pacific Managed IoT Services Industry Revenue (Million) Forecast, by Application 2019 & 2032
- Table 20: Global Managed IoT Services Industry Revenue Million Forecast, by Country 2019 & 2032
- Table 21: Brazil Managed IoT Services Industry Revenue (Million) Forecast, by Application 2019 & 2032
- Table 22: Argentina Managed IoT Services Industry Revenue (Million) Forecast, by Application 2019 & 2032
- Table 23: Rest of Latin America Managed IoT Services Industry Revenue (Million) Forecast, by Application 2019 & 2032
- Table 24: Global Managed IoT Services Industry Revenue Million Forecast, by Country 2019 & 2032
- Table 25: UAE Managed IoT Services Industry Revenue (Million) Forecast, by Application 2019 & 2032
- Table 26: Saudi Arabia Managed IoT Services Industry Revenue (Million) Forecast, by Application 2019 & 2032
- Table 27: South Africa Managed IoT Services Industry Revenue (Million) Forecast, by Application 2019 & 2032
- Table 28: Rest of Middle East and Africa Managed IoT Services Industry Revenue (Million) Forecast, by Application 2019 & 2032
- Table 29: Global Managed IoT Services Industry Revenue Million Forecast, by Application 2019 & 2032
- Table 30: Global Managed IoT Services Industry Revenue Million Forecast, by End-user 2019 & 2032
- Table 31: Global Managed IoT Services Industry Revenue Million Forecast, by Country 2019 & 2032
- Table 32: United States Managed IoT Services Industry Revenue (Million) Forecast, by Application 2019 & 2032
- Table 33: Canada Managed IoT Services Industry Revenue (Million) Forecast, by Application 2019 & 2032
- Table 34: Rest of North America Managed IoT Services Industry Revenue (Million) Forecast, by Application 2019 & 2032
- Table 35: Global Managed IoT Services Industry Revenue Million Forecast, by Application 2019 & 2032
- Table 36: Global Managed IoT Services Industry Revenue Million Forecast, by End-user 2019 & 2032
- Table 37: Global Managed IoT Services Industry Revenue Million Forecast, by Country 2019 & 2032
- Table 38: Germany Managed IoT Services Industry Revenue (Million) Forecast, by Application 2019 & 2032
- Table 39: United Kingdom Managed IoT Services Industry Revenue (Million) Forecast, by Application 2019 & 2032
- Table 40: France Managed IoT Services Industry Revenue (Million) Forecast, by Application 2019 & 2032
- Table 41: Spain Managed IoT Services Industry Revenue (Million) Forecast, by Application 2019 & 2032
- Table 42: Rest of Europe Managed IoT Services Industry Revenue (Million) Forecast, by Application 2019 & 2032
- Table 43: Global Managed IoT Services Industry Revenue Million Forecast, by Application 2019 & 2032
- Table 44: Global Managed IoT Services Industry Revenue Million Forecast, by End-user 2019 & 2032
- Table 45: Global Managed IoT Services Industry Revenue Million Forecast, by Country 2019 & 2032
- Table 46: India Managed IoT Services Industry Revenue (Million) Forecast, by Application 2019 & 2032
- Table 47: China Managed IoT Services Industry Revenue (Million) Forecast, by Application 2019 & 2032
- Table 48: Japan Managed IoT Services Industry Revenue (Million) Forecast, by Application 2019 & 2032
- Table 49: Rest of Asia Pacific Managed IoT Services Industry Revenue (Million) Forecast, by Application 2019 & 2032
- Table 50: Global Managed IoT Services Industry Revenue Million Forecast, by Application 2019 & 2032
- Table 51: Global Managed IoT Services Industry Revenue Million Forecast, by End-user 2019 & 2032
- Table 52: Global Managed IoT Services Industry Revenue Million Forecast, by Country 2019 & 2032
- Table 53: Brazil Managed IoT Services Industry Revenue (Million) Forecast, by Application 2019 & 2032
- Table 54: Argentina Managed IoT Services Industry Revenue (Million) Forecast, by Application 2019 & 2032
- Table 55: Rest of Latin America Managed IoT Services Industry Revenue (Million) Forecast, by Application 2019 & 2032
- Table 56: Global Managed IoT Services Industry Revenue Million Forecast, by Application 2019 & 2032
- Table 57: Global Managed IoT Services Industry Revenue Million Forecast, by End-user 2019 & 2032
- Table 58: Global Managed IoT Services Industry Revenue Million Forecast, by Country 2019 & 2032
- Table 59: UAE Managed IoT Services Industry Revenue (Million) Forecast, by Application 2019 & 2032
- Table 60: Saudi Arabia Managed IoT Services Industry Revenue (Million) Forecast, by Application 2019 & 2032
- Table 61: South Africa Managed IoT Services Industry Revenue (Million) Forecast, by Application 2019 & 2032
- Table 62: Rest of Middle East and Africa Managed IoT Services Industry Revenue (Million) Forecast, by Application 2019 & 2032
Frequently Asked Questions
1. What is the projected Compound Annual Growth Rate (CAGR) of the Managed IoT Services Industry?
The projected CAGR is approximately 27.82%.
2. Which companies are prominent players in the Managed IoT Services Industry?
Key companies in the market include Aricent Inc *List Not Exhaustive, Wipro Ltd, HCL Technologies Ltd, Cisco Systems Inc, Cognizant Technology Solutions Corp, Virtusa Corporation, Tech Mahindra Ltd, Tata Consultancy Services, Infosys Ltd, Tieto Corporation.
3. What are the main segments of the Managed IoT Services Industry?
The market segments include Application, End-user.
4. Can you provide details about the market size?
The market size is estimated to be USD XX Million as of 2022.
5. What are some drivers contributing to market growth?
Consumer propensity Towards Managed Cloud Services; Growing Adoption of IoT from Industries; Increasing use of IOT in Manufacturing Sector to boost the market.
6. What are the notable trends driving market growth?
Manufacturing Sector to Hold a Significant Market Share.
7. Are there any restraints impacting market growth?
IoT Complexities Combined with Security Concerns.
8. Can you provide examples of recent developments in the market?
December 2022: KORE, a global provider of Internet of Things (IoT) solutions and global IoT connectivity-as-a-service (IoT CaaS), recently announced the formation of a go-to-market partnership with Google Cloud to enable IoT functionality for organizations worldwide. With the support of KORE's IoT Solutions and Google Cloud infrastructure and capabilities, businesses could develop effective IoT solutions.
9. What pricing options are available for accessing the report?
Pricing options include single-user, multi-user, and enterprise licenses priced at USD 4750, USD 5250, and USD 8750 respectively.
10. Is the market size provided in terms of value or volume?
The market size is provided in terms of value, measured in Million.
11. Are there any specific market keywords associated with the report?
Yes, the market keyword associated with the report is "Managed IoT Services Industry," which aids in identifying and referencing the specific market segment covered.
12. How do I determine which pricing option suits my needs best?
The pricing options vary based on user requirements and access needs. Individual users may opt for single-user licenses, while businesses requiring broader access may choose multi-user or enterprise licenses for cost-effective access to the report.
13. Are there any additional resources or data provided in the Managed IoT Services Industry report?
While the report offers comprehensive insights, it's advisable to review the specific contents or supplementary materials provided to ascertain if additional resources or data are available.
14. How can I stay updated on further developments or reports in the Managed IoT Services Industry?
To stay informed about further developments, trends, and reports in the Managed IoT Services Industry, consider subscribing to industry newsletters, following relevant companies and organizations, or regularly checking reputable industry news sources and publications.
Methodology
Step 1 - Identification of Relevant Samples Size from Population Database


Step 2 - Approaches for Defining Global Market Size (Value, Volume* & Price*)

Note*: In applicable scenarios
Step 3 - Data Sources
Primary Research
- Web Analytics
- Survey Reports
- Research Institute
- Latest Research Reports
- Opinion Leaders
Secondary Research
- Annual Reports
- White Paper
- Latest Press Release
- Industry Association
- Paid Database
- Investor Presentations

Step 4 - Data Triangulation
Involves using different sources of information in order to increase the validity of a study
These sources are likely to be stakeholders in a program - participants, other researchers, program staff, other community members, and so on.
Then we put all data in single framework & apply various statistical tools to find out the dynamic on the market.
During the analysis stage, feedback from the stakeholder groups would be compared to determine areas of agreement as well as areas of divergence


