
Key Insights
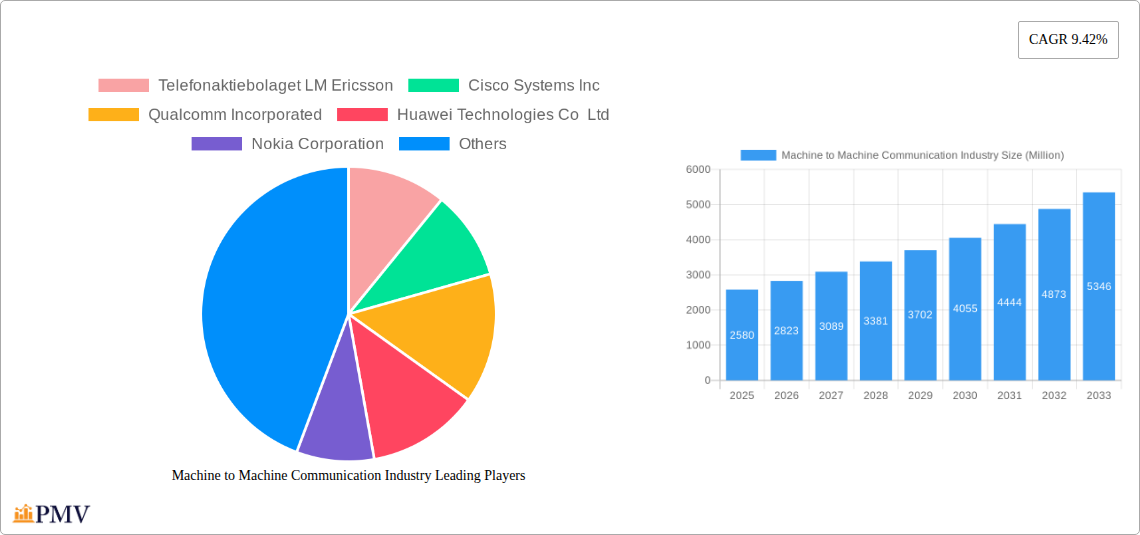
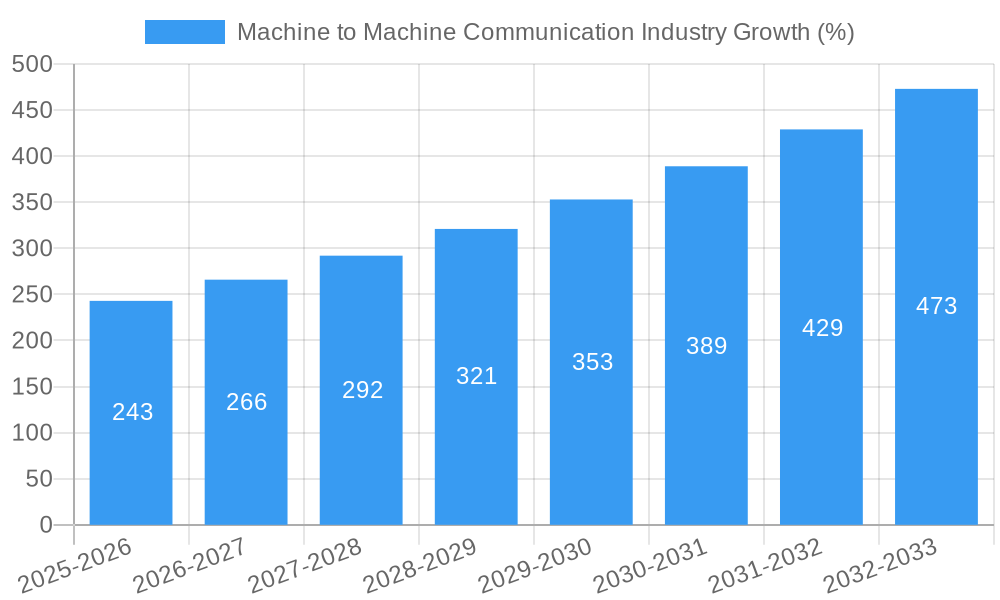
The Machine-to-Machine (M2M) communication market is experiencing robust growth, projected to reach a substantial size driven by the increasing adoption of IoT devices across diverse sectors. With a current market size of $2.58 billion in 2025 and a Compound Annual Growth Rate (CAGR) of 9.42%, the market is expected to witness significant expansion through 2033. Key drivers include the rising demand for automation, remote monitoring, and improved operational efficiency across industries such as healthcare, transportation and logistics, and utilities. The proliferation of smart devices, enhanced connectivity solutions (like 5G), and the decreasing cost of M2M modules are further fueling market expansion. Growth is segmented across wired and wireless communication channels, with wireless communication experiencing faster adoption due to its flexibility and scalability. While data security concerns and initial investment costs represent restraints, the long-term benefits of improved operational efficiency and data-driven decision-making are overcoming these challenges. Geographic growth is expected to be diverse, with North America and Europe currently holding significant market shares, but Asia-Pacific exhibiting the highest growth potential due to rapid industrialization and rising IoT adoption.
The competitive landscape is characterized by a mix of established technology giants and specialized M2M solution providers. Companies such as Ericsson, Cisco, Qualcomm, Huawei, Nokia, and Intel are actively investing in developing advanced M2M technologies and expanding their market presence. The competitive intensity is expected to increase as more players enter the market, driving innovation and price competition. Future market evolution will be shaped by advancements in artificial intelligence (AI), edge computing, and the expansion of 5G and beyond networks, further enhancing the capabilities and applications of M2M communication across various industries. This will lead to new opportunities in predictive maintenance, real-time data analytics, and automated decision-making, solidifying the M2M market's crucial role in the broader digital transformation landscape.
Machine to Machine Communication (M2M) Industry Market Report: 2019-2033
This comprehensive report provides a detailed analysis of the global Machine to Machine Communication (M2M) industry, offering invaluable insights for businesses, investors, and stakeholders. With a study period spanning 2019-2033, a base year of 2025, and a forecast period of 2025-2033, this report offers a complete overview of the current market landscape and future growth potential. The market is projected to reach xx Million by 2033, exhibiting a significant CAGR of xx% during the forecast period.
Machine to Machine Communication Industry Market Structure & Competitive Dynamics
The M2M communication market is characterized by a moderately concentrated structure with several key players holding significant market share. The industry's competitive landscape is dynamic, shaped by ongoing innovation, strategic partnerships, and mergers and acquisitions (M&A) activities. Key players such as Telefonaktiebolaget LM Ericsson, Cisco Systems Inc, Qualcomm Incorporated, Huawei Technologies Co Ltd, Nokia Corporation, and Intel Corporation constantly strive to enhance their product portfolios and expand their market reach. The regulatory landscape plays a crucial role, influencing deployment strategies and security standards. Product substitution, primarily through the adoption of newer communication technologies like 5G and NB-IoT, significantly impacts market dynamics. End-user trends, particularly the increasing adoption of IoT solutions across various sectors, are a key growth driver. The historical period (2019-2024) witnessed several notable M&A deals, totaling an estimated value of xx Million, primarily focused on enhancing technological capabilities and expanding geographical reach. Market share for the leading players in 2025 is estimated as follows: Ericsson (xx%), Cisco (xx%), Qualcomm (xx%), Huawei (xx%), Nokia (xx%). Further consolidation is expected during the forecast period.
Machine to Machine Communication Industry Industry Trends & Insights
The M2M communication market is experiencing exponential growth, driven by several key factors. The increasing adoption of IoT devices across various sectors, including healthcare, transportation, and energy, is a primary driver. Technological advancements, particularly in 5G and low-power wide-area networks (LPWAN), are enabling improved connectivity, enhanced data security, and lower operational costs. Consumer preferences for smart and connected devices are fueling demand for robust and reliable M2M solutions. The market is also witnessing increased investment in R&D, driving innovation in areas like edge computing and AI-powered analytics. Competitive dynamics remain intense, with companies constantly innovating to offer superior performance, reliability, and cost-effectiveness. The market's compound annual growth rate (CAGR) during the historical period (2019-2024) was xx%, and market penetration in key segments like smart metering and industrial automation has significantly increased. These trends are expected to continue during the forecast period, leading to further growth and market expansion.
Dominant Markets & Segments in Machine to Machine Communication Industry
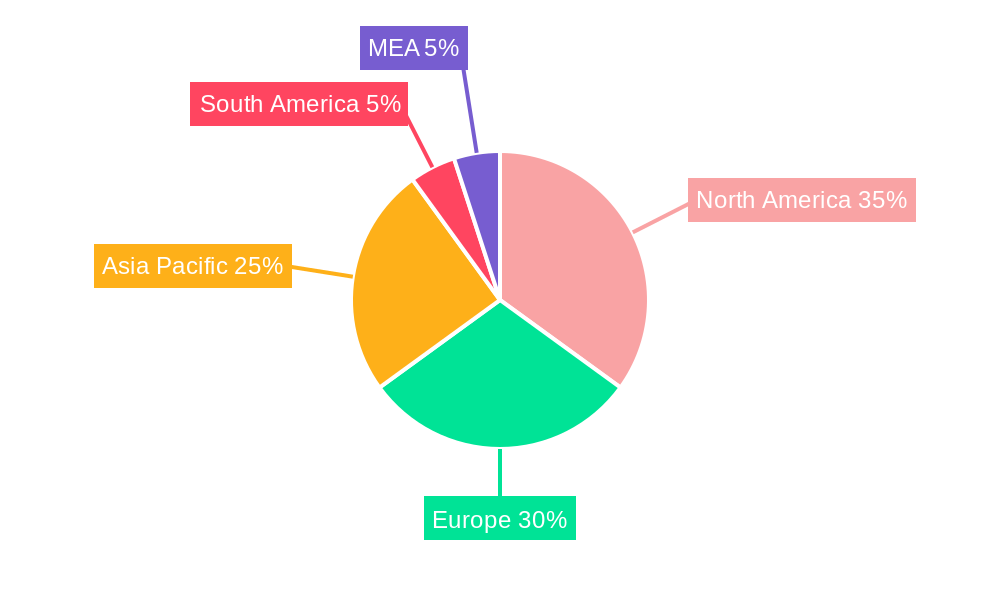
The global M2M communication market is geographically diverse, with significant growth observed across various regions. While specific regional dominance fluctuates based on infrastructure development and economic conditions, the Asia-Pacific region is currently a dominant market due to rapid industrialization and IoT adoption, particularly in countries like China and India. Europe and North America also hold significant market share due to robust infrastructure and high technological adoption rates.
By Communication Channel Type:
- Wireless: Wireless communication dominates the market due to its flexibility, cost-effectiveness, and wide-area coverage, especially with the increasing adoption of 5G and LPWAN technologies. Growth is driven by the ease of deployment and scalability.
- Wired: Wired communication retains a niche segment primarily in applications requiring high bandwidth and stringent security protocols. Growth in this segment is moderate compared to wireless.
By End-user Industry:
- Transportation & Logistics: This segment exhibits strong growth due to the increasing demand for real-time tracking, fleet management, and intelligent transportation systems.
- Utilities: The utility sector is a key adopter of M2M technology for smart grid management, infrastructure monitoring, and improved service efficiency.
- Healthcare: Growth in this segment is driven by the demand for remote patient monitoring, connected medical devices, and improved healthcare infrastructure. Security and reliability are critical factors.
- Energy: The energy sector leverages M2M solutions for predictive maintenance, efficient resource allocation, and optimized energy distribution.
- Other End-users (Agriculture, Industrial): This segment experiences significant growth driven by precision agriculture, industrial automation, and increased efficiency demands.
Machine to Machine Communication Industry Product Innovations
Recent product innovations focus on enhancing the security, reliability, and efficiency of M2M communication networks. The integration of AI and machine learning is transforming data analytics, enabling predictive maintenance and optimized resource allocation. 5G-enabled solutions are emerging as a key driver, offering increased bandwidth and improved latency. New LPWAN technologies are expanding the reach of M2M solutions to remote areas, driving adoption in sectors like agriculture and industrial automation. The focus is on developing cost-effective, secure, and easily deployable solutions that meet the diverse needs of various end-user industries.
Report Segmentation & Scope
This report segments the M2M communication market by communication channel type (wired and wireless) and end-user industry (Healthcare, Transportation & Logistics, Utilities, Energy, and Other End-users, including Agriculture and Industrial). Each segment’s growth projections are detailed, considering various factors including market size, competitive dynamics, and technological advancements. The report also analyzes the market size and growth potential of each segment for the forecast period (2025-2033), offering a comprehensive understanding of the market structure and future trends.
Key Drivers of Machine to Machine Communication Industry Growth
Several factors are driving the growth of the M2M communication industry. Technological advancements in 5G, LPWAN, and edge computing are enabling faster, more reliable, and secure communication. The increasing adoption of IoT devices across various sectors is creating substantial demand for M2M solutions. Government initiatives promoting smart city development and digital transformation are creating favorable regulatory environments. Falling hardware costs and improved energy efficiency are making M2M technologies more affordable and accessible. Finally, the growing need for real-time data analytics and predictive maintenance is fueling demand for M2M solutions.
Challenges in the Machine to Machine Communication Industry Sector
Despite the significant growth potential, the M2M communication industry faces several challenges. Data security and privacy concerns are paramount, especially with the increasing reliance on cloud-based solutions. Regulatory hurdles and interoperability issues can hinder seamless integration and deployment. Supply chain disruptions can impact the availability of key components. Furthermore, intense competition among established players and new entrants can put pressure on pricing and profitability. The cost of implementing and maintaining M2M infrastructure can also limit adoption in certain sectors. These challenges need to be addressed to fully realize the industry's growth potential.
Leading Players in the Machine to Machine Communication Industry Market
- Telefonaktiebolaget LM Ericsson
- Cisco Systems Inc
- Qualcomm Incorporated
- Huawei Technologies Co Ltd
- Nokia Corporation
- Telecom Italia
- Intel Corporation
- Panasonic Corporation
Key Developments in Machine to Machine Communication Industry Sector
- November 2023: Salesforce and AWS expand their partnership, facilitating the creation of trusted AI applications and intelligent CRM experiences. This development is expected to drive further adoption of cloud-based M2M solutions.
- October 2023: X4000 Communications partners with Cisco Systems, becoming a Select Advisory Partner focused on 5G networks for Industry 4.0 in Australia. This strengthens the 5G ecosystem and accelerates the deployment of M2M solutions in the industrial sector.
Strategic Machine to Machine Communication Industry Market Outlook
The future of the M2M communication industry looks promising, driven by continued technological advancements, increasing IoT adoption, and favorable regulatory environments. Significant growth opportunities exist in emerging markets and untapped sectors. Strategic partnerships and collaborations are likely to play a vital role in shaping the industry landscape. Companies that successfully navigate the challenges related to data security, interoperability, and cost-effectiveness are well-positioned to capitalize on the vast growth potential. The integration of AI and machine learning will continue to transform data analytics and drive innovation. The market is projected to experience strong growth in the coming years, exceeding xx Million by 2033.
Machine to Machine Communication Industry Segmentation
-
1. Communication Channel Type
- 1.1. Wired
- 1.2. Wireless
-
2. End-user Industry
- 2.1. Healthcare
- 2.2. Transporation & Logistics
- 2.3. Utilities
- 2.4. Energy
- 2.5. Other End-users (Agriculture, Industrial)
Machine to Machine Communication Industry Segmentation By Geography
- 1. North America
- 2. Europe
- 3. Asia Pacific
- 4. Rest of the World
Machine to Machine Communication Industry REPORT HIGHLIGHTS
| Aspects | Details |
|---|---|
| Study Period | 2019-2033 |
| Base Year | 2024 |
| Estimated Year | 2025 |
| Forecast Period | 2025-2033 |
| Historical Period | 2019-2024 |
| Growth Rate | CAGR of 9.42% from 2019-2033 |
| Segmentation |
|
Table of Contents
- 1. Introduction
- 1.1. Research Scope
- 1.2. Market Segmentation
- 1.3. Research Methodology
- 1.4. Definitions and Assumptions
- 2. Executive Summary
- 2.1. Introduction
- 3. Market Dynamics
- 3.1. Introduction
- 3.2. Market Drivers
- 3.2.1. Augmented Demand for A Better Connectivity Experience; Necessity for Fast Internet Connectivity; Requirement of 5G in IoT
- 3.3. Market Restrains
- 3.3.1. Technology Limitations to Support Constant High-Speed Connections; Large Investment Involved in Developing 5G Infrastructure
- 3.4. Market Trends
- 3.4.1. Energy Holds a Dominant Position in the Massive Machine Type Communication Market
- 4. Market Factor Analysis
- 4.1. Porters Five Forces
- 4.2. Supply/Value Chain
- 4.3. PESTEL analysis
- 4.4. Market Entropy
- 4.5. Patent/Trademark Analysis
- 5. Global Machine to Machine Communication Industry Analysis, Insights and Forecast, 2019-2031
- 5.1. Market Analysis, Insights and Forecast - by Communication Channel Type
- 5.1.1. Wired
- 5.1.2. Wireless
- 5.2. Market Analysis, Insights and Forecast - by End-user Industry
- 5.2.1. Healthcare
- 5.2.2. Transporation & Logistics
- 5.2.3. Utilities
- 5.2.4. Energy
- 5.2.5. Other End-users (Agriculture, Industrial)
- 5.3. Market Analysis, Insights and Forecast - by Region
- 5.3.1. North America
- 5.3.2. Europe
- 5.3.3. Asia Pacific
- 5.3.4. Rest of the World
- 5.1. Market Analysis, Insights and Forecast - by Communication Channel Type
- 6. North America Machine to Machine Communication Industry Analysis, Insights and Forecast, 2019-2031
- 6.1. Market Analysis, Insights and Forecast - by Communication Channel Type
- 6.1.1. Wired
- 6.1.2. Wireless
- 6.2. Market Analysis, Insights and Forecast - by End-user Industry
- 6.2.1. Healthcare
- 6.2.2. Transporation & Logistics
- 6.2.3. Utilities
- 6.2.4. Energy
- 6.2.5. Other End-users (Agriculture, Industrial)
- 6.1. Market Analysis, Insights and Forecast - by Communication Channel Type
- 7. Europe Machine to Machine Communication Industry Analysis, Insights and Forecast, 2019-2031
- 7.1. Market Analysis, Insights and Forecast - by Communication Channel Type
- 7.1.1. Wired
- 7.1.2. Wireless
- 7.2. Market Analysis, Insights and Forecast - by End-user Industry
- 7.2.1. Healthcare
- 7.2.2. Transporation & Logistics
- 7.2.3. Utilities
- 7.2.4. Energy
- 7.2.5. Other End-users (Agriculture, Industrial)
- 7.1. Market Analysis, Insights and Forecast - by Communication Channel Type
- 8. Asia Pacific Machine to Machine Communication Industry Analysis, Insights and Forecast, 2019-2031
- 8.1. Market Analysis, Insights and Forecast - by Communication Channel Type
- 8.1.1. Wired
- 8.1.2. Wireless
- 8.2. Market Analysis, Insights and Forecast - by End-user Industry
- 8.2.1. Healthcare
- 8.2.2. Transporation & Logistics
- 8.2.3. Utilities
- 8.2.4. Energy
- 8.2.5. Other End-users (Agriculture, Industrial)
- 8.1. Market Analysis, Insights and Forecast - by Communication Channel Type
- 9. Rest of the World Machine to Machine Communication Industry Analysis, Insights and Forecast, 2019-2031
- 9.1. Market Analysis, Insights and Forecast - by Communication Channel Type
- 9.1.1. Wired
- 9.1.2. Wireless
- 9.2. Market Analysis, Insights and Forecast - by End-user Industry
- 9.2.1. Healthcare
- 9.2.2. Transporation & Logistics
- 9.2.3. Utilities
- 9.2.4. Energy
- 9.2.5. Other End-users (Agriculture, Industrial)
- 9.1. Market Analysis, Insights and Forecast - by Communication Channel Type
- 10. North America Machine to Machine Communication Industry Analysis, Insights and Forecast, 2019-2031
- 10.1. Market Analysis, Insights and Forecast - By Country/Sub-region
- 10.1.1 United States
- 10.1.2 Canada
- 10.1.3 Mexico
- 11. Europe Machine to Machine Communication Industry Analysis, Insights and Forecast, 2019-2031
- 11.1. Market Analysis, Insights and Forecast - By Country/Sub-region
- 11.1.1 Germany
- 11.1.2 United Kingdom
- 11.1.3 France
- 11.1.4 Spain
- 11.1.5 Italy
- 11.1.6 Spain
- 11.1.7 Belgium
- 11.1.8 Netherland
- 11.1.9 Nordics
- 11.1.10 Rest of Europe
- 12. Asia Pacific Machine to Machine Communication Industry Analysis, Insights and Forecast, 2019-2031
- 12.1. Market Analysis, Insights and Forecast - By Country/Sub-region
- 12.1.1 China
- 12.1.2 Japan
- 12.1.3 India
- 12.1.4 South Korea
- 12.1.5 Southeast Asia
- 12.1.6 Australia
- 12.1.7 Indonesia
- 12.1.8 Phillipes
- 12.1.9 Singapore
- 12.1.10 Thailandc
- 12.1.11 Rest of Asia Pacific
- 13. South America Machine to Machine Communication Industry Analysis, Insights and Forecast, 2019-2031
- 13.1. Market Analysis, Insights and Forecast - By Country/Sub-region
- 13.1.1 Brazil
- 13.1.2 Argentina
- 13.1.3 Peru
- 13.1.4 Chile
- 13.1.5 Colombia
- 13.1.6 Ecuador
- 13.1.7 Venezuela
- 13.1.8 Rest of South America
- 14. North America Machine to Machine Communication Industry Analysis, Insights and Forecast, 2019-2031
- 14.1. Market Analysis, Insights and Forecast - By Country/Sub-region
- 14.1.1 United States
- 14.1.2 Canada
- 14.1.3 Mexico
- 15. MEA Machine to Machine Communication Industry Analysis, Insights and Forecast, 2019-2031
- 15.1. Market Analysis, Insights and Forecast - By Country/Sub-region
- 15.1.1 United Arab Emirates
- 15.1.2 Saudi Arabia
- 15.1.3 South Africa
- 15.1.4 Rest of Middle East and Africa
- 16. Competitive Analysis
- 16.1. Global Market Share Analysis 2024
- 16.2. Company Profiles
- 16.2.1 Telefonaktiebolaget LM Ericsson
- 16.2.1.1. Overview
- 16.2.1.2. Products
- 16.2.1.3. SWOT Analysis
- 16.2.1.4. Recent Developments
- 16.2.1.5. Financials (Based on Availability)
- 16.2.2 Cisco Systems Inc
- 16.2.2.1. Overview
- 16.2.2.2. Products
- 16.2.2.3. SWOT Analysis
- 16.2.2.4. Recent Developments
- 16.2.2.5. Financials (Based on Availability)
- 16.2.3 Qualcomm Incorporated
- 16.2.3.1. Overview
- 16.2.3.2. Products
- 16.2.3.3. SWOT Analysis
- 16.2.3.4. Recent Developments
- 16.2.3.5. Financials (Based on Availability)
- 16.2.4 Huawei Technologies Co Ltd
- 16.2.4.1. Overview
- 16.2.4.2. Products
- 16.2.4.3. SWOT Analysis
- 16.2.4.4. Recent Developments
- 16.2.4.5. Financials (Based on Availability)
- 16.2.5 Nokia Corporation
- 16.2.5.1. Overview
- 16.2.5.2. Products
- 16.2.5.3. SWOT Analysis
- 16.2.5.4. Recent Developments
- 16.2.5.5. Financials (Based on Availability)
- 16.2.6 Telecom Italia*List Not Exhaustive
- 16.2.6.1. Overview
- 16.2.6.2. Products
- 16.2.6.3. SWOT Analysis
- 16.2.6.4. Recent Developments
- 16.2.6.5. Financials (Based on Availability)
- 16.2.7 Intel Corporation
- 16.2.7.1. Overview
- 16.2.7.2. Products
- 16.2.7.3. SWOT Analysis
- 16.2.7.4. Recent Developments
- 16.2.7.5. Financials (Based on Availability)
- 16.2.8 Panasonic Corporation
- 16.2.8.1. Overview
- 16.2.8.2. Products
- 16.2.8.3. SWOT Analysis
- 16.2.8.4. Recent Developments
- 16.2.8.5. Financials (Based on Availability)
- 16.2.1 Telefonaktiebolaget LM Ericsson
List of Figures
- Figure 1: Global Machine to Machine Communication Industry Revenue Breakdown (Million, %) by Region 2024 & 2032
- Figure 2: North America Machine to Machine Communication Industry Revenue (Million), by Country 2024 & 2032
- Figure 3: North America Machine to Machine Communication Industry Revenue Share (%), by Country 2024 & 2032
- Figure 4: Europe Machine to Machine Communication Industry Revenue (Million), by Country 2024 & 2032
- Figure 5: Europe Machine to Machine Communication Industry Revenue Share (%), by Country 2024 & 2032
- Figure 6: Asia Pacific Machine to Machine Communication Industry Revenue (Million), by Country 2024 & 2032
- Figure 7: Asia Pacific Machine to Machine Communication Industry Revenue Share (%), by Country 2024 & 2032
- Figure 8: South America Machine to Machine Communication Industry Revenue (Million), by Country 2024 & 2032
- Figure 9: South America Machine to Machine Communication Industry Revenue Share (%), by Country 2024 & 2032
- Figure 10: North America Machine to Machine Communication Industry Revenue (Million), by Country 2024 & 2032
- Figure 11: North America Machine to Machine Communication Industry Revenue Share (%), by Country 2024 & 2032
- Figure 12: MEA Machine to Machine Communication Industry Revenue (Million), by Country 2024 & 2032
- Figure 13: MEA Machine to Machine Communication Industry Revenue Share (%), by Country 2024 & 2032
- Figure 14: North America Machine to Machine Communication Industry Revenue (Million), by Communication Channel Type 2024 & 2032
- Figure 15: North America Machine to Machine Communication Industry Revenue Share (%), by Communication Channel Type 2024 & 2032
- Figure 16: North America Machine to Machine Communication Industry Revenue (Million), by End-user Industry 2024 & 2032
- Figure 17: North America Machine to Machine Communication Industry Revenue Share (%), by End-user Industry 2024 & 2032
- Figure 18: North America Machine to Machine Communication Industry Revenue (Million), by Country 2024 & 2032
- Figure 19: North America Machine to Machine Communication Industry Revenue Share (%), by Country 2024 & 2032
- Figure 20: Europe Machine to Machine Communication Industry Revenue (Million), by Communication Channel Type 2024 & 2032
- Figure 21: Europe Machine to Machine Communication Industry Revenue Share (%), by Communication Channel Type 2024 & 2032
- Figure 22: Europe Machine to Machine Communication Industry Revenue (Million), by End-user Industry 2024 & 2032
- Figure 23: Europe Machine to Machine Communication Industry Revenue Share (%), by End-user Industry 2024 & 2032
- Figure 24: Europe Machine to Machine Communication Industry Revenue (Million), by Country 2024 & 2032
- Figure 25: Europe Machine to Machine Communication Industry Revenue Share (%), by Country 2024 & 2032
- Figure 26: Asia Pacific Machine to Machine Communication Industry Revenue (Million), by Communication Channel Type 2024 & 2032
- Figure 27: Asia Pacific Machine to Machine Communication Industry Revenue Share (%), by Communication Channel Type 2024 & 2032
- Figure 28: Asia Pacific Machine to Machine Communication Industry Revenue (Million), by End-user Industry 2024 & 2032
- Figure 29: Asia Pacific Machine to Machine Communication Industry Revenue Share (%), by End-user Industry 2024 & 2032
- Figure 30: Asia Pacific Machine to Machine Communication Industry Revenue (Million), by Country 2024 & 2032
- Figure 31: Asia Pacific Machine to Machine Communication Industry Revenue Share (%), by Country 2024 & 2032
- Figure 32: Rest of the World Machine to Machine Communication Industry Revenue (Million), by Communication Channel Type 2024 & 2032
- Figure 33: Rest of the World Machine to Machine Communication Industry Revenue Share (%), by Communication Channel Type 2024 & 2032
- Figure 34: Rest of the World Machine to Machine Communication Industry Revenue (Million), by End-user Industry 2024 & 2032
- Figure 35: Rest of the World Machine to Machine Communication Industry Revenue Share (%), by End-user Industry 2024 & 2032
- Figure 36: Rest of the World Machine to Machine Communication Industry Revenue (Million), by Country 2024 & 2032
- Figure 37: Rest of the World Machine to Machine Communication Industry Revenue Share (%), by Country 2024 & 2032
List of Tables
- Table 1: Global Machine to Machine Communication Industry Revenue Million Forecast, by Region 2019 & 2032
- Table 2: Global Machine to Machine Communication Industry Revenue Million Forecast, by Communication Channel Type 2019 & 2032
- Table 3: Global Machine to Machine Communication Industry Revenue Million Forecast, by End-user Industry 2019 & 2032
- Table 4: Global Machine to Machine Communication Industry Revenue Million Forecast, by Region 2019 & 2032
- Table 5: Global Machine to Machine Communication Industry Revenue Million Forecast, by Country 2019 & 2032
- Table 6: United States Machine to Machine Communication Industry Revenue (Million) Forecast, by Application 2019 & 2032
- Table 7: Canada Machine to Machine Communication Industry Revenue (Million) Forecast, by Application 2019 & 2032
- Table 8: Mexico Machine to Machine Communication Industry Revenue (Million) Forecast, by Application 2019 & 2032
- Table 9: Global Machine to Machine Communication Industry Revenue Million Forecast, by Country 2019 & 2032
- Table 10: Germany Machine to Machine Communication Industry Revenue (Million) Forecast, by Application 2019 & 2032
- Table 11: United Kingdom Machine to Machine Communication Industry Revenue (Million) Forecast, by Application 2019 & 2032
- Table 12: France Machine to Machine Communication Industry Revenue (Million) Forecast, by Application 2019 & 2032
- Table 13: Spain Machine to Machine Communication Industry Revenue (Million) Forecast, by Application 2019 & 2032
- Table 14: Italy Machine to Machine Communication Industry Revenue (Million) Forecast, by Application 2019 & 2032
- Table 15: Spain Machine to Machine Communication Industry Revenue (Million) Forecast, by Application 2019 & 2032
- Table 16: Belgium Machine to Machine Communication Industry Revenue (Million) Forecast, by Application 2019 & 2032
- Table 17: Netherland Machine to Machine Communication Industry Revenue (Million) Forecast, by Application 2019 & 2032
- Table 18: Nordics Machine to Machine Communication Industry Revenue (Million) Forecast, by Application 2019 & 2032
- Table 19: Rest of Europe Machine to Machine Communication Industry Revenue (Million) Forecast, by Application 2019 & 2032
- Table 20: Global Machine to Machine Communication Industry Revenue Million Forecast, by Country 2019 & 2032
- Table 21: China Machine to Machine Communication Industry Revenue (Million) Forecast, by Application 2019 & 2032
- Table 22: Japan Machine to Machine Communication Industry Revenue (Million) Forecast, by Application 2019 & 2032
- Table 23: India Machine to Machine Communication Industry Revenue (Million) Forecast, by Application 2019 & 2032
- Table 24: South Korea Machine to Machine Communication Industry Revenue (Million) Forecast, by Application 2019 & 2032
- Table 25: Southeast Asia Machine to Machine Communication Industry Revenue (Million) Forecast, by Application 2019 & 2032
- Table 26: Australia Machine to Machine Communication Industry Revenue (Million) Forecast, by Application 2019 & 2032
- Table 27: Indonesia Machine to Machine Communication Industry Revenue (Million) Forecast, by Application 2019 & 2032
- Table 28: Phillipes Machine to Machine Communication Industry Revenue (Million) Forecast, by Application 2019 & 2032
- Table 29: Singapore Machine to Machine Communication Industry Revenue (Million) Forecast, by Application 2019 & 2032
- Table 30: Thailandc Machine to Machine Communication Industry Revenue (Million) Forecast, by Application 2019 & 2032
- Table 31: Rest of Asia Pacific Machine to Machine Communication Industry Revenue (Million) Forecast, by Application 2019 & 2032
- Table 32: Global Machine to Machine Communication Industry Revenue Million Forecast, by Country 2019 & 2032
- Table 33: Brazil Machine to Machine Communication Industry Revenue (Million) Forecast, by Application 2019 & 2032
- Table 34: Argentina Machine to Machine Communication Industry Revenue (Million) Forecast, by Application 2019 & 2032
- Table 35: Peru Machine to Machine Communication Industry Revenue (Million) Forecast, by Application 2019 & 2032
- Table 36: Chile Machine to Machine Communication Industry Revenue (Million) Forecast, by Application 2019 & 2032
- Table 37: Colombia Machine to Machine Communication Industry Revenue (Million) Forecast, by Application 2019 & 2032
- Table 38: Ecuador Machine to Machine Communication Industry Revenue (Million) Forecast, by Application 2019 & 2032
- Table 39: Venezuela Machine to Machine Communication Industry Revenue (Million) Forecast, by Application 2019 & 2032
- Table 40: Rest of South America Machine to Machine Communication Industry Revenue (Million) Forecast, by Application 2019 & 2032
- Table 41: Global Machine to Machine Communication Industry Revenue Million Forecast, by Country 2019 & 2032
- Table 42: United States Machine to Machine Communication Industry Revenue (Million) Forecast, by Application 2019 & 2032
- Table 43: Canada Machine to Machine Communication Industry Revenue (Million) Forecast, by Application 2019 & 2032
- Table 44: Mexico Machine to Machine Communication Industry Revenue (Million) Forecast, by Application 2019 & 2032
- Table 45: Global Machine to Machine Communication Industry Revenue Million Forecast, by Country 2019 & 2032
- Table 46: United Arab Emirates Machine to Machine Communication Industry Revenue (Million) Forecast, by Application 2019 & 2032
- Table 47: Saudi Arabia Machine to Machine Communication Industry Revenue (Million) Forecast, by Application 2019 & 2032
- Table 48: South Africa Machine to Machine Communication Industry Revenue (Million) Forecast, by Application 2019 & 2032
- Table 49: Rest of Middle East and Africa Machine to Machine Communication Industry Revenue (Million) Forecast, by Application 2019 & 2032
- Table 50: Global Machine to Machine Communication Industry Revenue Million Forecast, by Communication Channel Type 2019 & 2032
- Table 51: Global Machine to Machine Communication Industry Revenue Million Forecast, by End-user Industry 2019 & 2032
- Table 52: Global Machine to Machine Communication Industry Revenue Million Forecast, by Country 2019 & 2032
- Table 53: Global Machine to Machine Communication Industry Revenue Million Forecast, by Communication Channel Type 2019 & 2032
- Table 54: Global Machine to Machine Communication Industry Revenue Million Forecast, by End-user Industry 2019 & 2032
- Table 55: Global Machine to Machine Communication Industry Revenue Million Forecast, by Country 2019 & 2032
- Table 56: Global Machine to Machine Communication Industry Revenue Million Forecast, by Communication Channel Type 2019 & 2032
- Table 57: Global Machine to Machine Communication Industry Revenue Million Forecast, by End-user Industry 2019 & 2032
- Table 58: Global Machine to Machine Communication Industry Revenue Million Forecast, by Country 2019 & 2032
- Table 59: Global Machine to Machine Communication Industry Revenue Million Forecast, by Communication Channel Type 2019 & 2032
- Table 60: Global Machine to Machine Communication Industry Revenue Million Forecast, by End-user Industry 2019 & 2032
- Table 61: Global Machine to Machine Communication Industry Revenue Million Forecast, by Country 2019 & 2032
Frequently Asked Questions
1. What is the projected Compound Annual Growth Rate (CAGR) of the Machine to Machine Communication Industry?
The projected CAGR is approximately 9.42%.
2. Which companies are prominent players in the Machine to Machine Communication Industry?
Key companies in the market include Telefonaktiebolaget LM Ericsson, Cisco Systems Inc, Qualcomm Incorporated, Huawei Technologies Co Ltd, Nokia Corporation, Telecom Italia*List Not Exhaustive, Intel Corporation, Panasonic Corporation.
3. What are the main segments of the Machine to Machine Communication Industry?
The market segments include Communication Channel Type, End-user Industry.
4. Can you provide details about the market size?
The market size is estimated to be USD 2.58 Million as of 2022.
5. What are some drivers contributing to market growth?
Augmented Demand for A Better Connectivity Experience; Necessity for Fast Internet Connectivity; Requirement of 5G in IoT.
6. What are the notable trends driving market growth?
Energy Holds a Dominant Position in the Massive Machine Type Communication Market.
7. Are there any restraints impacting market growth?
Technology Limitations to Support Constant High-Speed Connections; Large Investment Involved in Developing 5G Infrastructure.
8. Can you provide examples of recent developments in the market?
November 2023 - Salesforce and AWS Expand Partnership for Customers to More Easily Build Trusted AI Apps, Deliver Intelligent, Data-Powered CRM Experiences, and Bring Salesforce Products to AWS Marketplace
9. What pricing options are available for accessing the report?
Pricing options include single-user, multi-user, and enterprise licenses priced at USD 4750, USD 5250, and USD 8750 respectively.
10. Is the market size provided in terms of value or volume?
The market size is provided in terms of value, measured in Million.
11. Are there any specific market keywords associated with the report?
Yes, the market keyword associated with the report is "Machine to Machine Communication Industry," which aids in identifying and referencing the specific market segment covered.
12. How do I determine which pricing option suits my needs best?
The pricing options vary based on user requirements and access needs. Individual users may opt for single-user licenses, while businesses requiring broader access may choose multi-user or enterprise licenses for cost-effective access to the report.
13. Are there any additional resources or data provided in the Machine to Machine Communication Industry report?
While the report offers comprehensive insights, it's advisable to review the specific contents or supplementary materials provided to ascertain if additional resources or data are available.
14. How can I stay updated on further developments or reports in the Machine to Machine Communication Industry?
To stay informed about further developments, trends, and reports in the Machine to Machine Communication Industry, consider subscribing to industry newsletters, following relevant companies and organizations, or regularly checking reputable industry news sources and publications.
Methodology
Step 1 - Identification of Relevant Samples Size from Population Database


Step 2 - Approaches for Defining Global Market Size (Value, Volume* & Price*)

Note*: In applicable scenarios
Step 3 - Data Sources
Primary Research
- Web Analytics
- Survey Reports
- Research Institute
- Latest Research Reports
- Opinion Leaders
Secondary Research
- Annual Reports
- White Paper
- Latest Press Release
- Industry Association
- Paid Database
- Investor Presentations

Step 4 - Data Triangulation
Involves using different sources of information in order to increase the validity of a study
These sources are likely to be stakeholders in a program - participants, other researchers, program staff, other community members, and so on.
Then we put all data in single framework & apply various statistical tools to find out the dynamic on the market.
During the analysis stage, feedback from the stakeholder groups would be compared to determine areas of agreement as well as areas of divergence


