
Key Insights
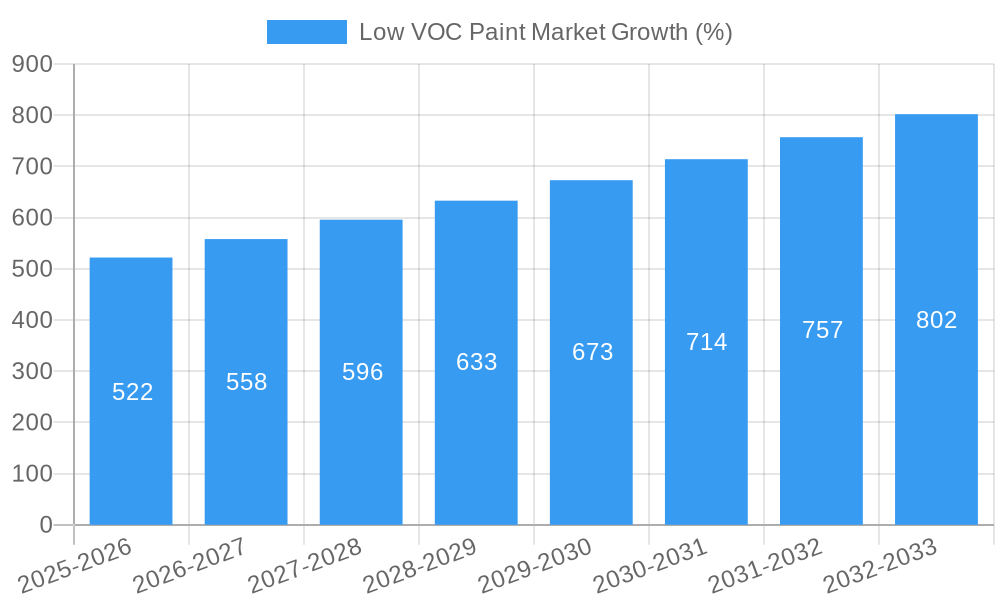
The global low VOC paint market, valued at $8.84 billion in 2025, is projected to experience robust growth, driven by increasing environmental regulations and a heightened consumer awareness of indoor air quality. The market's Compound Annual Growth Rate (CAGR) exceeding 5.60% from 2025 to 2033 indicates a significant expansion opportunity. Key drivers include stringent government regulations limiting volatile organic compound (VOC) emissions from paints, the rising prevalence of allergies and respiratory illnesses linked to high-VOC paints, and the growing demand for eco-friendly and sustainable building materials. Market trends point towards increasing adoption of water-borne and powder coatings due to their lower VOC content and superior performance characteristics. The architectural and decorative segment currently dominates the application landscape, fueled by residential and commercial construction activities. However, significant growth potential exists within the automotive refinish and industrial sectors as manufacturers transition to more environmentally compliant solutions. While higher initial costs compared to conventional paints could pose a restraint, the long-term health and environmental benefits are increasingly outweighing this factor, fostering market expansion.
The market segmentation reveals a diverse landscape. Water-borne low VOC paints currently hold a significant market share, benefiting from their ease of application and reduced environmental impact. However, powder coatings are gaining traction due to their exceptional durability and zero-VOC emission properties. Geographically, the Asia-Pacific region, particularly China and India, presents substantial growth opportunities due to rapid urbanization and infrastructure development. North America and Europe, driven by stringent environmental regulations and increased consumer demand for sustainable products, also represent significant market segments. Key players in this competitive market include Sherwin-Williams, Arkema, Jotun, and PPG Industries, continuously innovating to meet the evolving needs of consumers and regulatory requirements. The market's future trajectory is strongly linked to ongoing technological advancements, further environmental regulations, and increasing consumer preference for healthy living environments.
Low VOC Paint Market: A Comprehensive Report (2019-2033)
This in-depth report provides a comprehensive analysis of the Low VOC Paint Market, offering invaluable insights for industry stakeholders, investors, and researchers. Covering the period 2019-2033, with a focus on 2025, this report delves into market structure, competitive dynamics, industry trends, dominant segments, and future growth prospects. The global Low VOC paint market is projected to reach xx Million by 2033, exhibiting a CAGR of xx% during the forecast period (2025-2033).

Low VOC Paint Market Structure & Competitive Dynamics
This section analyzes the competitive landscape of the Low VOC paint market, examining market concentration, innovation ecosystems, regulatory frameworks, product substitutes, end-user trends, and M&A activities. The market exhibits a moderately concentrated structure, with key players such as The Sherwin-Williams Company, PPG Industries Inc, and Akzo Nobel N.V. holding significant market share. However, the presence of numerous regional and specialized players fosters competition. Innovation is driven by the need for improved performance, sustainability, and reduced environmental impact. Stringent VOC emission regulations globally are shaping the market, favoring manufacturers who offer compliant products. The market also sees substitution pressures from alternative coatings and materials. Recent M&A activity has focused on expanding geographical reach and product portfolios, with total deal values estimated at xx Million in the past five years. Key metrics like market share and M&A deal values are detailed within the full report.
- Market Concentration: Moderately concentrated, with top players holding xx% market share.
- Innovation: Driven by sustainability, performance improvements, and regulatory compliance.
- Regulatory Framework: Stringent VOC emission regulations globally are major drivers.
- Product Substitutes: Competition from alternative coatings and materials.
- M&A Activity: xx Million in deal value over the past 5 years, focused on expansion and portfolio diversification.
Low VOC Paint Market Industry Trends & Insights
The Low VOC paint market is experiencing robust growth, driven by increasing environmental awareness, stringent regulations, and growing demand across diverse applications. The shift towards sustainable and eco-friendly products is a major catalyst, with consumers and businesses prioritizing low-impact solutions. Technological advancements in water-borne and powder coatings are further boosting market expansion. The market penetration of Low VOC paints is increasing across various sectors, particularly in architecture and decorative applications. The CAGR for the period 2019-2024 is estimated at xx%, reflecting strong historical growth. Competitive dynamics are characterized by innovation, product differentiation, and strategic partnerships. The report provides detailed analysis on specific market segments, detailing their growth trajectories and competitive landscapes.
Dominant Markets & Segments in Low VOC Paint Market
The architecture and decorative segment significantly dominates the low VOC paint market, fueled by robust demand from both residential and commercial construction projects. North America and Europe currently lead geographically, driven by stringent environmental regulations and a highly conscious consumer base prioritizing sustainable products. However, the Asia-Pacific region is poised for substantial growth, propelled by rapid urbanization, extensive infrastructure development, and a rising middle class increasingly seeking eco-friendly building materials. This expansion is further supported by government initiatives promoting sustainable construction practices.
- Leading Regions: North America and Europe (Currently)
- Fastest-Growing Region: Asia-Pacific, driven by rapid urbanization and infrastructure development.
- Dominant Segment (Paint Type): Water-borne low-VOC paints, due to their superior performance, cost-effectiveness, and environmental compliance.
- Dominant Segment (Application): Architecture and Decorative, encompassing both interior and exterior applications in residential and commercial buildings.
Key Drivers for Dominant Segments:
- Architecture & Decorative: Booming construction activity globally, increased disposable incomes in many regions, a growing preference for aesthetically pleasing and environmentally responsible coatings, and increasing awareness of indoor air quality.
- Water-borne Low-VOC Paints: Superior cost-effectiveness compared to solvent-based alternatives, ease of application, reduced health risks associated with VOC exposure, and strong alignment with increasingly stringent environmental regulations worldwide.
- North America/Europe: Stringent environmental regulations, high consumer awareness of environmental and health impacts, well-developed infrastructure supporting the distribution and application of these paints, and established green building standards.
- Asia-Pacific: Rapid urbanization and infrastructure development creating massive demand, rising disposable incomes enabling consumers to opt for premium, eco-friendly products, and supportive government policies promoting sustainable construction.
Low VOC Paint Market Product Innovations
Recent innovations focus on improving the performance characteristics of Low VOC paints while maintaining their environmental benefits. This includes developing new formulations with enhanced durability, color retention, and resistance to weathering. The integration of nanotechnology and bio-based materials is also gaining traction, offering superior performance and sustainability. These innovations are tailored to specific application needs, catering to the demands of different end-use industries. The market is witnessing a shift towards high-performance, multifunctional Low VOC paints that provide superior protection and aesthetics.
Report Segmentation & Scope
This report segments the Low VOC paint market by Type (Low-VOC, No or Zero VOC, Natural), Formulation Type (Water-borne, Solvent-borne, Powder), and Application (Architecture and Decorative, General Industrial, Automotive OEM, Automotive Refinish, Marine, Consumer Durables, Other Applications). Each segment is analyzed in detail, providing market size estimations, growth projections, and competitive dynamics. For instance, the water-borne segment is expected to dominate due to its cost-effectiveness and environmental benefits. Similarly, the architecture and decorative application is expected to show robust growth driven by increasing construction activities globally.
Key Drivers of Low VOC Paint Market Growth
The low VOC paint market's expansion is significantly driven by a global push towards stricter environmental regulations designed to curtail VOC emissions and improve air quality. This is coupled with a burgeoning consumer awareness regarding the potential health and environmental hazards associated with traditional, high-VOC paints. This heightened awareness is fueling demand for safer, eco-friendly alternatives. Simultaneously, continuous advancements in paint formulation and manufacturing technologies are resulting in high-performance low-VOC paints that rival or exceed the quality of their conventional counterparts. Finally, sustained economic growth and ambitious infrastructure projects in emerging economies are contributing substantially to market expansion.
Challenges in the Low VOC Paint Market Sector
The Low VOC paint market faces challenges such as higher production costs compared to conventional paints, limiting affordability in certain regions. Supply chain disruptions, particularly concerning raw materials, can impact production and pricing. Also, intense competition among established and new market entrants poses a challenge to profitability and market share. Finally, ensuring consistent quality and performance across different Low VOC paint formulations can be technically demanding.
Leading Players in the Low VOC Paint Market
- The Sherwin-Williams Company
- Arkema
- Jotun
- Berger Paints India Limited
- AURO
- American Formulating & Manufacturing
- PPG Industries Inc
- Benjamin Moore & Co
- Nippon Paint Holdings Co Ltd
- BASF SE
- Cloverdale Paint Inc
- Kalekim
- Akzo Nobel N.V.
- BioShield Paint Company
- Crown Trade
- Axalta Coating Systems LLC
- Asian Paints
- Kansai Paint Co Ltd
- Fine Paints of Europe
Key Developments in Low VOC Paint Market Sector
- 2022 Q4: Akzo Nobel expanded its portfolio with a new range of sustainable, high-performance water-borne paints, showcasing a commitment to innovation in eco-friendly coatings.
- 2023 Q1: PPG Industries announced a strategic partnership aimed at broadening its low-VOC paint offerings and enhancing its market reach through collaborative efforts.
- 2023 Q2: The Sherwin-Williams Company significantly invested in research and development focused on bio-based low-VOC formulations, reflecting a dedication to developing environmentally conscious products. (Further details on specific developments will be provided in the full report).
Strategic Low VOC Paint Market Outlook
The future of the Low VOC paint market appears promising, driven by the continued focus on sustainability and the increasing demand for eco-friendly products. Strategic opportunities lie in innovation, particularly in developing high-performance, cost-effective Low VOC formulations catering to diverse applications. Expansion into emerging markets with high growth potential presents further opportunities. Companies focusing on sustainable supply chains and circular economy principles are expected to gain a competitive edge. The market is poised for substantial growth in the coming years, with a positive outlook for companies that adopt innovative strategies and respond effectively to evolving regulatory landscapes.
Low VOC Paint Market Segmentation
-
1. Type
- 1.1. Low-VOC
- 1.2. No or Zero VOC
- 1.3. Natural
-
2. Formulation Type
- 2.1. Water-borne
- 2.2. Solvent-borne
- 2.3. Powder
-
3. Application
- 3.1. Architecture and Decorative
- 3.2. General Industrial
- 3.3. Automotive OEM
- 3.4. Automotive Refinish
- 3.5. Marine
- 3.6. Consumer Durables
- 3.7. Other Ap
Low VOC Paint Market Segmentation By Geography
-
1. Asia Pacific
- 1.1. China
- 1.2. India
- 1.3. Japan
- 1.4. South Korea
- 1.5. Rest of Asia Pacific
-
2. North America
- 2.1. United States
- 2.2. Canada
- 2.3. Mexico
-
3. Europe
- 3.1. Germany
- 3.2. United Kingdom
- 3.3. France
- 3.4. Italy
- 3.5. Rest of Europe
-
4. South America
- 4.1. Brazil
- 4.2. Argentina
- 4.3. Rest of South America
-
5. Middle East and Africa
- 5.1. Saudi Arabia
- 5.2. South Africa
- 5.3. Rest of Middle East and Africa

Low VOC Paint Market REPORT HIGHLIGHTS
| Aspects | Details |
|---|---|
| Study Period | 2019-2033 |
| Base Year | 2024 |
| Estimated Year | 2025 |
| Forecast Period | 2025-2033 |
| Historical Period | 2019-2024 |
| Growth Rate | CAGR of > 5.60% from 2019-2033 |
| Segmentation |
|
Table of Contents
- 1. Introduction
- 1.1. Research Scope
- 1.2. Market Segmentation
- 1.3. Research Methodology
- 1.4. Definitions and Assumptions
- 2. Executive Summary
- 2.1. Introduction
- 3. Market Dynamics
- 3.1. Introduction
- 3.2. Market Drivers
- 3.2.1. Increasing Awareness about Harmful Effects of Conventional Paint4.1.2 increasing Demand in Architectural and Decorative Industry; Other Drivers
- 3.3. Market Restrains
- 3.3.1. High Cost in Comparison to Conventional Paint; Other Restraints
- 3.4. Market Trends
- 3.4.1. Architectural and Decorative Segment to Dominate the Market
- 4. Market Factor Analysis
- 4.1. Porters Five Forces
- 4.2. Supply/Value Chain
- 4.3. PESTEL analysis
- 4.4. Market Entropy
- 4.5. Patent/Trademark Analysis
- 5. Global Low VOC Paint Market Analysis, Insights and Forecast, 2019-2031
- 5.1. Market Analysis, Insights and Forecast - by Type
- 5.1.1. Low-VOC
- 5.1.2. No or Zero VOC
- 5.1.3. Natural
- 5.2. Market Analysis, Insights and Forecast - by Formulation Type
- 5.2.1. Water-borne
- 5.2.2. Solvent-borne
- 5.2.3. Powder
- 5.3. Market Analysis, Insights and Forecast - by Application
- 5.3.1. Architecture and Decorative
- 5.3.2. General Industrial
- 5.3.3. Automotive OEM
- 5.3.4. Automotive Refinish
- 5.3.5. Marine
- 5.3.6. Consumer Durables
- 5.3.7. Other Ap
- 5.4. Market Analysis, Insights and Forecast - by Region
- 5.4.1. Asia Pacific
- 5.4.2. North America
- 5.4.3. Europe
- 5.4.4. South America
- 5.4.5. Middle East and Africa
- 5.1. Market Analysis, Insights and Forecast - by Type
- 6. Asia Pacific Low VOC Paint Market Analysis, Insights and Forecast, 2019-2031
- 6.1. Market Analysis, Insights and Forecast - by Type
- 6.1.1. Low-VOC
- 6.1.2. No or Zero VOC
- 6.1.3. Natural
- 6.2. Market Analysis, Insights and Forecast - by Formulation Type
- 6.2.1. Water-borne
- 6.2.2. Solvent-borne
- 6.2.3. Powder
- 6.3. Market Analysis, Insights and Forecast - by Application
- 6.3.1. Architecture and Decorative
- 6.3.2. General Industrial
- 6.3.3. Automotive OEM
- 6.3.4. Automotive Refinish
- 6.3.5. Marine
- 6.3.6. Consumer Durables
- 6.3.7. Other Ap
- 6.1. Market Analysis, Insights and Forecast - by Type
- 7. North America Low VOC Paint Market Analysis, Insights and Forecast, 2019-2031
- 7.1. Market Analysis, Insights and Forecast - by Type
- 7.1.1. Low-VOC
- 7.1.2. No or Zero VOC
- 7.1.3. Natural
- 7.2. Market Analysis, Insights and Forecast - by Formulation Type
- 7.2.1. Water-borne
- 7.2.2. Solvent-borne
- 7.2.3. Powder
- 7.3. Market Analysis, Insights and Forecast - by Application
- 7.3.1. Architecture and Decorative
- 7.3.2. General Industrial
- 7.3.3. Automotive OEM
- 7.3.4. Automotive Refinish
- 7.3.5. Marine
- 7.3.6. Consumer Durables
- 7.3.7. Other Ap
- 7.1. Market Analysis, Insights and Forecast - by Type
- 8. Europe Low VOC Paint Market Analysis, Insights and Forecast, 2019-2031
- 8.1. Market Analysis, Insights and Forecast - by Type
- 8.1.1. Low-VOC
- 8.1.2. No or Zero VOC
- 8.1.3. Natural
- 8.2. Market Analysis, Insights and Forecast - by Formulation Type
- 8.2.1. Water-borne
- 8.2.2. Solvent-borne
- 8.2.3. Powder
- 8.3. Market Analysis, Insights and Forecast - by Application
- 8.3.1. Architecture and Decorative
- 8.3.2. General Industrial
- 8.3.3. Automotive OEM
- 8.3.4. Automotive Refinish
- 8.3.5. Marine
- 8.3.6. Consumer Durables
- 8.3.7. Other Ap
- 8.1. Market Analysis, Insights and Forecast - by Type
- 9. South America Low VOC Paint Market Analysis, Insights and Forecast, 2019-2031
- 9.1. Market Analysis, Insights and Forecast - by Type
- 9.1.1. Low-VOC
- 9.1.2. No or Zero VOC
- 9.1.3. Natural
- 9.2. Market Analysis, Insights and Forecast - by Formulation Type
- 9.2.1. Water-borne
- 9.2.2. Solvent-borne
- 9.2.3. Powder
- 9.3. Market Analysis, Insights and Forecast - by Application
- 9.3.1. Architecture and Decorative
- 9.3.2. General Industrial
- 9.3.3. Automotive OEM
- 9.3.4. Automotive Refinish
- 9.3.5. Marine
- 9.3.6. Consumer Durables
- 9.3.7. Other Ap
- 9.1. Market Analysis, Insights and Forecast - by Type
- 10. Middle East and Africa Low VOC Paint Market Analysis, Insights and Forecast, 2019-2031
- 10.1. Market Analysis, Insights and Forecast - by Type
- 10.1.1. Low-VOC
- 10.1.2. No or Zero VOC
- 10.1.3. Natural
- 10.2. Market Analysis, Insights and Forecast - by Formulation Type
- 10.2.1. Water-borne
- 10.2.2. Solvent-borne
- 10.2.3. Powder
- 10.3. Market Analysis, Insights and Forecast - by Application
- 10.3.1. Architecture and Decorative
- 10.3.2. General Industrial
- 10.3.3. Automotive OEM
- 10.3.4. Automotive Refinish
- 10.3.5. Marine
- 10.3.6. Consumer Durables
- 10.3.7. Other Ap
- 10.1. Market Analysis, Insights and Forecast - by Type
- 11. Asia Pacific Low VOC Paint Market Analysis, Insights and Forecast, 2019-2031
- 11.1. Market Analysis, Insights and Forecast - By Country/Sub-region
- 11.1.1 China
- 11.1.2 India
- 11.1.3 Japan
- 11.1.4 South Korea
- 11.1.5 Rest of Asia Pacific
- 12. North America Low VOC Paint Market Analysis, Insights and Forecast, 2019-2031
- 12.1. Market Analysis, Insights and Forecast - By Country/Sub-region
- 12.1.1 United States
- 12.1.2 Canada
- 12.1.3 Mexico
- 13. Europe Low VOC Paint Market Analysis, Insights and Forecast, 2019-2031
- 13.1. Market Analysis, Insights and Forecast - By Country/Sub-region
- 13.1.1 Germany
- 13.1.2 United Kingdom
- 13.1.3 France
- 13.1.4 Italy
- 13.1.5 Rest of Europe
- 14. South America Low VOC Paint Market Analysis, Insights and Forecast, 2019-2031
- 14.1. Market Analysis, Insights and Forecast - By Country/Sub-region
- 14.1.1 Brazil
- 14.1.2 Argentina
- 14.1.3 Rest of South America
- 15. Middle East and Africa Low VOC Paint Market Analysis, Insights and Forecast, 2019-2031
- 15.1. Market Analysis, Insights and Forecast - By Country/Sub-region
- 15.1.1 Saudi Arabia
- 15.1.2 South Africa
- 15.1.3 Rest of Middle East and Africa
- 16. Competitive Analysis
- 16.1. Global Market Share Analysis 2024
- 16.2. Company Profiles
- 16.2.1 The Sherwin-Williams Company*List Not Exhaustive
- 16.2.1.1. Overview
- 16.2.1.2. Products
- 16.2.1.3. SWOT Analysis
- 16.2.1.4. Recent Developments
- 16.2.1.5. Financials (Based on Availability)
- 16.2.2 Arkema
- 16.2.2.1. Overview
- 16.2.2.2. Products
- 16.2.2.3. SWOT Analysis
- 16.2.2.4. Recent Developments
- 16.2.2.5. Financials (Based on Availability)
- 16.2.3 Jotun
- 16.2.3.1. Overview
- 16.2.3.2. Products
- 16.2.3.3. SWOT Analysis
- 16.2.3.4. Recent Developments
- 16.2.3.5. Financials (Based on Availability)
- 16.2.4 Berger Paints India Limited
- 16.2.4.1. Overview
- 16.2.4.2. Products
- 16.2.4.3. SWOT Analysis
- 16.2.4.4. Recent Developments
- 16.2.4.5. Financials (Based on Availability)
- 16.2.5 AURO
- 16.2.5.1. Overview
- 16.2.5.2. Products
- 16.2.5.3. SWOT Analysis
- 16.2.5.4. Recent Developments
- 16.2.5.5. Financials (Based on Availability)
- 16.2.6 American Formulating & Manufacturing
- 16.2.6.1. Overview
- 16.2.6.2. Products
- 16.2.6.3. SWOT Analysis
- 16.2.6.4. Recent Developments
- 16.2.6.5. Financials (Based on Availability)
- 16.2.7 PPG Industries Inc
- 16.2.7.1. Overview
- 16.2.7.2. Products
- 16.2.7.3. SWOT Analysis
- 16.2.7.4. Recent Developments
- 16.2.7.5. Financials (Based on Availability)
- 16.2.8 Benjamin Moore & Co
- 16.2.8.1. Overview
- 16.2.8.2. Products
- 16.2.8.3. SWOT Analysis
- 16.2.8.4. Recent Developments
- 16.2.8.5. Financials (Based on Availability)
- 16.2.9 Nippon Paint Holdings Co Ltd
- 16.2.9.1. Overview
- 16.2.9.2. Products
- 16.2.9.3. SWOT Analysis
- 16.2.9.4. Recent Developments
- 16.2.9.5. Financials (Based on Availability)
- 16.2.10 BASF SE
- 16.2.10.1. Overview
- 16.2.10.2. Products
- 16.2.10.3. SWOT Analysis
- 16.2.10.4. Recent Developments
- 16.2.10.5. Financials (Based on Availability)
- 16.2.11 Cloverdale Paint Inc
- 16.2.11.1. Overview
- 16.2.11.2. Products
- 16.2.11.3. SWOT Analysis
- 16.2.11.4. Recent Developments
- 16.2.11.5. Financials (Based on Availability)
- 16.2.12 Kalekim
- 16.2.12.1. Overview
- 16.2.12.2. Products
- 16.2.12.3. SWOT Analysis
- 16.2.12.4. Recent Developments
- 16.2.12.5. Financials (Based on Availability)
- 16.2.13 Akzo Nobel N V
- 16.2.13.1. Overview
- 16.2.13.2. Products
- 16.2.13.3. SWOT Analysis
- 16.2.13.4. Recent Developments
- 16.2.13.5. Financials (Based on Availability)
- 16.2.14 BioShield Paint Company
- 16.2.14.1. Overview
- 16.2.14.2. Products
- 16.2.14.3. SWOT Analysis
- 16.2.14.4. Recent Developments
- 16.2.14.5. Financials (Based on Availability)
- 16.2.15 Crown Trade
- 16.2.15.1. Overview
- 16.2.15.2. Products
- 16.2.15.3. SWOT Analysis
- 16.2.15.4. Recent Developments
- 16.2.15.5. Financials (Based on Availability)
- 16.2.16 Axalta Coating Systems LLC
- 16.2.16.1. Overview
- 16.2.16.2. Products
- 16.2.16.3. SWOT Analysis
- 16.2.16.4. Recent Developments
- 16.2.16.5. Financials (Based on Availability)
- 16.2.17 Asian Paints
- 16.2.17.1. Overview
- 16.2.17.2. Products
- 16.2.17.3. SWOT Analysis
- 16.2.17.4. Recent Developments
- 16.2.17.5. Financials (Based on Availability)
- 16.2.18 Kansai Paint Co Ltd
- 16.2.18.1. Overview
- 16.2.18.2. Products
- 16.2.18.3. SWOT Analysis
- 16.2.18.4. Recent Developments
- 16.2.18.5. Financials (Based on Availability)
- 16.2.19 Fine Paints of Europe
- 16.2.19.1. Overview
- 16.2.19.2. Products
- 16.2.19.3. SWOT Analysis
- 16.2.19.4. Recent Developments
- 16.2.19.5. Financials (Based on Availability)
- 16.2.1 The Sherwin-Williams Company*List Not Exhaustive
List of Figures
- Figure 1: Global Low VOC Paint Market Revenue Breakdown (Million, %) by Region 2024 & 2032
- Figure 2: Global Low VOC Paint Market Volume Breakdown (K Tons, %) by Region 2024 & 2032
- Figure 3: Asia Pacific Low VOC Paint Market Revenue (Million), by Country 2024 & 2032
- Figure 4: Asia Pacific Low VOC Paint Market Volume (K Tons), by Country 2024 & 2032
- Figure 5: Asia Pacific Low VOC Paint Market Revenue Share (%), by Country 2024 & 2032
- Figure 6: Asia Pacific Low VOC Paint Market Volume Share (%), by Country 2024 & 2032
- Figure 7: North America Low VOC Paint Market Revenue (Million), by Country 2024 & 2032
- Figure 8: North America Low VOC Paint Market Volume (K Tons), by Country 2024 & 2032
- Figure 9: North America Low VOC Paint Market Revenue Share (%), by Country 2024 & 2032
- Figure 10: North America Low VOC Paint Market Volume Share (%), by Country 2024 & 2032
- Figure 11: Europe Low VOC Paint Market Revenue (Million), by Country 2024 & 2032
- Figure 12: Europe Low VOC Paint Market Volume (K Tons), by Country 2024 & 2032
- Figure 13: Europe Low VOC Paint Market Revenue Share (%), by Country 2024 & 2032
- Figure 14: Europe Low VOC Paint Market Volume Share (%), by Country 2024 & 2032
- Figure 15: South America Low VOC Paint Market Revenue (Million), by Country 2024 & 2032
- Figure 16: South America Low VOC Paint Market Volume (K Tons), by Country 2024 & 2032
- Figure 17: South America Low VOC Paint Market Revenue Share (%), by Country 2024 & 2032
- Figure 18: South America Low VOC Paint Market Volume Share (%), by Country 2024 & 2032
- Figure 19: Middle East and Africa Low VOC Paint Market Revenue (Million), by Country 2024 & 2032
- Figure 20: Middle East and Africa Low VOC Paint Market Volume (K Tons), by Country 2024 & 2032
- Figure 21: Middle East and Africa Low VOC Paint Market Revenue Share (%), by Country 2024 & 2032
- Figure 22: Middle East and Africa Low VOC Paint Market Volume Share (%), by Country 2024 & 2032
- Figure 23: Asia Pacific Low VOC Paint Market Revenue (Million), by Type 2024 & 2032
- Figure 24: Asia Pacific Low VOC Paint Market Volume (K Tons), by Type 2024 & 2032
- Figure 25: Asia Pacific Low VOC Paint Market Revenue Share (%), by Type 2024 & 2032
- Figure 26: Asia Pacific Low VOC Paint Market Volume Share (%), by Type 2024 & 2032
- Figure 27: Asia Pacific Low VOC Paint Market Revenue (Million), by Formulation Type 2024 & 2032
- Figure 28: Asia Pacific Low VOC Paint Market Volume (K Tons), by Formulation Type 2024 & 2032
- Figure 29: Asia Pacific Low VOC Paint Market Revenue Share (%), by Formulation Type 2024 & 2032
- Figure 30: Asia Pacific Low VOC Paint Market Volume Share (%), by Formulation Type 2024 & 2032
- Figure 31: Asia Pacific Low VOC Paint Market Revenue (Million), by Application 2024 & 2032
- Figure 32: Asia Pacific Low VOC Paint Market Volume (K Tons), by Application 2024 & 2032
- Figure 33: Asia Pacific Low VOC Paint Market Revenue Share (%), by Application 2024 & 2032
- Figure 34: Asia Pacific Low VOC Paint Market Volume Share (%), by Application 2024 & 2032
- Figure 35: Asia Pacific Low VOC Paint Market Revenue (Million), by Country 2024 & 2032
- Figure 36: Asia Pacific Low VOC Paint Market Volume (K Tons), by Country 2024 & 2032
- Figure 37: Asia Pacific Low VOC Paint Market Revenue Share (%), by Country 2024 & 2032
- Figure 38: Asia Pacific Low VOC Paint Market Volume Share (%), by Country 2024 & 2032
- Figure 39: North America Low VOC Paint Market Revenue (Million), by Type 2024 & 2032
- Figure 40: North America Low VOC Paint Market Volume (K Tons), by Type 2024 & 2032
- Figure 41: North America Low VOC Paint Market Revenue Share (%), by Type 2024 & 2032
- Figure 42: North America Low VOC Paint Market Volume Share (%), by Type 2024 & 2032
- Figure 43: North America Low VOC Paint Market Revenue (Million), by Formulation Type 2024 & 2032
- Figure 44: North America Low VOC Paint Market Volume (K Tons), by Formulation Type 2024 & 2032
- Figure 45: North America Low VOC Paint Market Revenue Share (%), by Formulation Type 2024 & 2032
- Figure 46: North America Low VOC Paint Market Volume Share (%), by Formulation Type 2024 & 2032
- Figure 47: North America Low VOC Paint Market Revenue (Million), by Application 2024 & 2032
- Figure 48: North America Low VOC Paint Market Volume (K Tons), by Application 2024 & 2032
- Figure 49: North America Low VOC Paint Market Revenue Share (%), by Application 2024 & 2032
- Figure 50: North America Low VOC Paint Market Volume Share (%), by Application 2024 & 2032
- Figure 51: North America Low VOC Paint Market Revenue (Million), by Country 2024 & 2032
- Figure 52: North America Low VOC Paint Market Volume (K Tons), by Country 2024 & 2032
- Figure 53: North America Low VOC Paint Market Revenue Share (%), by Country 2024 & 2032
- Figure 54: North America Low VOC Paint Market Volume Share (%), by Country 2024 & 2032
- Figure 55: Europe Low VOC Paint Market Revenue (Million), by Type 2024 & 2032
- Figure 56: Europe Low VOC Paint Market Volume (K Tons), by Type 2024 & 2032
- Figure 57: Europe Low VOC Paint Market Revenue Share (%), by Type 2024 & 2032
- Figure 58: Europe Low VOC Paint Market Volume Share (%), by Type 2024 & 2032
- Figure 59: Europe Low VOC Paint Market Revenue (Million), by Formulation Type 2024 & 2032
- Figure 60: Europe Low VOC Paint Market Volume (K Tons), by Formulation Type 2024 & 2032
- Figure 61: Europe Low VOC Paint Market Revenue Share (%), by Formulation Type 2024 & 2032
- Figure 62: Europe Low VOC Paint Market Volume Share (%), by Formulation Type 2024 & 2032
- Figure 63: Europe Low VOC Paint Market Revenue (Million), by Application 2024 & 2032
- Figure 64: Europe Low VOC Paint Market Volume (K Tons), by Application 2024 & 2032
- Figure 65: Europe Low VOC Paint Market Revenue Share (%), by Application 2024 & 2032
- Figure 66: Europe Low VOC Paint Market Volume Share (%), by Application 2024 & 2032
- Figure 67: Europe Low VOC Paint Market Revenue (Million), by Country 2024 & 2032
- Figure 68: Europe Low VOC Paint Market Volume (K Tons), by Country 2024 & 2032
- Figure 69: Europe Low VOC Paint Market Revenue Share (%), by Country 2024 & 2032
- Figure 70: Europe Low VOC Paint Market Volume Share (%), by Country 2024 & 2032
- Figure 71: South America Low VOC Paint Market Revenue (Million), by Type 2024 & 2032
- Figure 72: South America Low VOC Paint Market Volume (K Tons), by Type 2024 & 2032
- Figure 73: South America Low VOC Paint Market Revenue Share (%), by Type 2024 & 2032
- Figure 74: South America Low VOC Paint Market Volume Share (%), by Type 2024 & 2032
- Figure 75: South America Low VOC Paint Market Revenue (Million), by Formulation Type 2024 & 2032
- Figure 76: South America Low VOC Paint Market Volume (K Tons), by Formulation Type 2024 & 2032
- Figure 77: South America Low VOC Paint Market Revenue Share (%), by Formulation Type 2024 & 2032
- Figure 78: South America Low VOC Paint Market Volume Share (%), by Formulation Type 2024 & 2032
- Figure 79: South America Low VOC Paint Market Revenue (Million), by Application 2024 & 2032
- Figure 80: South America Low VOC Paint Market Volume (K Tons), by Application 2024 & 2032
- Figure 81: South America Low VOC Paint Market Revenue Share (%), by Application 2024 & 2032
- Figure 82: South America Low VOC Paint Market Volume Share (%), by Application 2024 & 2032
- Figure 83: South America Low VOC Paint Market Revenue (Million), by Country 2024 & 2032
- Figure 84: South America Low VOC Paint Market Volume (K Tons), by Country 2024 & 2032
- Figure 85: South America Low VOC Paint Market Revenue Share (%), by Country 2024 & 2032
- Figure 86: South America Low VOC Paint Market Volume Share (%), by Country 2024 & 2032
- Figure 87: Middle East and Africa Low VOC Paint Market Revenue (Million), by Type 2024 & 2032
- Figure 88: Middle East and Africa Low VOC Paint Market Volume (K Tons), by Type 2024 & 2032
- Figure 89: Middle East and Africa Low VOC Paint Market Revenue Share (%), by Type 2024 & 2032
- Figure 90: Middle East and Africa Low VOC Paint Market Volume Share (%), by Type 2024 & 2032
- Figure 91: Middle East and Africa Low VOC Paint Market Revenue (Million), by Formulation Type 2024 & 2032
- Figure 92: Middle East and Africa Low VOC Paint Market Volume (K Tons), by Formulation Type 2024 & 2032
- Figure 93: Middle East and Africa Low VOC Paint Market Revenue Share (%), by Formulation Type 2024 & 2032
- Figure 94: Middle East and Africa Low VOC Paint Market Volume Share (%), by Formulation Type 2024 & 2032
- Figure 95: Middle East and Africa Low VOC Paint Market Revenue (Million), by Application 2024 & 2032
- Figure 96: Middle East and Africa Low VOC Paint Market Volume (K Tons), by Application 2024 & 2032
- Figure 97: Middle East and Africa Low VOC Paint Market Revenue Share (%), by Application 2024 & 2032
- Figure 98: Middle East and Africa Low VOC Paint Market Volume Share (%), by Application 2024 & 2032
- Figure 99: Middle East and Africa Low VOC Paint Market Revenue (Million), by Country 2024 & 2032
- Figure 100: Middle East and Africa Low VOC Paint Market Volume (K Tons), by Country 2024 & 2032
- Figure 101: Middle East and Africa Low VOC Paint Market Revenue Share (%), by Country 2024 & 2032
- Figure 102: Middle East and Africa Low VOC Paint Market Volume Share (%), by Country 2024 & 2032
List of Tables
- Table 1: Global Low VOC Paint Market Revenue Million Forecast, by Region 2019 & 2032
- Table 2: Global Low VOC Paint Market Volume K Tons Forecast, by Region 2019 & 2032
- Table 3: Global Low VOC Paint Market Revenue Million Forecast, by Type 2019 & 2032
- Table 4: Global Low VOC Paint Market Volume K Tons Forecast, by Type 2019 & 2032
- Table 5: Global Low VOC Paint Market Revenue Million Forecast, by Formulation Type 2019 & 2032
- Table 6: Global Low VOC Paint Market Volume K Tons Forecast, by Formulation Type 2019 & 2032
- Table 7: Global Low VOC Paint Market Revenue Million Forecast, by Application 2019 & 2032
- Table 8: Global Low VOC Paint Market Volume K Tons Forecast, by Application 2019 & 2032
- Table 9: Global Low VOC Paint Market Revenue Million Forecast, by Region 2019 & 2032
- Table 10: Global Low VOC Paint Market Volume K Tons Forecast, by Region 2019 & 2032
- Table 11: Global Low VOC Paint Market Revenue Million Forecast, by Country 2019 & 2032
- Table 12: Global Low VOC Paint Market Volume K Tons Forecast, by Country 2019 & 2032
- Table 13: China Low VOC Paint Market Revenue (Million) Forecast, by Application 2019 & 2032
- Table 14: China Low VOC Paint Market Volume (K Tons) Forecast, by Application 2019 & 2032
- Table 15: India Low VOC Paint Market Revenue (Million) Forecast, by Application 2019 & 2032
- Table 16: India Low VOC Paint Market Volume (K Tons) Forecast, by Application 2019 & 2032
- Table 17: Japan Low VOC Paint Market Revenue (Million) Forecast, by Application 2019 & 2032
- Table 18: Japan Low VOC Paint Market Volume (K Tons) Forecast, by Application 2019 & 2032
- Table 19: South Korea Low VOC Paint Market Revenue (Million) Forecast, by Application 2019 & 2032
- Table 20: South Korea Low VOC Paint Market Volume (K Tons) Forecast, by Application 2019 & 2032
- Table 21: Rest of Asia Pacific Low VOC Paint Market Revenue (Million) Forecast, by Application 2019 & 2032
- Table 22: Rest of Asia Pacific Low VOC Paint Market Volume (K Tons) Forecast, by Application 2019 & 2032
- Table 23: Global Low VOC Paint Market Revenue Million Forecast, by Country 2019 & 2032
- Table 24: Global Low VOC Paint Market Volume K Tons Forecast, by Country 2019 & 2032
- Table 25: United States Low VOC Paint Market Revenue (Million) Forecast, by Application 2019 & 2032
- Table 26: United States Low VOC Paint Market Volume (K Tons) Forecast, by Application 2019 & 2032
- Table 27: Canada Low VOC Paint Market Revenue (Million) Forecast, by Application 2019 & 2032
- Table 28: Canada Low VOC Paint Market Volume (K Tons) Forecast, by Application 2019 & 2032
- Table 29: Mexico Low VOC Paint Market Revenue (Million) Forecast, by Application 2019 & 2032
- Table 30: Mexico Low VOC Paint Market Volume (K Tons) Forecast, by Application 2019 & 2032
- Table 31: Global Low VOC Paint Market Revenue Million Forecast, by Country 2019 & 2032
- Table 32: Global Low VOC Paint Market Volume K Tons Forecast, by Country 2019 & 2032
- Table 33: Germany Low VOC Paint Market Revenue (Million) Forecast, by Application 2019 & 2032
- Table 34: Germany Low VOC Paint Market Volume (K Tons) Forecast, by Application 2019 & 2032
- Table 35: United Kingdom Low VOC Paint Market Revenue (Million) Forecast, by Application 2019 & 2032
- Table 36: United Kingdom Low VOC Paint Market Volume (K Tons) Forecast, by Application 2019 & 2032
- Table 37: France Low VOC Paint Market Revenue (Million) Forecast, by Application 2019 & 2032
- Table 38: France Low VOC Paint Market Volume (K Tons) Forecast, by Application 2019 & 2032
- Table 39: Italy Low VOC Paint Market Revenue (Million) Forecast, by Application 2019 & 2032
- Table 40: Italy Low VOC Paint Market Volume (K Tons) Forecast, by Application 2019 & 2032
- Table 41: Rest of Europe Low VOC Paint Market Revenue (Million) Forecast, by Application 2019 & 2032
- Table 42: Rest of Europe Low VOC Paint Market Volume (K Tons) Forecast, by Application 2019 & 2032
- Table 43: Global Low VOC Paint Market Revenue Million Forecast, by Country 2019 & 2032
- Table 44: Global Low VOC Paint Market Volume K Tons Forecast, by Country 2019 & 2032
- Table 45: Brazil Low VOC Paint Market Revenue (Million) Forecast, by Application 2019 & 2032
- Table 46: Brazil Low VOC Paint Market Volume (K Tons) Forecast, by Application 2019 & 2032
- Table 47: Argentina Low VOC Paint Market Revenue (Million) Forecast, by Application 2019 & 2032
- Table 48: Argentina Low VOC Paint Market Volume (K Tons) Forecast, by Application 2019 & 2032
- Table 49: Rest of South America Low VOC Paint Market Revenue (Million) Forecast, by Application 2019 & 2032
- Table 50: Rest of South America Low VOC Paint Market Volume (K Tons) Forecast, by Application 2019 & 2032
- Table 51: Global Low VOC Paint Market Revenue Million Forecast, by Country 2019 & 2032
- Table 52: Global Low VOC Paint Market Volume K Tons Forecast, by Country 2019 & 2032
- Table 53: Saudi Arabia Low VOC Paint Market Revenue (Million) Forecast, by Application 2019 & 2032
- Table 54: Saudi Arabia Low VOC Paint Market Volume (K Tons) Forecast, by Application 2019 & 2032
- Table 55: South Africa Low VOC Paint Market Revenue (Million) Forecast, by Application 2019 & 2032
- Table 56: South Africa Low VOC Paint Market Volume (K Tons) Forecast, by Application 2019 & 2032
- Table 57: Rest of Middle East and Africa Low VOC Paint Market Revenue (Million) Forecast, by Application 2019 & 2032
- Table 58: Rest of Middle East and Africa Low VOC Paint Market Volume (K Tons) Forecast, by Application 2019 & 2032
- Table 59: Global Low VOC Paint Market Revenue Million Forecast, by Type 2019 & 2032
- Table 60: Global Low VOC Paint Market Volume K Tons Forecast, by Type 2019 & 2032
- Table 61: Global Low VOC Paint Market Revenue Million Forecast, by Formulation Type 2019 & 2032
- Table 62: Global Low VOC Paint Market Volume K Tons Forecast, by Formulation Type 2019 & 2032
- Table 63: Global Low VOC Paint Market Revenue Million Forecast, by Application 2019 & 2032
- Table 64: Global Low VOC Paint Market Volume K Tons Forecast, by Application 2019 & 2032
- Table 65: Global Low VOC Paint Market Revenue Million Forecast, by Country 2019 & 2032
- Table 66: Global Low VOC Paint Market Volume K Tons Forecast, by Country 2019 & 2032
- Table 67: China Low VOC Paint Market Revenue (Million) Forecast, by Application 2019 & 2032
- Table 68: China Low VOC Paint Market Volume (K Tons) Forecast, by Application 2019 & 2032
- Table 69: India Low VOC Paint Market Revenue (Million) Forecast, by Application 2019 & 2032
- Table 70: India Low VOC Paint Market Volume (K Tons) Forecast, by Application 2019 & 2032
- Table 71: Japan Low VOC Paint Market Revenue (Million) Forecast, by Application 2019 & 2032
- Table 72: Japan Low VOC Paint Market Volume (K Tons) Forecast, by Application 2019 & 2032
- Table 73: South Korea Low VOC Paint Market Revenue (Million) Forecast, by Application 2019 & 2032
- Table 74: South Korea Low VOC Paint Market Volume (K Tons) Forecast, by Application 2019 & 2032
- Table 75: Rest of Asia Pacific Low VOC Paint Market Revenue (Million) Forecast, by Application 2019 & 2032
- Table 76: Rest of Asia Pacific Low VOC Paint Market Volume (K Tons) Forecast, by Application 2019 & 2032
- Table 77: Global Low VOC Paint Market Revenue Million Forecast, by Type 2019 & 2032
- Table 78: Global Low VOC Paint Market Volume K Tons Forecast, by Type 2019 & 2032
- Table 79: Global Low VOC Paint Market Revenue Million Forecast, by Formulation Type 2019 & 2032
- Table 80: Global Low VOC Paint Market Volume K Tons Forecast, by Formulation Type 2019 & 2032
- Table 81: Global Low VOC Paint Market Revenue Million Forecast, by Application 2019 & 2032
- Table 82: Global Low VOC Paint Market Volume K Tons Forecast, by Application 2019 & 2032
- Table 83: Global Low VOC Paint Market Revenue Million Forecast, by Country 2019 & 2032
- Table 84: Global Low VOC Paint Market Volume K Tons Forecast, by Country 2019 & 2032
- Table 85: United States Low VOC Paint Market Revenue (Million) Forecast, by Application 2019 & 2032
- Table 86: United States Low VOC Paint Market Volume (K Tons) Forecast, by Application 2019 & 2032
- Table 87: Canada Low VOC Paint Market Revenue (Million) Forecast, by Application 2019 & 2032
- Table 88: Canada Low VOC Paint Market Volume (K Tons) Forecast, by Application 2019 & 2032
- Table 89: Mexico Low VOC Paint Market Revenue (Million) Forecast, by Application 2019 & 2032
- Table 90: Mexico Low VOC Paint Market Volume (K Tons) Forecast, by Application 2019 & 2032
- Table 91: Global Low VOC Paint Market Revenue Million Forecast, by Type 2019 & 2032
- Table 92: Global Low VOC Paint Market Volume K Tons Forecast, by Type 2019 & 2032
- Table 93: Global Low VOC Paint Market Revenue Million Forecast, by Formulation Type 2019 & 2032
- Table 94: Global Low VOC Paint Market Volume K Tons Forecast, by Formulation Type 2019 & 2032
- Table 95: Global Low VOC Paint Market Revenue Million Forecast, by Application 2019 & 2032
- Table 96: Global Low VOC Paint Market Volume K Tons Forecast, by Application 2019 & 2032
- Table 97: Global Low VOC Paint Market Revenue Million Forecast, by Country 2019 & 2032
- Table 98: Global Low VOC Paint Market Volume K Tons Forecast, by Country 2019 & 2032
- Table 99: Germany Low VOC Paint Market Revenue (Million) Forecast, by Application 2019 & 2032
- Table 100: Germany Low VOC Paint Market Volume (K Tons) Forecast, by Application 2019 & 2032
- Table 101: United Kingdom Low VOC Paint Market Revenue (Million) Forecast, by Application 2019 & 2032
- Table 102: United Kingdom Low VOC Paint Market Volume (K Tons) Forecast, by Application 2019 & 2032
- Table 103: France Low VOC Paint Market Revenue (Million) Forecast, by Application 2019 & 2032
- Table 104: France Low VOC Paint Market Volume (K Tons) Forecast, by Application 2019 & 2032
- Table 105: Italy Low VOC Paint Market Revenue (Million) Forecast, by Application 2019 & 2032
- Table 106: Italy Low VOC Paint Market Volume (K Tons) Forecast, by Application 2019 & 2032
- Table 107: Rest of Europe Low VOC Paint Market Revenue (Million) Forecast, by Application 2019 & 2032
- Table 108: Rest of Europe Low VOC Paint Market Volume (K Tons) Forecast, by Application 2019 & 2032
- Table 109: Global Low VOC Paint Market Revenue Million Forecast, by Type 2019 & 2032
- Table 110: Global Low VOC Paint Market Volume K Tons Forecast, by Type 2019 & 2032
- Table 111: Global Low VOC Paint Market Revenue Million Forecast, by Formulation Type 2019 & 2032
- Table 112: Global Low VOC Paint Market Volume K Tons Forecast, by Formulation Type 2019 & 2032
- Table 113: Global Low VOC Paint Market Revenue Million Forecast, by Application 2019 & 2032
- Table 114: Global Low VOC Paint Market Volume K Tons Forecast, by Application 2019 & 2032
- Table 115: Global Low VOC Paint Market Revenue Million Forecast, by Country 2019 & 2032
- Table 116: Global Low VOC Paint Market Volume K Tons Forecast, by Country 2019 & 2032
- Table 117: Brazil Low VOC Paint Market Revenue (Million) Forecast, by Application 2019 & 2032
- Table 118: Brazil Low VOC Paint Market Volume (K Tons) Forecast, by Application 2019 & 2032
- Table 119: Argentina Low VOC Paint Market Revenue (Million) Forecast, by Application 2019 & 2032
- Table 120: Argentina Low VOC Paint Market Volume (K Tons) Forecast, by Application 2019 & 2032
- Table 121: Rest of South America Low VOC Paint Market Revenue (Million) Forecast, by Application 2019 & 2032
- Table 122: Rest of South America Low VOC Paint Market Volume (K Tons) Forecast, by Application 2019 & 2032
- Table 123: Global Low VOC Paint Market Revenue Million Forecast, by Type 2019 & 2032
- Table 124: Global Low VOC Paint Market Volume K Tons Forecast, by Type 2019 & 2032
- Table 125: Global Low VOC Paint Market Revenue Million Forecast, by Formulation Type 2019 & 2032
- Table 126: Global Low VOC Paint Market Volume K Tons Forecast, by Formulation Type 2019 & 2032
- Table 127: Global Low VOC Paint Market Revenue Million Forecast, by Application 2019 & 2032
- Table 128: Global Low VOC Paint Market Volume K Tons Forecast, by Application 2019 & 2032
- Table 129: Global Low VOC Paint Market Revenue Million Forecast, by Country 2019 & 2032
- Table 130: Global Low VOC Paint Market Volume K Tons Forecast, by Country 2019 & 2032
- Table 131: Saudi Arabia Low VOC Paint Market Revenue (Million) Forecast, by Application 2019 & 2032
- Table 132: Saudi Arabia Low VOC Paint Market Volume (K Tons) Forecast, by Application 2019 & 2032
- Table 133: South Africa Low VOC Paint Market Revenue (Million) Forecast, by Application 2019 & 2032
- Table 134: South Africa Low VOC Paint Market Volume (K Tons) Forecast, by Application 2019 & 2032
- Table 135: Rest of Middle East and Africa Low VOC Paint Market Revenue (Million) Forecast, by Application 2019 & 2032
- Table 136: Rest of Middle East and Africa Low VOC Paint Market Volume (K Tons) Forecast, by Application 2019 & 2032
Frequently Asked Questions
1. What is the projected Compound Annual Growth Rate (CAGR) of the Low VOC Paint Market?
The projected CAGR is approximately > 5.60%.
2. Which companies are prominent players in the Low VOC Paint Market?
Key companies in the market include The Sherwin-Williams Company*List Not Exhaustive, Arkema, Jotun, Berger Paints India Limited, AURO, American Formulating & Manufacturing, PPG Industries Inc, Benjamin Moore & Co, Nippon Paint Holdings Co Ltd, BASF SE, Cloverdale Paint Inc, Kalekim, Akzo Nobel N V, BioShield Paint Company, Crown Trade, Axalta Coating Systems LLC, Asian Paints, Kansai Paint Co Ltd, Fine Paints of Europe.
3. What are the main segments of the Low VOC Paint Market?
The market segments include Type, Formulation Type, Application.
4. Can you provide details about the market size?
The market size is estimated to be USD 8.84 Million as of 2022.
5. What are some drivers contributing to market growth?
Increasing Awareness about Harmful Effects of Conventional Paint4.1.2 increasing Demand in Architectural and Decorative Industry; Other Drivers.
6. What are the notable trends driving market growth?
Architectural and Decorative Segment to Dominate the Market.
7. Are there any restraints impacting market growth?
High Cost in Comparison to Conventional Paint; Other Restraints.
8. Can you provide examples of recent developments in the market?
N/A
9. What pricing options are available for accessing the report?
Pricing options include single-user, multi-user, and enterprise licenses priced at USD 4750, USD 5250, and USD 8750 respectively.
10. Is the market size provided in terms of value or volume?
The market size is provided in terms of value, measured in Million and volume, measured in K Tons.
11. Are there any specific market keywords associated with the report?
Yes, the market keyword associated with the report is "Low VOC Paint Market," which aids in identifying and referencing the specific market segment covered.
12. How do I determine which pricing option suits my needs best?
The pricing options vary based on user requirements and access needs. Individual users may opt for single-user licenses, while businesses requiring broader access may choose multi-user or enterprise licenses for cost-effective access to the report.
13. Are there any additional resources or data provided in the Low VOC Paint Market report?
While the report offers comprehensive insights, it's advisable to review the specific contents or supplementary materials provided to ascertain if additional resources or data are available.
14. How can I stay updated on further developments or reports in the Low VOC Paint Market?
To stay informed about further developments, trends, and reports in the Low VOC Paint Market, consider subscribing to industry newsletters, following relevant companies and organizations, or regularly checking reputable industry news sources and publications.
Methodology
Step 1 - Identification of Relevant Samples Size from Population Database


Step 2 - Approaches for Defining Global Market Size (Value, Volume* & Price*)

Note*: In applicable scenarios
Step 3 - Data Sources
Primary Research
- Web Analytics
- Survey Reports
- Research Institute
- Latest Research Reports
- Opinion Leaders
Secondary Research
- Annual Reports
- White Paper
- Latest Press Release
- Industry Association
- Paid Database
- Investor Presentations

Step 4 - Data Triangulation
Involves using different sources of information in order to increase the validity of a study
These sources are likely to be stakeholders in a program - participants, other researchers, program staff, other community members, and so on.
Then we put all data in single framework & apply various statistical tools to find out the dynamic on the market.
During the analysis stage, feedback from the stakeholder groups would be compared to determine areas of agreement as well as areas of divergence


